Yang, L., Li, G., Ritchie, M., Fioranelli, F. and Griffiths, H. (2017) Gait
Classification Based on Micro-Doppler Features. In: 2016 CIE International
Conference on Radar (Radar 2016), Guangzhou, China, 10-13 Oct
2016, (doi:
10.1109/RADAR.2016.8059301
)
This is the author’s final accepted version.
There may be differences between this version and the published version.
You are advised to consult the publisher’s version if you wish to cite from
it.
http://eprints.gla.ac.uk/150351/
Deposited on: 23 October 2017
Enlighten – Research publications by members of the University of Glasgow
http://eprints.gla.ac.uk
Gait Classification Based on Micro-Doppler Features
Le Yang ∗, Gang Li ∗,Matthew Ritchie†, Francesco Fioranelli‡, Hugh Griffiths†
* Department of Electronic Engineering, Tsinghua University, China
[email protected], [email protected],
† Department of Electronic and Electrical Engineering, University College London, UK
[email protected], [email protected]
‡School of Engineering, University of Glasgow, UK
[email protected] Abstract: This paper focuses on the classification of human
gaits based on micro-Doppler signatures. The micro-Doppler signatures can represent detailed information about the human gaits, which helps in judging the threat of a personnel target. The proposed method consists of three major steps. Firstly, the micro-Doppler signatures are obtained by performing time-frequency analysis on the radar data. Then two micro-Doppler features are extracted from the time-frequency domain. Finally, the one-versus-one support vector machine (SVM) is used to realize multi-class classification. Experiments on real data show that, with the selected features, high classification accuracy of the human gaits of interest can be achieved.
Keywords: micro-Doppler; classification; human gait; time-frequency analysis, support vector machine
I. INTRODUCTION
The classification and identification of human gaits based on micro-Doppler signatures has drawn more and more attention in recent years, because of its huge potential in surveillance, security, tracking and many other applications [1][2]. When radar observes a moving target, the constant Doppler shift of the received signal corresponds to the bulk motion of the target, while the micro-Doppler effect represents the motions of the parts of the target relative to its main body [1]. In many applications, the micro-motions can be used as a powerful tool for inferring the status of the target [3]. For example, the micro-Doppler effect caused by swinging of arms of a walking soldier can be used to infer whether he holds a gun [4]. There has been lots of literature on human gait classification based on micro-Doppler effect. In [5], the authors classify 7 kinds of human activities by selecting 6 features from the time-frequency spectrogram. In [6], the extraction of human features at long range based on micro-Doppler signals is studied. In [7], armed/unarmed personnel targets are distinguished based on multi-static micro-Doppler signatures. The method in [8] is capable of recognizing men and women. The feature extraction in the above literature are based on time-frequency analysis. Besides selection of features in time-frequency domain, there are other approaches of feature selection, including linear predictive coding (LPC) [9] ,
singular value decomposition (SVD) [10] and hierarchical image classification architecture (HICA) [11]. The existing literature indicate that, (1) the extraction of proper features is of great importance for accurate classification, and (2) the appropriate features may vary with different applications and with different radar and operational scenario parameters, such as aspect angle, dwell time, signal-to-noise ratio, and radar band.
In this paper, we focus on the classification of three kinds of human gaits, i.e., walking with no bag, walking with a bag held by one hand, and walking with a bag held by both hands, with a radar micro-Doppler sensor. We are interested in these three gaits because they are useful in public security, where quick and reliable detection of terrorist is required. The proposed method of micro-Doppler-based gait classification contains three steps: (1) obtain the time-frequency distribution of the radar signal via short-time Fourier transform (STFT), (2) extract micro-Doppler features from the time-frequency domain, and (3) classify the gaits using support vector machine (SVM). Regarding the micro-Doppler features, we choose two key parameters closely related to the characteristics of arm swinging, i.e., the Doppler offset and the bandwidth. The experimental results based on measured data demonstrate that the proposed method works well to recognize these three gaits of interest with high accuracy rate.
The remainder of this paper is organized as follows. Section II describes the field experiment setup with a continuous wave (CW) radar. Section III presents the detailed steps of the proposed method. Experimental results on measured data are presented in Section IV. Conclusion and remarks are given in Section V.
II. EXPERIMENTAL SETUP
We use an X-band CW radar with the carrier frequency 9.8GHz to collect data. The experiments were carried out in an open square within the campus of Tsinghua University. Fig. 1 shows the experimental scene, where the radar is located on a platform suspended 1 meter above the ground and one person walks towards the radar with a constant speed. Note that we denote the direction away from radar as positive direction. Five human subjects take part in the experiment and each recording corresponds to the test on a single human subject. Three different human gaits are considered, i.e., gait A: walking with no bag; gait B: walking with a bag held by one hand; and gait C: walking with a bag held by both hands. For each gait, 50 recordings are collected, with each target person 10 recordings.
Thus, the total number of recordings is (5 subjects)h(3 gaits)
h(10 measurements) = 150. The size and weight of the bag
This work is supported in part by the National Natural Science Foundation of China under Grants 61422110, 41271011 and 61661130158, and in part by the National Ten Thousand Talent Program of China (Young Top-Notch Talent), and in part by the Newton Advanced Fellowship of The Royal Society, and in part by the Tsinghua National Laboratory for Information Science (TNList), and in part by the Tsinghua University Initiative Scientific Research Program. Corresponding author: Gang Li.
used in the experiment is approximately 0.3m*0.15m*0.4m and 3 kg, respectively. v 10 m radar 1 m
Fig. 1 The experimental scene.
III. THE PROPOSED METHOD
The proposed method consists of three major steps, which will be described in details in this section.
A. Time-frequency analysis
The first step of our method is to obtain the micro-Doppler information from the measured data. We use STFT to obtain the time-frequency spectrogram.
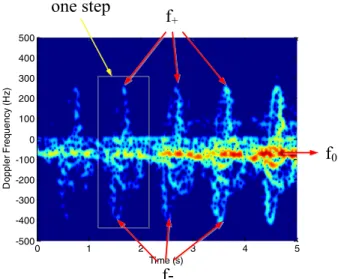
Fig. 2 shows a typical time-frequency spectrogram of the radar echo. In the time-frequency spectrogram, the strongest components, which mainly spread in the low Doppler frequency area, correspond to the movement of the torso. The
value of torso’s Doppler frequency indicates the walking speed
of the person. The periodic micro-Doppler components stand for the motions of arms or legs. The peak value of micro-Doppler component corresponds to the largest speed of
swinging limbs. We denote the torso’s Doppler frequency, the
positive peak value and the negative peak value as f0, f,
andf, respectively. Time (s) D oppl er F requency ( H z) 0 1 2 3 4 5 -500 -400 -300 -200 -100 0 100 200 300 400 500
f
0f-f
+ Tim 2 e (s) 3one step
Fig. 2 A typical time-frequency spectrogram B. Feature extraction
Here two features, i.e., the Doppler offset and the bandwidth, are extracted from the time-frequency spectrogram.
(1) Doppler offset. This is the difference between
micro-Doppler peak value relative to torso frequency
corresponding to the swinging limbs forward and backward. The Doppler offset indicates the symmetry of the swinging limbs. It would be zero if the swinging limbs forward and backward are exactly symmetric. The definition of Doppler offset is expressed as
( ) ( ) 0 0 1 ( ) ( ) 0 1 1 1 2 , N n n O n N n n n F f f f f N f f f N ª º ¬ ¼¦
¦
(1)where N is the total number of steps during the
observation time, ( )n
f and
( )n
f denote the positive and
negative values of the micro-Doppler peaks of the n-th
step, respectively.
(2) Bandwidth. This is frequency range the received signal
occupies. Denote the largest positive micro-Doppler peak value and the largest negative micro-Doppler peak value
as fmax and fmin, respectively, then the bandwidth can
be described as
max min.
B
F f f (2)
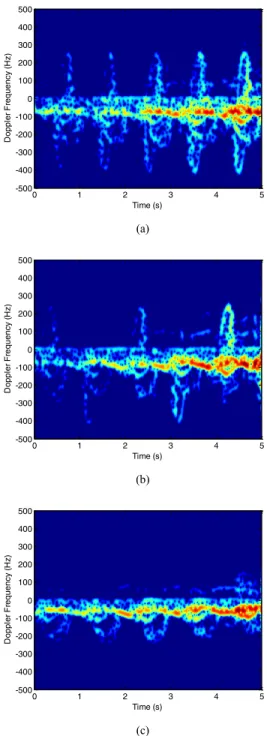
Fig. 3 illustrates the time-frequency spectrograms associated with the three kinds of gaits which we defined in Section II. In what follows, we investigate the difference among these gaits in terms of the selected features.
For gait A, i.e., walking with no bag, the two arms swing simultaneously but forward and backward, respectively. Therefore, for each pair of micro-Doppler components of one
step, the absolute value of f( )n
and -( )
n
f are large, and the
positive and negative micro-Doppler components are roughly
symmetric to the torso’s Doppler frequency. As shown in Fig.
3(a), for gait A, the values of ( )
0
n
f f and 0 ( )
n
f f in each
step are close to each other. Thus, the Doppler offset FO is
relatively small. It is obvious that the bandwidth FB of gait A
is large.
For gait B, because only one arm swings forward and backward and the other arm keeps almost static, the positive and negative micro-Doppler peaks caused by swinging arms appear alternately. As can be seen from Fig. 3(b), in each step,
one of ( )
0
| f n f |
and | 0 ( )|
n
f f has significant value, and
the other has very small value. As a result, the Doppler offset
O
F is larger than that of gait A. The significant micro-Doppler
peaks, i.e., f and f,are at the same level as that of gait A.
Thus, the bandwidth FB is also at the same level as that of
gait A.
For gait C, because the person walks with a bag held by both hands, he/she would clamp the arms on the body. The significant components of the time-frequency spectrogram come from the torso and the legs, and therefore, the micro-Doppler peak value of gait C is much smaller than that of gait A and gait B, as shown in Fig. 3(c). That is to say, for
gait C, both the micro-Doppler offset FO and the bandwidth
B
(a)
(b)
(c)
Fig. 3. Spectrogram of three kinds of human gaits. (a) Walking with no bag. (b) Walking with one bag held by one hand. (c) Walking with one bag held by
both hands.
In summary, the values of features FO and FB associated
with these three gaits are listed in Table I. This indicates the effectiveness of the selected features for the classification of these three gaits of interest.
TABLE I. CHARACTARISTICS OF THE FEATURES
Gait A Gait B Gait C
Value of FO small large small
Value of FB large large small
C. Classification
The final step of the proposed method is to input the extracted features into a proper classifier and execute the process of classification. We choose SVM as the classifier [12]. By learning the support vectors from the training data set, SVM can make a classification between two classes on the test data set with high accuracy and affordable computational cost. In this paper, three gaits need to be classified. To deal with the multi-class classification problem, we adopt the one-versus-one SVM method [13]. Firstly, we build 3 double-class SVMs
named SVM1, SVM2 and SVM3, respectively. SVM1 is
obtained with the training data of gait A and gait B. Similarly,
SVM2 is obtained with the training data of gait B and gait C,
and SMV3 is obtained from gait C and gait A. Note that the
training data of each class are selected randomly from the entire data set, and the rest are used as the test data. The test data are input into the three classifiers respectively. For each trial, all of the three classifiers yield a classification result. With the outputs of the three classifiers, a majority vote operation is applied: if more than one classification result labels are the same, then this label is chosen as the final classification result for the test data. If all the class labels outputted by the three classifiers are different from each other,
because one can’t exactly determine which classification result
is more reliable in this case, then the randomly selected result of any classifier can be used as the final result. In our approach,
the result of SVM1 is adopted.
IV. CLASSIFICATION RESULTS
Fig. 4 shows the feature distribution of the experimental data, in which there are 50 data recordings for each gait. The two axis denote the two features used for classification, namely the Doppler offset and the bandwidth. From Fig. 4 we can see that the feature vectors of the three gaits are clustered in different regions. This gives an intuitional interpretation of the effectiveness of classification of the three gaits based on the selected two features.
Fig. 4. Feature distribution of real data.
To investigate the performance of classification, we use 50 measured data for each gait. The classifiers are trained with 10%, 20% and 30% of the whole data set, respectively, and the Time (s) D oppl er F requency ( H z) 0 1 2 3 4 5 -500 -400 -300 -200 -100 0 100 200 300 400 500 Time (s) D oppl er F requency ( H z) 0 1 2 3 4 5 -500 -400 -300 -200 -100 0 100 200 300 400 500 Time (s) D oppl er F requency ( H z) 0 1 2 3 4 5 -500 -400 -300 -200 -100 0 100 200 300 400 500 0 20 40 60 80 100 120 140 0 100 200 300 400 500 600 700 800 900
Feature 1: Doppler offset (Hz)
F eat ur e 2: B andw id th ( H z ) Feature Distribution Gait A Gait B Gait C
rest are used for test. For each percentage setting, we perform 100 Monte Carlo trials. The accuracy/error rates of classification under different percentages of the training data are shown in Table II, Table III and Table IV, respectively.
TABLE II. ACCURACY AND ERROR PERCENTAGE: WITH 10% TRAINING
Gait A Gait B Gait C
Gait A 89.30% 6.74% 3.96%
Gait B 13.80% 82.62% 3.58%
Gait C 3.20% 11.56% 85.24% TABLE III. ACCURACY AND ERROR PERCENTAGE: WITH 20% TRAINING
Gait A Gait B Gait C
Gait A 90.08% 4.72% 5.20%
Gait B 12.66% 83.76% 3.58%
Gait C 0.80% 6.52% 92.68% TABLE IV. ACCURACY AND ERROR PERCENTAGE: WITH 30% TRAINING
Gait A Gait B Gait C
Gait A 90.20% 4.02% 5.78%
Gait B 11.80% 84.42% 3.78%
Gait C 0 4.66% 95.34%
The value in the table stands for the classification rate of being the row class and being classified as the column class. Thus, the diagonal entries are the accuracy rates and others are the error rates. From the tables it can be seen that, under the condition that the training set percentage is not lower than 10%, the proposed method always produces success classification rate larger than 0.82. Moreover, the classification accuracy can be higher as the training data are increased.
V. CONCLUSION
In this paper, we proposed a method for classification of three human gaits based on combination of micro-Doppler analysis and SVM. The human activities we are interested in include walking with no bag, walking with a bag held by one hand, and walking with a bag held by both hands, which may be meaningful for public security and automatic human identification. The features used to classify these three gaits are the Doppler offset and the bandwidth. The experimental results
on measured data demonstrate the effectiveness of the proposed method.
REFERENCES
[1] V. C. Chen, F. Li, S. S. Ho and H. Wechsler, "Micro-Doppler effect in radar: phenomenon, model, and simulation study," in IEEE Transactions on Aerospace and Electronic Systems, vol. 42, no. 1, pp. 2-21, Jan. 2006..
[2] V. C. Chen, D. Tahmoush, W. J. Miceli. Radar micro-Doppler signatures: processing and applications[M]. IET, 2014.
[3] V. C. Chen, F. Li, S. S. Ho and H. Wechsler, "Analysis of micro-Doppler signatures," in IEE Proceedings - Radar, Sonar and Navigation, vol. 150, no. 4, pp. 271-6-, 1 Aug. 2003.
[4] F. Fioranelli, M. Ritchie and H. Griffiths, "Analysis of polarimetric multistatic human micro-Doppler classification of armed/unarmed personnel," 2015 IEEE Radar Conference (RadarCon), Arlington, VA, 2015, pp. 0432-0437.
[5] Y. Kim and H. Ling, "Human Activity Classification Based on Micro-Doppler Signatures Using a Support Vector Machine," in IEEE Transactions on Geoscience and Remote Sensing, vol. 47, no. 5, pp. 1328-1337, May 2009.
[6] D. Tahmoush and J. Silvious, "Radar micro-doppler for long range front-view gait recognition," Biometrics: Theory, Applications, and Systems, 2009. BTAS '09. IEEE 3rd International Conference on, Washington, DC, 2009, pp. 1-6.
[7] F. Fioranelli, M. Ritchie and H. Griffiths, "Aspect angle dependence and multistatic data fusion for micro-Doppler classification of armed/unarmed personnel," in IET Radar, Sonar & Navigation, vol. 9, no. 9, pp. 1231-1239, 12 2015
.
[8] D. Tahmoush and J. Silvious, "Radar microDoppler for security applications: Modeling men versus women," 2009 IEEE Antennas and Propagation Society International Symposium, Charleston, SC, 2009, pp. 1-4.
[9] R. J. Javier and Y. Kim, "Application of Linear Predictive Coding for Human Activity Classification Based on Micro-Doppler Signatures," in
IEEE Geoscience and Remote Sensing Letters, vol. 11, no. 10, pp. 1831-1834, Oct. 2014.
[10] F. Fioranelli, M. Ritchie and H. Griffiths, "Classification of Unarmed/Armed Personnel Using the NetRAD Multistatic Radar for Micro-Doppler and Singular Value Decomposition Features," in IEEE Geoscience and Remote Sensing Letters, vol. 12, no. 9, pp. 1933-1937, Sept. 2015.
[11] F. H. C. Tivive, A. Bouzerdoum and M. G. Amin, "Automatic human gait Classification from Doppler spectrograms," 2010 2nd International Workshop on Cognitive Information Processing, Elba, 2010, pp. 237-242.
[12] V. N. Vapnik, "An overview of statistical learning theory," in IEEE Transactions on Neural Networks, vol. 10, no. 5, pp. 988-999, Sep 1999. [13] W. M. Lin, C. H. Wu, C. H. Lin and F. S. Cheng, "Classification of
Multiple Power Quality Disturbances Using Support Vector Machine and One-versus-One Approach," 2006 International Conference on Power System Technology, Chongqing, 2006, pp. 1-8.