Security decision-making among interdependent organizations
R. Ann Miura-Ko, Benjamin Yolken, John Mitchell, and Nicholas Bambos
Stanford University
Abstract
In various settings, such as when customers use the same passwords at several independent web sites, security deci-sions by one organization may have a significant impact on the security of another. We develop a model for security decision-making in such settings, using a variation of lin-ear influence networks. The linlin-ear influence model uses a matrix to represent linear dependence between security in-vestment at one organization and resulting security at an-other, and utility functions to measure the overall benefit to each organization. A simple matrix condition implies the existence and uniqueness of Nash equilibria, which can be reached by a natural iterative algorithm. A free-riding in-dex, expressible using quantities computed in this model, measure the degree to which one organization can poten-tially reduce its security investment and benefit from invest-ments of others. We apply this framework to investigate three examples: web site security with shared passwords, customer education against phishing and identity theft, and anti-spam email filters. While we do not have sufficient quantitative data to draw quantitative conclusions about any of these situations, the model provides qualitative in-formation about each example.
1. Introduction
In many settings, the security of one organization may depend on the security measures taken by others. For ex-ample, many web users enter the same password at multi-ple sites (10; 17). For this reason, compromise of a low-security site such as a high school reunion web site may provide valid user names and passwords for sensitive sites such as banks or online merchants. In such situations, it is not immediately clear how a bank should best protect its as-sets: should it invest more in protecting its own sites from compromise that might reveal its passwords, or donate se-curity services to non-profit organizations that could share users credentials? Perhaps the banking industry would be well served by forming a consortium to provide better au-thentication and web security to non-profits, who may be measurably free-riding on banking industry consumer edu-cation programs already. In order to address such questions,
we suggest a relatively simple model for evaluating risks, benefits, incentives, and investments by independent orga-nizations with interdependent operations. The main contri-butions of this paper are to present a core linear influence network model that is applicable to some sample security situations, and explore ways that the model can be used to understand risk and utility-based decision-making trade-offs. While there is clearly more work needed to establish a comprehensive theory of security decision-making in inter-dependent industries, we hope this paper identifies a useful connection between economic modeling techniques and se-curity problems that will be useful in further studies.
The quantitative model used in this paper is a variation of a class of recently proposed “linear influence networks” (5; 6), further discussed in section 2. In this model the de-pendence between a security investment at one organization and the resulting security benefit at another is assumed lin-ear. While there are likely to be non-linear relationships in some situations, it seems reasonable to use a linear ap-proximation within certain decision-making ranges. Fur-ther, in many situations of interest, it is not clear how to ob-tain meaningful estimates of numerical parameters for more complex non-linear models; a linear approximation is con-sistent with the accuracy of numerical input into the model. The model also includes a utility function for each orga-nization, representing the generally non-linear relationship between improved absolute security (measured, perhaps, in the probability of a break-in on a given day) and the to-tal value of all deployed security mechanisms to the firm. The use of a non-linear utility function is critical for mod-eling rational decision making, and distinguishes our model from simple probabilistic fault tolerance and failure mod-els that aim only to provide probability estimates of break-ins or failures. The main technical properties of the lin-ear influence network model we use in this paper are The-orem 4.2, stating that if the interaction matrix is strictly di-agonally dominant, the resulting game has a unique Nash Equilibrium, and Theorem 4.3 showing that under the same assumptions, a natural iterative strategy by all agents con-verges to the (unique) Nash equilibrium from any starting point. We also consider a free-riding index that measure the degree to which one organization can potentially reduce its security investment and reap the benefits from investments of others. This framework is able to provide quantitative
evaluations of possible investments, given sufficiently ac-curate quantitative estimates of the governing parameters. In addition, as we illustrate with sample case studies, it ap-pears possible to derive reasonable qualitative insight from ballpark estimates of relevant input quantities. The model provides an innovative analysis of the interdependent na-ture of security investments by enabling the relationships to be modeled in a flexible way. The relationships need not be symmetric and can be either beneficial or detrimen-tal to neighboring nodes. The investments themselves are restricted only to non-negative real numbers.
Game theoretic models of interaction “networks” have attempted to explicitly model how agents, connected by a set of links, make decisions based on the positive or nega-tive interactions found between players across these links (see section 2). The interactions represented by links in such a network, commonly known in economic circles as externalities, represent the additional cost or benefit in-curred by one player due to other players’ actions. Typ-ically, these externalities can lead to “suboptimal” invest-ments on the part of the players. The optimality of a set of investments can be measured in a number of ways but generally, we find that it can be assessed using two con-cepts: (1) amount of free-riding, which reflects the degree to which one player can invest less than they would in isola-tion, due to the net benefit accrued from other players, and (2) deviation from social optimum, which is the way players would invest if they were directed by a central planner that sought to maximize the total welfare of all of the players. A common theme found in the security scenarios we investi-gated is that there are both positive and negative interactions between independent agents. Intuitively, an investment in security by one agent may benefit others because the in-vestment reduces a risk shared by both players. A nega-tive interaction usually results from the fact that given two potential victims, an attacker will likely choose the path of least resistance. In other words, an investment in security by one party will increase the likelihood that the other agents within the network are attacked instead. The model we use in this paper incorporates both positive (beneficial) as well as negative (detrimental) externalities. Specifically, the im-mediate consequences of an agent’s actions are augmented by a linear function of others’ actions. The coefficients of this linear function can be either positive or negative, cor-responding to net positive and negative influences, respec-tively. Each player’s cost, however, is a function of its ac-tion alone. Under these condiac-tions, we consider the single stage, complete information game in which each player ef-fectively announces its strategy and receives some utility as a function of its neighbor-augmented decision.
The current password-based authentication method used widely at banks, financial institutions, retail sites, and many non-commercial sites provides an interesting case study. Given the opportunity, many users will use the same username and password for multiple websites,
re-gardless of the content of the site (10; 17). For example, some users might use the same password at Citibank and www.nytimes.com.In one Japanese survey of 1,091 In-ternet users,87.7%confessed that they tried to use the same username-password pair for multiple sites (20). If the user database at one website is more vulnerable to attack than at a more vigilant website, then the security efforts at more vigilant website are undermined by user behavior and lax security of other sites. In one sense, the increased invest-ment in security of one website could help other websites whose user base overlaps significantly with the website with increased investment. On the other hand, one website’s in-crease in security investments could simply lead to attack-ers’ shifting to other websites with lower security require-ments. We model these interdependencies, grouping sites into high security and low security sites, and show how in-terdependence causes certain websites to invest more than their fair share, while others may choose to free ride and not invest much at all.
Our second case study is based on customer education efforts aimed to combat phishing and online identity theft (see, e.g., (1)). Many banks are investing a significant por-tion of their security budget in customer educapor-tion, in an ef-fort to combat phishing. Whether it is through advertising or direct communication with their valued customers, financial institutions must clearly communicate what customers can expect from the banks to ensure that the email customers re-ceive or the website the customer just visited is legitimate. However, different institutions have different email policies, and sometimes undercut each others’ efforts. This may even occur within a single institution. For example, in confiden-tial discussion with a large bank, we found that two differ-ent policies are used: customers are informed that no links will ever be included in “service” email from the bank, but customers are not told that marketing email from the mar-keting division may include links. In such a situation, the information security division’s efforts to educate bank cus-tomers undercuts the marketing divisions effort to sell bank products, and conversely. We model how the customer ed-ucation efforts at various institutions (or even departments within a single institution) impact one another based on the consistency of the messaging between different organiza-tions in an example network. We show the resulting over-investment by a subset of the parties within the network due to a single entity with conflicting customer communication policies and show that the subset includes parties that have consistent messaging with the majority.
The third case study discussed in this paper is based on anti-spam efforts through email routing path verifica-tion, such as Sender ID, Sender Policy Framework (SPF), and Domain Keys (15; 19; 12). Generally speaking, these frameworks allow an organization that sends or routes email to insert information into the email that can be verified by the receiver. The verification method generally relies on extended DNS information, in some cases merely
requir-ing additional DNS records, and in other requirrequir-ing crypto-graphic information in email and verification keys in DNS records. At first glance, these mechanisms may appear to appeal only to an organizations altruistic motives: if orga-nization A adopts an email sender verification system, this appears only to benefit an organization B that receives email from A and verifies its sender. However, the true value of these mechanisms is more complex. As outlined in Mi-crosoft’s Sender ID Whitepaper (16), an organization that adopts Sender ID benefits directly by protecting the organi-zation’s brand against spammers who forge email from the organization. Another direct benefit is the enhanced deliv-ery of authentic email from the organization, as we discuss in section 6.3. While vendors claim that the cost of deploy-ing these methods is low, because the computational load on servers is relatively low (16), there are still system ad-ministration and maintenance costs that must by balanced against the direct and indirect benefits. In order to evalu-ate the situations in which an organization may rationally decide to adopt Sender ID or related mechanisms, we con-sider a model in which we have two types of nodes, busi-nesses and email service providers. Modeling an example network with six nodes, we show how in this case, email service providers have no incentive to invest in an email routing path verification framework. Despite the negative externality still present in this system, we find that overall, the businesses benefit from the relationships and in general invest less than they otherwise do as an isolated node. Re-sults are summarized in section 6.3.
2. Related Work
The literature which provides the context for this area of research can be divided into the economics of information security and network game theory.
The concept that security policy can be optimized through modeling is a growing area of research. Anderson(4) provides an overview of the body of work has been created around this discipline. They argue that fundamentally, divergent interests creates as much a problem as technical design with regards to information security. One of the foundational concepts that has been richly discussed is that the lack of information security is often considered to be a negative externality much like air pollution (9). As such, investment in information security causes positive externalities. While this is largely true, we suggest in this paper that the externality caused by investment in security can be both positive and negative.
The extent to which these externalities impact the level of investment by each party depends on not only the net-work, it depends on the nature of the relationships between the parties. Varian(18) examines free riding and welfare for several symmetric, two player models, including a “total ef-fort” structure that is similar to our linear influence formu-lation. Our work extends some of these ideas by allowing
for arbitrary numbers of players with potentially asymmet-ric relationships. We also introduce a metasymmet-ric for quantifying the extent of free riding, something not addressed in Var-ian’s work.
Another influential model along these lines is by Heal and Kunreuther(14) which notes the interdependent struc-ture of information security and studies the impact of this structure within a game theoretic framework. They charac-terize the equilibrium of a model in which agents choose to either invest or not invest where an investment in a par-ticular shared resource (the canonical example was airline baggage security) leads to increased security. Our work, in contrast, considers any level of investment in[0,∞)and al-lows for situations in which investments in security cause negative externalities. Within the context of information se-curity modeling, our major contribution here is a model that allows asymmetric relationships that can be characterized as either beneficial or detrimental with an arbitrary number of players.
Various network game theoretic models have been stud-ied in the existing literature. Most of these have assumed symmetry in either the underlying network or player utility functions. In particular, we call the reader’s attention to Ga-leotti et al.(13), a working paper that posits a general model for network games in which the payoff of each player is de-pendent only on its number of neighbors while these players have incomplete information about the network structure. Our model allows for players to have asymmetric payoffs and neighbor relationships but under an assumption of com-plete information.
In the working paper, Yolken et al.(6), we provide the theoretical results associated with this linear influence model and delve more deeply into technical details. We also present results which show how monotonic improve-ments can be made given perturbations of certain model parameters. Ballester et al.(5) similarly considers interde-pendent games and explore existence and uniqueness con-ditions relating these to the Katz centrality measure for the underlying network of player-to-player interactions. The fundamentals of our model, although developed indepen-dently, are the same in that they too, recognize the connec-tion between the optimality condiconnec-tions with respect to the Nash Equilibria and a linear complementarity problem. But where they focus on the the implications of their theory for the various cases of strategic substitutes and complements, this paper applies this model specifically to the case of in-formation security and discusses the implications of the as-sumptions made within this context with some qualitative insight into the information security context. We also show a convergent algorithm that allow agents to arrive at the Nash Equilibrium in a distributed manner. We were orig-inally motivated to study this linear influence model based on some of the interdependent relationships we saw in the security setting. Therefore, we consider the application in this setting not only natural but also quite important.
3
The Model
3.1
Network Model
Consider a network of autonomous players with interde-pendencies as discussed in the introduction. We represent this network using a weighted directed graph,G={N,E} of nodes N and edges E. Each node represents an au-tonomous player (e.g. an enterprise making security invest-ment decisions or websites) while the directed link between two players represents some sort of dependence between those players (e.g. the security of the originating node influ-ences the security of the destination node). The set of nodes has N elements, one for each player, indexed as ni for i= 1. . . N. The set of links, contains an elementeijif a
de-cision by nodeiinfluences nodej. For each edge there is an associated weight,ψij ∈ R, representing the “strength” of
the link or the degree of influence of one player on another. It follows that we can encode the combined connection and weight information into a single matrix,W ∈ RN×N, as follows: Wij= 1 ifi=j ψij ifeij ∈ E 0 otherwise (1)
An example network and the associated W matrix is shown in Fig. 1 above.
3.2
Incentive Model
Suppose that each player, i, autonomously chooses a level of investmentxi ∈ [0,∞). In vector form, we write
the investment levels of all players asx ∈ RN. Because
of interdependencies between the systems, actions by one node can produce either positive or negative influences / externalities on its neighbors, as discussed previously. In particular, assume that ifeij ∈ E, then nodej’s choice is
increased (or decreased) by the productψijxi. For ease of
notation, we takeW = WTin the remainder of this
pa-per, with the components of this matrix denotedwij. Note
thatWxirepresents the total effective investment in
secu-rity place by all players in the network into nodei. Suppose that each player/agent has an associate utility function that quantifies its relative preferences for certain x outcomes over others. One can think of this utility function as a func-tion that translates the effective investment in security into the total “benefit” experienced by that player.
We assume that these functions take the following, quasi-linear form:
Ui(x) =Vi((Wx)i)−cixi (2)
for some functionVi(·)andci>0for each user.cixiis the
linear cost due to the level of effort or investment made by agenti. n1 n2 n3 n4 0.6 0.5 −0.1 0.15 0.05 −0.2 W= 2 6 6 6 6 6 4 1 0 0 0 0.15 1 0 0 0 0.6 1 0.5 0.05 −0.2 −0.1 1 3 7 7 7 7 7 5
Figure 1. Example linear influence network and corresponding connection/weight ma-trix,W. Player1has no outgoing links, so its decisions have no effect on the other players. Player2’s investments produce a small posi-tive externality for1. Investments by player 3 produce relatively large positive externalities for players 2 and 4. Finally, players 4’s deci-sions produce a small positive externality on 1 and small negative externalities on 2 and 3.
For mathematical tractability, we make the following as-sumptions:
Assumption 3.1 EachVi(·)function is
1. continuous
2. strictly increasing, and 3. strictly concave on[0,∞). Moreover
4. V′
i(0)> ciand
5. limx−>∞Vi′(x)< ci
The fourth condition requires that the costs be low enough so that investment is feasible for each user; the fifth ensures that the optimal investment level for each user is finite. This form also suggests diminishing returns for each additional dollar of investment in security.
Given this model, we now consider the single stage, complete information game in which all players simultane-ously announce investment levels and receive utility from the resultingx. As is commonly done in the literature, we
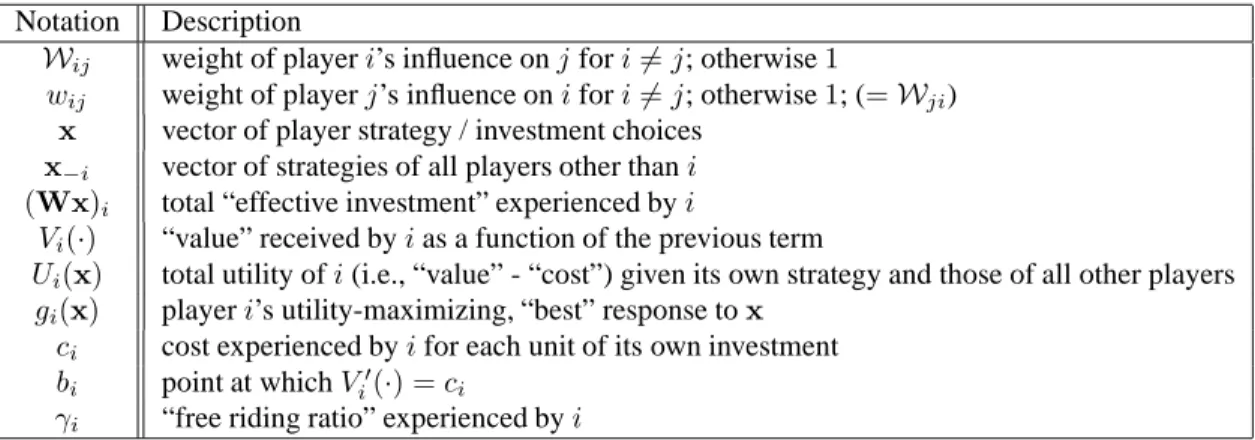
Notation Description
Wij weight of playeri’s influence onjfori6=j; otherwise1
wij weight of playerj’s influence onifori6=j; otherwise1; (=Wji)
x vector of player strategy / investment choices
x−i vector of strategies of all players other thani
(Wx)i total “effective investment” experienced byi
Vi(·) “value” received byias a function of the previous term
Ui(x) total utility ofi(i.e., “value” - “cost”) given its own strategy and those of all other players gi(x) playeri’s utility-maximizing, “best” response tox
ci cost experienced byifor each unit of its own investment bi point at whichVi′(·) =ci
γi “free riding ratio” experienced byi
Table 1. Summary of notation. More details for each term can be found in the appropriate sections of the paper body.
restrict our attention to outcomes which are Nash Equilib-ria (NE) in pure strategies, i.e. “stable” points at which no user has an incentive to unilaterally deviate. More formally, these arex= (xi,x−i)values for which
Ui(xi,x−i)≥Ui(x′i,x−i) ∀i, xi ∈[0,∞) (3)
Alternatively, one can also define a Nash Equilibrium in terms of a “best-response” function. To this end, let:
gi(x) =arg max xi≥0
Ui(xi,x−i) (4)
with g(x) = (g1(x, g2(x), . . . , gN(x))). It then follows
from the definitions above that a feasible investment vector,
x, is a Nash Equilibrium if and only if
x=g(x) (5)
i.e.,xis a fixed point ofg.
4
Equilibrium Properties
4.1
Optimality Conditions
We now examine the properties of equilibria in the given game, beginning with the associated optimality conditions. To this end, let bi represent the (single) positive value at
whichV′
i(·) = ci. By the assumptions made previously, biexists and is strictly positive for each user. birepresents
the optimal level of investment made by playerishould no network effects / externalities exist.
It then follows from the first order optimality conditions that any equilibrium,x, must satisfy
(Wx)i=bi ifxi>0
(Wx)i≥bi ifxi= 0
(6)
and, by the concavity assumptions made previously, that these conditions are also sufficient.
Equivalently, we can express the optimality conditions in terms of finding vectorsxandysuch that
y=Wx−b
yTx= 0
x≥0, y≥0
(7)
Any solution(x∗,y∗)encodes both the NE investment lev-els and the “slacks” on those users who invest nothing.
The conditions thus take the form of the classic, ex-tensively studied linear complementarity problem (LCP) (11)(7). Because, as mentioned previously, these optimality conditions are both necessary and sufficient, it follows that finding a NE for our game is equivalent to solving the asso-ciated LCP forx∗. By leveraging results from the latter, we can easily derive strong existence, uniqueness, and conver-gence results for the given game, as discussed in the next section.
4.2
Existence and Uniqueness
We begin with the following definition:Definition 4.1 A matrix A ∈ Rn×n is strictly diagonally
dominant in the row sense ifP
j6=i|wij|<|wii|= 1∀i.
SupposeWis strictly diagonally dominant. This has the interpretation, in the specific case of our model, that the in-vestment by all systems other thaniof some fixed amount produces less value fori, in absolute value, than individual investment of the same fixed amount. However, an entity’s investment in itself may end up being more valuable to an-other entity than to itself. The value of an investment is reflected in the utility function which can be different be-tween entities. In other words, even if a fixed amount of investment by one entity that doesn’t value security very
much may lead to a small amount of utility for that com-pany, that investment and subsequent improvement in secu-rity may lead to a relatively larger increase in utility for a neighbor that values security.
Based on this diagonally dominant feature, we now have the following uniqueness theorem:
Theorem 4.2 IfWis strictly diagonally dominant, then the given game has a unique Nash Equilibrium.
Proof: IfW is diagonally dominant, then it is also a P-matrix (i.e. the principal minors of W are positive). A P-matrix is a matrix in which every real eigenvalue of each principal submatrix is positive. A diagonally dominant ma-trix with positive diagonal elements has only positive real eigenvalues. Since each submatrix of a diagonally domi-nant matrix with positive diagonal elements is also diago-nally dominant with positive diagonal elements, it must be a P-matrix. ForWthat is a P-matrix, the associated LCP has a unique solution for anyb(see (11)(7)). This provides an equilibrium for the game.
4.3
Convergence
If the system is atx, and this point is a NE, then it follows by definition that no user will want to change its investment level unilaterally. If this point is not a NE, however, then one or more users will be “unhappy”. In this case, it seems intuitive that some subset of the latter will update their in-vestment levels to make them optimal given the currently observedx. Ideally, this process continues until a NE is reached, giving an easy to implement, distributed algorithm for converging to such a point1.
We can formalize such dynamics as follows. Let time be slotted and indexed ast = 0,1,2, . . .. Suppose that “best-response” updates are taken asynchronously and each agent responds using its own timescale. Using the notation found in (8), letTirepresent the set of times at which useri
up-dates its investment levelxi (if necessary). Assume that
these sets are infinite for each user implying that updates are done infinitely often. Now consider the following algo-rithm:
Algorithm 1 Asynchronous Best Response Dynamics
(ABRD) 1: Givenx(0)≥0 2: Sett←0 3: repeat 4: fori= 1. . . Ndo 5: ifi∈Tithen 6: xi(t+ 1) =gi(x(t)) 7: else 8: xi(t+ 1) =xi(t) 9: end if 10: end for 11: t←t+ 1 12: until converged
The stopping criterion is||x−g(x)||∞< ǫfor someǫ >0. Theorem 4.3 Suppose thatWis strictly diagonally domi-nant. Then, ABRD converges to the (unique) game NE from any starting point,x(0)≥0.
Proof: LetG = |I−W|, a non-negative matrix with all 0diagonal elements and a maximum row (or column) sum strictly less than1. By the Gershgorin circle theorem, it fol-lows that necessarilyρ(G)<1. Thus, from linear algebra theory, we have that there exists some N-component vector,
w>0, such that||G||w ∞<12.
In (author?) (3), it is proven that the synchronous algo-rithm satisfies:
|x(t+ 1)−x∗| ≤G|x(t)−x∗| (8)
Taking theLw
∞norm of both sides, we have
||x(t+ 1)−x∗||w ∞ ≤ ||G|x(t)−x∗| || w ∞ ≤ ||G||w ∞||x(t)−x∗|| w ∞ = β||x(t)−x∗||w ∞ (9)
for some constant0 < β < 1. Thus, the synchronous al-gorithm represents a pseudocontraction with respect to the weighted infinity norm.
Using the notation from (8), define the sets
X(k) ={x∈RN+ : ||x−x ∗ ||w ∞≤βk||x(0)−x∗|| w ∞} (10) We then have that:
1. . . .⊂X(k+ 1)⊂X(k)⊂. . .⊂X(0) 2. g(x)∈X(k+ 1) ∀kandx∈X(k) 3. For any sequencexk
∈X(k)∀k,limk→∞=x∗
4. For eachk, we can writeX(k) =X1(k)×X2(k)× . . .×Xn(k)for setsXi(k)⊂R+.
It then follows from the Asynchronous Convergence The-orem in (8) that the corresponding asynchronous algorithm, ABRD, also converges. We thus arrive at the desired result3.
5
Free Riding
As discussed previously, our model has the property that investments by one user can produce externalities on its neighbors. When a player benefits from positive externali-ties produced by a neighbor, the affected player ultimately invests less than it would in isolation. In economics, this is commonly referred to as “free riding”. For example, if a company has an finite optimal level of security it would like to have (due to the diminishing returns we described ear-lier), in isolation the company would investbi. However,
with positive externalities from its neighbors, that same company no longer needs to bear the full burden of invest-ing in security for itself. When a player receives negative externalities from a neighbor, the affected player is forced to invest more than it would in isolation. For example, if a company’s security is known to be more lax than a com-petitor’s, attackers may be more likely to attack. As a result, companies faced with such externalities are likely to try to invest more when a competitor increases their investment in security. These relationships are what we hope to capture with what we call the “free riding ratio” which we define more formally below.
5.1
Free Riding Ratio
To quantify the effects, we propose the following metric:
Definition 5.1 (Free Riding Ratio) Given the game
pa-rameters W,Vi(·), and c, we then define the free riding
ratio for each user,i, as:
γi=
(Wx)i−xi bi
(11) Likewise, define the vectorγas(γ1, γ2, . . . , γN).
So,γi represents the ratio of the externalities produced
byi’s neighbors over the amount it would invest in isola-tion. Sincebi > 0,||x|| < ∞, this ratio is always finite
and well defined. Note thatγican take any value inR. If
this quantity is negative, then we have a situation whereiis forced to over invest, since the neighbors’ contributions is a net negative. If this value is0, we have no free riding in either the positive or negative sense. If0 < γi < 1, then
we have some limited free riding, but, even in the most ex-treme case, useriis investing a positive amount. Ifγi≥1,
however, we have “complete” free riding andicontributes nothing and depends completely on its neighbors.
3 1 2
7 8 9
4 5 6
Figure 2. Network for web authentication ex-ample. Firms1and2are “high risk,” whereas all others are “low risk.” Dotted links have weight−0.1, thin, solid links have weight0.1, and thick, solid links are assigned a weight of0.2.
6
Examples and Simulations
6.1
Web Authentication
Consider a collection web-enabled firms. A connection between two firms implies that they have customers in com-mon who use the same username and password on both sites. If an attacker were able to steal the user database from one firm, decrypt the file and try the username and passwords on a neighboring site, they may be able to access confidential data or even worse, drain the funds out of an account. The level of security at one firm, then, impacts the risk faced by a neighboring firm.
In our model, each firm makes an investment in com-puter / network security which makes them less susceptible to hostile attacks on their data or network. In this specific example, we have two types of firms: “high risk” firms are those firms for whom security is a must. Due to the nature of their business, they are commonly targeted by attack-ers. This category includes financial institutions and gov-ernment agencies, among others. “low risk” firms are ones for whom security is nice to have. These firms are generally more social in nature (e.g. Classmates.com, Flickr). They are not the ultimate target of an attack but can be used as the inception point for an indirect attack on a “high risk” firm. In general, we can have the number of types be as large as needed.
One of the interesting aspects of this model is that when two firms from the same type are connected to one another, each is negatively impacted by its neighbor’s investment in security. Should a neighboring firm of the same type
in-vest in security, it makes that firm less attractive to attackers and the neighboring firms relatively more attractive to at-tack. When a “high risk” firm is connected to a “low risk” firm, they both benefit from a neighbor’s investment in secu-rity although this relationship is not symmetric; the benefit the “high risk” firm experiences from a neighboring “low risk” firm’s investment is larger than the benefit the “low risk” firm experiences from the same investment made by a neighboring “high risk” firm. This asymmetry results from the fact that an attacker will generally not attack a “high risk” firm in order to get access to one of its “low risk” neighbors.
Assume the utility function for firm i takes the form Ui(x) = βilog((Wx)i)−xi whereβi indicates the
rel-ative importance of security for that particular firm and is the same for any two firms of the same type. Naturally, the latter value is higher for a “high risk” firm than a “low risk” one. With this model in mind, we consider the exam-ple shown in Figure 2 above. Firms 1 and 2 are “high risk” while the rest are “low risk”. All edge weight values are denoted in the Figure caption.
We initially set β1 = β2 = 10, with βi = 1for the
remaining, “low risk” firms. The system equilibrium was computed using an ABRD algorithm. As shown in Table 2 above, the “high risk” firms are forced to invest more than their fair share in equilibrium (in this case by more than 10%) while firms 5, 6, 8, and 9 invest nothing. Firm 3 vests only a tiny amount because of the strong positive in-fluences of firm 1’s investment. Firms 4 and 7, on the other hand, invest nearly what they would if they were isolated nodes (since firm 3 invests very little). Translating this to the real world, it is fairly intuitive that the “high risk” com-panies such as banks end up spending a lot more on security when compared to content focused websites as this equilib-rium indicates.
Suppose firm1now wants to change the degree to which other smaller companies influence its security. One could drive this down through customer education efforts or even
Firm xi γi 1 11.09 −0.11 2 11.11 −0.11 3 0.09 0.91 4 1.01 −0.01 5 0 1.10 6 0 1.11 7 1.01 −0.01 8 0 1.10 9 0 1.11
Table 2. Equilibrium for web authentication example. All values are rounded to the near-est hundredth.
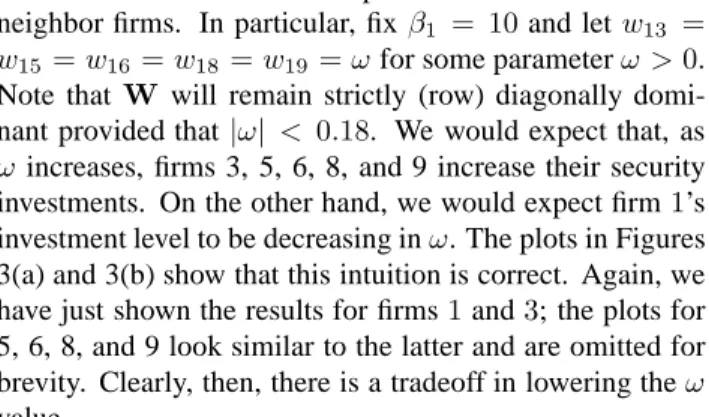
drive this down to zero by creating incompatible require-ments for the username and password with those of the neighbor firms. In particular, fixβ1 = 10and letw13 = w15=w16 =w18=w19 =ωfor some parameterω >0.
Note that W will remain strictly (row) diagonally domi-nant provided that |ω| < 0.18. We would expect that, as ω increases, firms 3, 5, 6, 8, and 9 increase their security investments. On the other hand, we would expect firm1’s investment level to be decreasing inω. The plots in Figures 3(a) and 3(b) show that this intuition is correct. Again, we have just shown the results for firms1and3; the plots for 5, 6, 8, and 9 look similar to the latter and are omitted for brevity. Clearly, then, there is a tradeoff in lowering theω value.
6.2
Phishing and Customer Education
Consider a collection firms or departments within a sin-gle firm. Two firms may have customers in common. In order to prevent phishing attempts, the firms invest in ed-ucating their customers about their firm’s communication policies using direct mail, advertisements and even email. For example, one firm may tell their customers that in email communications, they will never include a link. Another policy might be that any link included must begin with www.companyname.com. Many banks display an image chosen by the user that is embedded in the website of the firm to verify that the user is indeed at the firm’s website.Should two firms that share customers have the same communication policies, any customer education effort done by one firm would clearly benefit the other. On the other hand, if the communication policies contradict one an-other in any significant way, the customer education effort by one firm would serve to confuse the shared customers with respect to the other firm’s policies. The customer ed-ucation effort at one firm, then, impacts the risk faced by a neighboring firm.
There are three factors that determine the degree of in-fluence one firm has on another:
1. The number of shared customers
2. The degree to which policies agree or disagree 3. The importance or prevalence of those characteristics
the policy impacts (e.g. the number of emails that go out with embedded links)
Using the linear influence model described, each node is a company with a customer communication policy and a link exists between two nodes if there are shared customers between the nodes. One unique feature of this situation is that the interaction matrix W is symmetric since consis-tency or inconsisconsis-tency of the customer communication pol-icy will impact both parties. In this particular example, each node has identical utility functions,Vi(x) = 2√x. This can
0 0.05 0.1 0.15 0.2 0.25 0.3 0.35 11.08 11.085 11.09 11.095 11.1 11.105 11.11 11.115 11.12 ω x1 0 0.05 0.1 0.15 0.2 0.25 0.3 0.35−0.1115 −0.111 −0.1105 −0.11 −0.1095 −0.109 −0.1085 −0.108 −0.1075 gamma 1
(a) Firm 1:x1andγ1versusω
0 0.05 0.1 0.15 0.2 0.25 0.3 0.35 0.09 0.095 ω x3 0 0.05 0.1 0.15 0.2 0.25 0.3 0.350.905 0.91 gamma 3
(b) Firm 3:x3andγ3versusω
Figure 3. Web Authentication model: variation in investment levels (solid curves) and free riding ratios (dotted curves) of firms1and3as function of the parameterω.
1
2 3 4
5 6
Figure 4. Network for customer education ex-ample. Firm1 has inconsistent policies rela-tive to the other firms. Those firms (2-6) have policies that are consistent with one another. Dotted links have weight−0.2, and thin, solid links have weight0.1.
company (e.g. a financial institution of roughly the same size). Suppose the cost is allci = 0.50for all users. This
implies thatb = 0.25e. With a six user example shown in figure 4, we assume that consistent consumer policies sults in a 0.1 influence factor where inconsistent policies re-sult in a -0.2 influence factor. An inconsistent policy serves to confuse the consumer more than the reinforcement a con-sistent policy would provide.
We obtain the equilibrium for customer education invest-ment levels and free riding ratios as listed in table 3. In this example, the positive externalities experienced by node 3 serve to counteract the negative externality from node 1. Node 3, therefore is able to invest less than it otherwise
Firm xi γi 1 0.41 −0.66 2 0.29 −0.16 3 0.24 0.04 4 0.29 −0.16 5 0.18 0.28 6 0.18 0.28
Table 3. Equilibrium for phishing example. All values are rounded to the nearest hundredth.
would, 0.25. Nodes 2 and 4, on the other hand, must com-pensate for the negative externality they experience from node 1 and must invest more than they otherwise would. In total, the nodes invest 1.59 where they should be investing a total of 1.50 if there were no interaction. If node 1 changes its policy to be consistent with all of the other firms, every-one collectively invests less (0.15 for node 3 and 0.20 for all other nodes) so that the sum total of investment is 1.13, a 25% improvement in the level of investment needed by all of the firms. This model, then, serves to show the degree to which customer education costs could potentially be cut should policies actually be consistent between departments within a particular firm. Anecdotally, we have heard that even within a particular bank, the different product groups might have conflicting policies with regards to their cus-tomer communication. Such discrepancies clearly lead to increased cost either due to customer confusion or in the increased customer education effort required.
6.3
Spam and email path verification
As described in the introduction of this paper, an increas-ing number of organizations have adopted and deployed anti-spam efforts through email routing path verification frameworks such as Sender ID, Sender Policy Framework (SPF), and Domain Keys (15; 19; 12). Generally speak-ing, these frameworks allow an organization that sends or routes email to insert information into the email that can be verified by the receiver. In Sender ID, which evolved from SPF and the CallerID proposal developed by Microsoft, do-main owners must identify their sending mail servers by IP Address in new DNS records. Receivers then verify the Pur-ported Responsible Address (PRA) against the information stored in DNS to reject unauthorized messages (2). In the functionally similar Domain Keys approach developed by Yahoo!, domain owners must include a digital signature in outgoing messages and publish their public key in new DNS records. Receivers then verify the signature against the pub-lic key available in DNS to reject unauthorized messages (2). If the signature is not verified, the email is clearly sus-picious. However, the signature can be verified and found to be suspicious due to the originating domain address. This is generally accomplished using some type of reputation sys-tem.At first glance, these mechanisms may appear to appeal only to an organizations altruistic motives: if organization A adopts an email sender verification system, this appears only to benefit an organization B that receives email from A and verifies its sender. However, the true value of these mechanisms is more complex. As outlined in Microsoft’s Sender ID Whitepaper (16), Sender ID protects the send-ing organization’s brand against spammers who forge email from the organization. (However, the degree to which this occurs depends on how many receiving organizations ploy Sender ID.) Another direct benefit is the enhanced de-livery of authentic email from the organization. Specifi-cally, suppose organization A adopts Domain keys and this gives organization B a reliable way to identify legitimate email from A. Not only does this give B a better way to re-ject unsolicited email that purports to come from A, but B can be more certain about accepting legitimate email from A. In particular, email from A that might have been acci-dently blocked by a content-based spam filter can now be accepted by B and delivered to its intended recipient. If email from A to B has business value to A, then this in-creased delivery of legitimate email from A to B provides useful return on A’s investment in Domain Keys (or other such mechanisms). For all of these reasons, if organization A adopts a email sender verification framework, this also benefits other organizations that communicate with A by email. This leads to a very natural instance of the general linear influence network model, with influence between A and B based on the quantity or business value of email ex-changed by the two organizations.
While vendors claim that the cost of deploying these methods is low, because the computational load on servers is relatively low (16), there are still system administration and maintenance costs that must by balanced against the di-rect and indidi-rect benefits. In particular, the administrative costs can be high in maintaining a comprehensive inventory of all IP addresses that can legitimately send email on that organization’s behalf. This can actually be quite compli-cated given the wide range of partners or third party vendors that may do so on a fairly regular basis (e.g. public relations firms, investor relations, event marketing, help desk). Since there are several competing frameworks at present, an or-ganization can choose to deploy one or more of them, with increasing cost. In addition, a large organization can choose to leverage an email sender verification method for all of its incoming and outgoing email, or only a fraction, with costs varying accordingly.
The level of effort particularly implemented in recogniz-ing “suspicious email” within a reputation system will lead to increasing effectiveness which also shows diminishing returns (e.g. eventually an additional unit of effort in rec-ognizing spam has very little effect). A link between two organizations is the existence of email traffic between those two organizations. The weight associated with a link is de-termined by two competing interests:
1. Positive influence is derived from the volume of email as well as the business value of the email that traverses a link as long as both parties have implemented the email routing path verification. The outgoing email for a legitimate organization benefits from increased investment in email path verification by any neighbor since legitimate email traffic should pass through spam filters more reliably. Corporate communication will also now be verifiable, ensuring that customers are less likely to become victims of phishing scams. The in-coming email should benefit as well since increased investment by others should translate to a larger per-centage of incoming email traffic with verifiable email routing paths. In general, any adoption of path ver-ification should improve the load on the network by dropping spam.
2. Negative influence is derived from the fact that in-creased investment by one entity in email path verifica-tion will likely focus spammers on other organizaverifica-tions. Since spammers are trying to bypass spam filters with the least amount of effort, they are more likely to fo-cus on organizations with smaller investments in spam filters. As such, we can expect larger amounts of spam to be directed at organizations that have less effective email path verification or no such protection at all. In order to evaluate the situations in which an organi-zation may rationally decide to adopt Sender ID or related mechanisms, we consider a system in which there are two
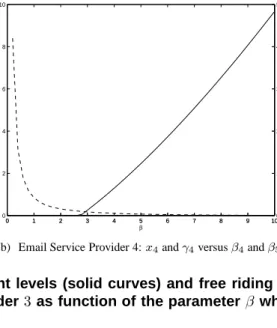
0 1 2 3 4 5 6 7 8 9 10 5.6 5.8 6 6.2 6.4 6.6 6.8 7 7.2 7.4 β x1 0 1 2 3 4 5 6 7 8 9 100.28 0.3 0.32 0.34 0.36 0.38 0.4 0.42 0.44 0.46 gamma 1
(a) Business 1:x1andγ1versusβ4andβ5
0 1 2 3 4 5 6 7 8 9 10 0 2 4 6 8 10 β x4 0 1 2 3 4 5 6 7 8 9 100 10 20 30 40 50 gamma 4
(b) Email Service Provider 4:x4andγ4versusβ4andβ5
Figure 5. Spam filtering model: variation in investment levels (solid curves) and free riding ratios (dotted curves) of business1and email service provider3as function of the parameter β which is changed for nodes4and5.
types of nodes: businesses that are potential targets for phishing scams (e.g. banks, payment services, online busi-nesses) and email service providers (e.g. hotmail, yahoo, gmail). As mentioned above, a link indicates email traffic between the two nodes. Each link has varying weights de-pending on the types of nodes it connects:
1. Business to email service provider: The externality is positive since an email service provider is more effec-tively able to filter for spam with more businesses par-ticipating. However, the impact of a single business on an email service provider is relatively small
2. Email service provider to business: The external-ity here on one hand is minimal since verifying the email service provider does little to reduce spam since spam tends to originate from many of these service providers. On the other hand, when the email service provider implements email path verification, this al-lows businesses who can verify their identity with their emails to ensure that their communication will reach their end customer without being falsely identified as spam. This is actually quite valuable to the business and results in a positive externality for the business. 3. Business to business: The externality is positive since
the path verification for an email from another business is valuable in identifying spam. There is a slight nega-tive externality resulting from the fact that any increase in investment for one business will result in phishing scams focused on other businesses (e.g. if I know that you have put in place an email path verification system, I am less likely to try to phish your customers since those emails are more likely to be filtered out). The
net externality is still positive since the sheer number of businesses makes that effect minimal.
4. Email service provider to email service provider: The externality is a net negative. Whereas when a business’ verification gives the author of the email credibility, the verification of an email service provider does lit-tle to ensure that the email received is not spam. In addition, similar to the business to business case, the implementation by another email service provider of email path verification or increase in investment will focus phishing scams and spam away from that email service provider potentially making its neighbor more susceptible to phishing attacks and spam.
As an example, we generated a small network of 6 nodes as seen in figure 6. Two nodes, 4 and5, are email ser-vice providers while the others are businesses. The utility function for each node is Ui(x) = βi((W x)i)αi. We set αi = 0.3 ∀i. We start withβi = 4 for all businesses and βi = 1for email service providers. This results in the
fol-lowing:
In this setting, as seen in table 4, the email service providers have no incentive to invest in providing email routing path verification. They are able to free-ride off of the investments made by the businesses. If the βi for
email service providers is gradually increased as seen in figure 5, the email service providers eventually have in-centive to invest in routing path verification (roughly when β4 =β5 = 3). What this means is that the email service
providers need to value this service (whether it is motivated by penalties imposed or by customer migration away from service providers who don’t provide this service) more in order for them to invest in this service.
1
2
3
4 5
6
Figure 6. Network for email routing path veri-fication example. Firms4and5are email ser-vice providers and the others are businesses. Dashed links have weight0.2, thin, solid links have weight 0.1, thick, solid links are as-signed a weight of−0.1and dotted links have weight0.05. Firm xi γi 1 5.18 0.29 2 5.18 0.29 3 5.18 0.29 4 0 1.14 5 0 1.14 6 7.25 0
Table 4. Equilibrium for email verification ex-ample. All values are rounded to the nearest hundredth.
The value of this model is not to say that these results are representative of actual relationships between businesses and email service providers. Rather, a decision maker with better knowledge of the incentives and quantitative data on the benefits associated with these decisions could use this type of model to create policies that serve the best interest of all involved parties.
7
Conclusion and future work
The game theoretic models of interaction “networks” is a useful framework by which we can address the interde-pendent nature of security investment decisions. The trade-off between the risk associated with information technology versus the cost of implementing security policies is a long standing problem. We offer in this paper one such model that can be applied in a number of different scenarios to
help inform better policy decisions.
We have developed a general quantitative model based on “linear influence networks” to model interdependent se-curity investments. The agents in this model interact in a game of perfect information resulting in a unique Nash Equilibrium. We show that an asynchronous, iterative strat-egy by all agents will converge to the unique Nash Equilib-rium from any starting point.
We applied this model in three different settings. In the first, we modeled the password-based web authentication method used in a wide variety of websites. We noted that many users use the same username and password at multi-ple sites. We showed how in this case, the overlap in users between websites created interdependencies that ultimately resulted in certain types of websites investing more than their fair share.
In a second scenario, we modeled the customer outreach efforts that aim to educate them on phishing and identity theft. Clearly inconsistent messaging results in significant over-investment in customer education. With this model, we can see which departments or firms are forced to over-invest as a result of inconsistent messaging.
Last, we applied this model to the email routing path ver-ification setting. Here, we model two types of entities: busi-nesses and email service providers. Based on the email traf-fic between these entities, various levels of externalities are exerted on the agents in the model. We found that in gen-eral, the email service providers were not always inclined to invest in routing path verification. It required making sure that the email service providers valued the routing path ver-ification service (through penalties for lack of installation or added benefits for installation) in order to motivate email service providers to invest.
These examples serve as case studies rather than true models of these scenarios. We hope that these examples can motivate the use of economic modeling and in particular, “network” game theoretic modeling of security problems to highlight incentives and risks associated with organizations that have interdependent operations.
Future work with this model includes design questions based on these models: given what we know, what incen-tives can we put in place to arrive at a “better” Nash equi-librium? Similarly, what changes can we make to the struc-ture of the network in order improve the resulting equilib-rium? We also plan to explore the possibility of relaxing some of the fundamental assumptions such as the diagonal dominance of the linear influence matrix. By doing so, we open the possibility of more generalized investment deci-sions so that agents can invest not only in themselves but in other entities as well. In doing so, we should be able to ad-dress a larger variety of questions including whether or not entities would be well served by subsidizing other entities in their security investments.
References
[1] Anti-phishing working group. http://www. antiphishing.org.
[2] Email service provider coalition. http:// senderid.espcoalition.org/.
[3] B. Ahn. Solution of nonsymmetric linear complemen-tarity problems by iterative methods. Journal of Op-timization Theory and Applications, 33:175–185, Jan 1981.
[4] Ross Anderson and Tyler Moore. Information security economics - and beyond. Technical report, 2007. [5] Coralio Ballester and Antoni Calvo-Armengol.
Mod-erate interactions in games with induced complemen-tarities. page 22, Jan 2007.
[6] Nicholas Bambos Benjamin Yolken, R. Ann Miura-Ko. Equilibria and free riding in linear influence net-works. 2007.
[7] A Berman and R J. Plemmons. Nonnegative Matrices in the Mathematical Sciences. Jan 1994.
[8] D P. Bertsekas and J N. Tsitsiklis. Parallel and dis-tributed computation: Numerical methods. Jan 1989. [9] L Camp and C Wolfram. Pricing security. Proceedings
of the CERT Information Survivability Workshop, Jan 2000.
[10] N. Chou, R. Ledesma, Y. Teraguchi, and J. Mitchell. Client-side defense against web-based identity theft. In Proc. NDSS, 2004.
[11] R Cottle, J Pang, and R E. Stone. The Linear Comple-mentarity Problem. Jan 1992.
[12] M. Delany. Domain-based email authentication using public keys advertised in the dns (domainkeys). IETF RFC 4870, May 2007.
[13] Andrea Galeotti, Sanjeev Goyal, Matthew O Jackson, Fernando Vega-Redondo, and Leeat Yariv. Network games, Apr 2006.
[14] Geoffrey Heal and Howard Kunreuther. You only die once: Managing discrete interdependent risks. NBER Working Papers 9885, National Bureau of Economic Research, Inc, August 2003. available at http://ideas.repec.org/p/nbr/nberwo/9885.html. [15] Microsoft. Sender id.http://www.microsoft.
com/mscorp/safety/technologies/ senderid/default.mspx.
[16] Microsoft. Sender id framework: Protecting brands and enhancing detection of spam, phishing, and zero-day exploits, 2007. http://download. microsoft.com/download/A/6/9/
A69ECA9D-6168-467E-9BEE-88358B9ED595/ Sender_ID_White_Paper.pdfx.
[17] B. Ross, C. Jackson, N. Miyake, D. Boneh, and J. Mitchell. Stronger password authentication using browser extensions. In Proc. Usenix, 2005.
[18] Hal R Varian. System reliability and free riding. Workshop on Economics and Information Security, Jul 2002.
[19] M. Wong and W. Schlitt. Sender Policy Framework (SPF) for Authorizing Use of Domains in E-Mail. IETF RFC 4408, April 2006.
[20] Ken Y-N. How to hack a quarter of all japanese web user accounts. What Japan Thinks http: //whatjapanthinks.com/2006/08/08/
how-to-hack-a-quarter-of-all-japanese-web-users-2006.