This is the author’s final, peer-reviewed manuscript as accepted for publication. The
publisher-formatted version may be available through the publisher’s web site or your
institution’s library.
This item was retrieved from the K-State Research Exchange (K-REx), the institutional
repository of Kansas State University. K-REx is available at
http://krex.ksu.edu
crs: A PACKAGE FOR NONPARAMETRIC SPLINE
ESTIMATION IN R
Anson T.Y. Ho, Kim P. Huynh, and David T. Jacho-Chávez
How to cite this manuscript
If you make reference to this version of the manuscript, use the following information:
Ho, A. T. Y., Huynh, K. P., & Jacho-Chavez, D. T. (2014). Crs: A package for
nonparametric spline estimation in R.
Published Version Information
Citation
: Ho, A. T. Y., Huynh, K. P., & Jacho-Chavez, D. T. (2014). Crs: A package for
nonparametric spline estimation in R. Journal of Applied Econometrics, 29(2), 348-352.
Digital Object Identifier (DOI)
: 10.1002/jae.2381
crs: A Package for Nonparametric Spline Estimation in R
Anson T. Y. Ho∗ Kim P. Huynh† David T. Jacho-Ch´avez‡November 6, 2013
1
Summary
crs is a library for R written by Jeffrey S. Racine (Maintainer) and Zhenghua Nie. This add-on package provides a collection of functions for spline-based nonparametric estimation of regression functions with both continuous and categorical regressors. Currently, the crspackage integrates data-driven methods for selecting the spline degree, the number of knots, and the necessary bandwidths for nonparametric conditional mean, IV, and quantile regression. A function for multivariate density spline estimation with mixed data is also currently in the works. As a bonus, the authors have also provided the first simple R interface to theNOMAD (‘nonsmooth mesh adaptive direct search’) optimization solver—seeAbramson et al. (2011) and Le Digabel (2011)—which can be applied to solve other mixed integer optimization problems that future users might find useful in other settings. Although thecrspackage shares some of the same functionalities as its kernel-based counterpart, thenp package (seeHarrison,2008) by the same author, it currently lacks some of the features the np package provides, such as hypothesis testing and semiparametric estimation. However, what it lacks in breadth, crs makes up in speed. A Monte Carlo experiment in this review uncovers sizeable speed gains compared to its np counterpart, with a marginal loss in terms of goodness of fit. Therefore, the package will be extremely useful for applied econometricians interested in employing nonparametric techniques using large amounts of data with a small number of discrete covariates.
∗
Department of Economics, Kansas State University, 327 Waters Hall, Manhattan, KS 66506-4000, USA. E-mail:
†
Bank of Canada, 234 Wellington Ave., Ottawa ON, K1A 0G9, Canada. E-mail: [email protected].
‡
Department of Economics, Emory University, Rich Building 306, 1602 Fishburne Dr., Atlanta, GA 30322-2240, USA. E-mail:
2
Installation and Functionality
Since crsis an add-on package, it is not automatically installed with R. However, it can easily be installed on a workstation with internet access using the command install.packages(), or downloaded directly fromhttp://cran.r-project.org/web/packages/crs/index.html for the latest official release. The most recent beta version of any upcoming release can be found at https://github.com/JeffreyRacine/R-Package-crs/. Like mostRadd-on packages, thecrslibrary will work on all commonly used operating systems such as MS Windows, Unix, Linux and Mac-OS X, and with most current hardware. The numerical exercises in this review were performed using the Bank of Canada LSF High Performance Cluster that runs under Linux.
2.1 Overview of Nonparametric Regression Spline Estimation
Unlike kernel smoothing, about which a great deal has been written—see among others Li and Racine (2007)—B-Splines (‘B’ stands for ‘basis’) and their implementation in applied work are not well known. Therefore, we now briefly discuss them.
Let {Yi,X>i ,Z>i }in=1 be a random sample from the joint distribution of (Y,X>,Z>) ∈ R× X × Z,
whereX ⊆Rd and Z⊂Nr0 are such that Rand N0 represent the real line and the set of natural numbers
including zero, respectively. The population is also known to fulfill the following location-scale nonparametric regression model of the form
Yi=g(Xi,Zi) +σ(Xi,Zi)εi, fori= 1, . . . , n,
whereg(·) represents the unknown function of interest, σ2(·) is the conditional variance of Y given X and
Z, and ε represents an error with mean zero given X and Z. Spline estimation of g(·) is based on the approximation g(X,Z) ≈ B(X)>β(Z), where β(·) is a finite vector of coefficients, and B(·) represents an ‘additive’, ‘tensor product’ or ‘generalized polynomial’ basis matrix constructed from Bj,j = 1, . . . , d, the basis matrix for continuous predictor j. Each column of each Bj is a piecewise local polynomial function evaluated at each data point and constructed with potentially differing polynomial order and number of segments. These functions are called B-splines, and the crs package utilizes the routines in the GNU Scientific Libraryhttp://www.gnu.org/software/gsl/ to construct them.
At the heart of thecrs library is thecrs command. Its various options make use of the following ‘loss function’ n X i=1 n Yi− B(Xi)>β(z) o2 L(Zi,z, λ), (2.1)
where L(·) is a product kernel weighting function given by L(Zi,z, λ) = Qsr=1l(Zis, zs, λs), l(·) represents a kernel function for either unordered or ordered categorical variable zs, s = 1, . . . , r, and λs ∈ [0,1] is a bandwidth. A model is selected via the crs command options: (1) degree (default ‘degree=3’, i.e.
cubic spline); (2) segments (default ‘segment=1’, i.e. number of knots minus one); (3) basis (default ‘basis="additive"’); and (4) lambda (i.e. a vector of bandwidths for each dimension of the categorical vectorz). When (3) is set to"auto",crsautomatically determines whether the additive or tensor product B-spline basis matrix for a multivariate polynomial spline or generalized B-spline polynomial basis should be used via cross-validation of (2.1). Similarly, when (4) is not specified (as in our Monte Carlo experiment), this vector of bandwidths can be automatically chosen via least-squares validation, generalized cross-validation, or a modified AIC method; seeNie and Racine(2012) for details.
In view of (2.1), the actual computation inside thecrsfunction call is performed using simple weighted least squares via R’s native command lm. Therefore estimates, residuals, gradients, standard errors, and fitted values can easily be extracted from the resultingcrsobject. Furthermore,R’s native functionssummary
and plotsupport objects of this type, which regular Rusers will find familiar.
The crs manual is comprehensive, and help for each of its functions can be obtained from inside R
by adding ‘?’ before the function name. In addition to viewing these examples within the help window, they can be executed by encapsulating the command’s name into example(...) atR’s command prompt, or using the demo(...) command instead. Since R’s object-oriented approach can be initially confusing, it is recommended that novice users visit the gallery of examples provided by the package maintainer at
http://socserv.mcmaster.ca/racinej/Gallery/Home.html. The ‘Fun Interactive Illustrations’ section on this page illustrates a range of features of kernel as well as spline estimation and regression using the ‘manipulate’ package under RStudio; seeRacine (2012) for a review of the latter.
Since the crs library proposes an alternative to standard kernel estimation, the next section provides a simple comparison with the np package based on an unrelated Monte Carlo regression design published elsewhere. It compares both packages in terms of goodness of fit and execution time by tuning their respective options to make the comparison fair.
3
Comparison with Kernel Methods: An Illustrative Example
The performance of the crs package is compared with that of the np package from the same author in terms of both fit and computational time. Our Monte Carlo experiment is based on the design of Linton and Jacho-Ch´avez (2010). Specifically, g(X, Z) = Xcos(πZX), with σ(X, Z) = σ, where Z is constant equal to one (Design 1), and Z ∈ {1, `} with equal probability 1/` (Design `) for ` ∈ {2, . . . ,5}. In each replication, X is generated from a univariate uniform distribution between [−2,2]. Similarly, ε is generated from a standard normal distribution independent of X and Z. In Design 1, Z is treated as a known constant so this design is univariate, while in Designs 2,. . . ,5,Z is treated as an ordered categorical covariate providing a multivariate counterpart with mixed data. The signal-to-noise ratio is controlled by setting σ ∈ {1/2,1}. For each σ, pseudo-random samples {Yi(s), Xi(s)}n
i=1 and {Y (s) i , X (s) i , Z (s) i }ni=1 of
different sizes, n∈ {500,1000, . . . ,9500,10000} are drawn in each of 20 replications, i.e. s= 1, . . . ,20. The
np functionnpreg is then used to estimate g(·) at each pseudo-data point in all designs using the settings
(...,regtype="lc",ckertype="gaussian",nmulti=1). The crs function from the crs package is then also used to estimate the same objects with the options
(...,basis="tensor",nmulti=1,complexity="knots",degree=3). The option complexity="knots" in the latter allows the user to use cross-validation to select the number of knots while keeping the spline degree to be equal to 3 (i.e. degree=3). Note that these settings make the resulting output automatically comparable across estimation techniques. In each replication, the ratio of execution time for both commands (Time) is recorded, as well as the ratio of the value of the Root Average Squared Error (RASE), i.e.
RASE(s)= v u u tn−1 n X i=1 [bg(X (s) i )−g(X (s) i )]2.
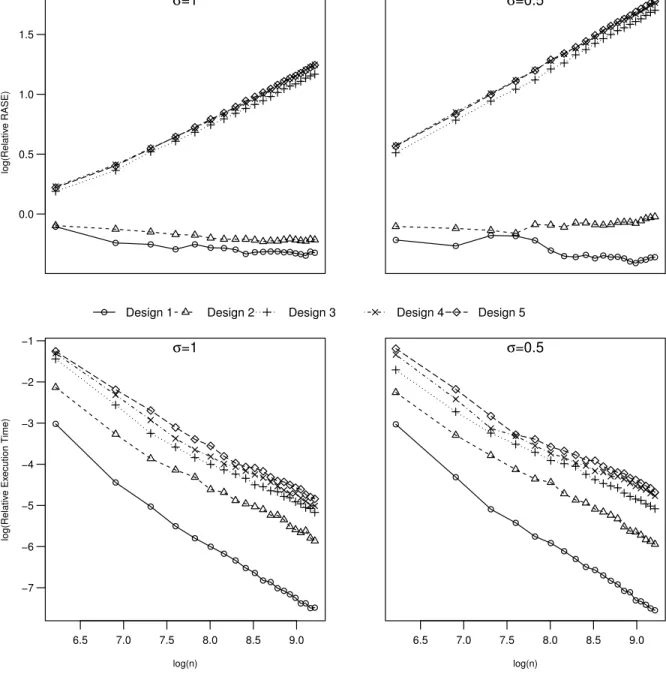
The mean log of the relative RASE and execution time (that obtained from the crscommand divided by that obtained from the npreg command) across replications versus log of the sample sizes are shown in Figure 1. The spline methods implemented in the crs package outperform their kernel counterparts in terms of fit only when there is a single continuous regressor, or when the discrete regressor takes on 2 possible values. As soon as the number of possible values that the discrete regressor can take on increases, the relative gains in terms of goodness of fit uniformly disappear, and in fact become relative losses for large sample sizes. This result is expected because spline estimates are ‘global’ fits unlike kernel estimates which are ‘local.’ As the number of observations and evaluation points, i.e. z in (2.1), increases, so does the number of points at which the proposed multivariate hyperplane is required to fit. Because of their global nature, splines are ideal when estimating infinite-dimensional nuisance parameters in multiple-step semiparametric estimation where simple consistency is required; see e.g. Escanciano et al. (forthcoming). As the signal-to-noise ratio decreases, these differences in global fit as measured inRASE are attenuated.
What spline methods implemented in thecrs library lack in fit performance is surprisingly made up in computational speed. The bottom two graphs in Figure1 show incredible gains in execution time relative to the npreg command in the np package. These gains seem to be linearly increasing with the log sample size. As with goodness of fit, these sizeable gains diminish with the number of potential values the discrete covariate can take on. This result is again somewhat expected in view of (2.1). The amount of time thecrs
package requires to solve (2.1) is proportional to the number of potential values that z can take on. These qualitative results are the same across different signal-to-noise ratios.
Figure 1: crs&np: Fit vs Execution Time 0.0 0.5 1.0 1.5 log(Relativ e RASE) σ=1
Design 1 Design 2 Design 3
σ=0.5 Design 4 Design 5 6.5 7.0 7.5 8.0 8.5 9.0 −7 −6 −5 −4 −3 −2 −1 log(n) log(Relativ e Ex ecution Time) σ=1 6.5 7.0 7.5 8.0 8.5 9.0 log(n) σ=0.5
aFirst and second rows of graphs display the mean log of relative Root Average Squared Error
(RASE) and execution time (that obtained from the crs command divided by that obtained from the npreg command), respectively, across 20 replications versus log of the sample sizes, i.e. n ∈ {500,1000, . . . ,9500,10000}.
bDesign 1 corresponds to a design with a continuous regressor only, while Designs 2,. . . ,5 correspond to
designs with a single continuous regressor as well as a single discrete regressor that takes on 2,. . . ,5 possible ordered values with equal probability, respectively.
4
Conclusion
Although, the crs package is not the first R library to provide spline methods in R (see Nie and Racine, 2012, for a list of available alternatives and a thorough comparison with the crs package), it is the most comprehensive one in terms of capabilities and functionality. Unlike most of its competitors, the crs
package has the capabilities to perform multivariate spline estimation with mixed data types. A simple Monte Carlo experiment here uncovers huge computational gains relative to kernel methods implemented in thenp package by the same author. The same experiment suggests that users will benefit most from using thecrspackage in regression models with a single continuous covariate or with discrete regressors that can take on a small number of potential values when using large data sets.
The theoretical underpinnings of the methods implemented in the crs library can be found in Ma and Racine (2013) and in a battery of working papers in the maintainer’s web site. We expect that, as these working papers pass the peer-reviewed process for publication, the functionality and breadth of methods in the library will be enhanced.
Finally, we should note that crs currently only provides a serial implementation of B-Spline methods, whereas its competing counterpart np is already available in a parallel one; seeHo et al. (2011). A similar implementation would be most welcome in future releases.
5
Acknowledgement
The authors would like to thank James MacKinnon, the Software Review Editor, for his guidance and encouragement. We are grateful to Jeffrey Racine for answering numerous questions and providing valuable feedback and suggestions. We acknowledge the usage of the crs and np package by Hayfield and Racine (2008) and Nie and Racine (2012), respectively. We thank Boyan Bejanov and Mark Rempel for their assistance with the Bank of Canada EDITH High Performance Cluster where all the computations were performed. The views expressed in this paper are those of the author. No responsibility for them should be attributed to the Bank of Canada.
References
Abramson M, Audet C, Couture G, Dennis, Jr J, Le Digabel S, Tribes C. 2011. The NOMAD project. Software available athttp://www.gerad.ca/nomad.
Escanciano JC, Jacho-Ch´avez DT, Lewbel A. forthcoming. Uniform convergence of weighted sums of non-and semi-parametric residuals for estimation non-and testing. Forthcoming inJournal of Econometrics. Harrison TR. 2008. Review of np software for R. Journal of Applied Econometrics 23: 861–865.
Hayfield T, Racine JS. 2008. Nonparametric econometrics: The np package. Journal of Statistical Software
27: 1–32.
Ho ATY, Huynh KP, Jacho-Ch´avez DT. 2011. npRmpi: A package for parallel distributed kernel estimation in R. Journal of Applied Econometrics 26: 344–349.
Le Digabel S. 2011. Algorithm 909: NOMAD: Nonlinear optimization with the MADS algorithm. ACM Transactions on Mathematical Software 37: 1–15.
Li Q, Racine JS. 2007. Nonparametric Econometrics: Theory and Practice. Princeton University Press. ISBN 0691121613.
Linton OB, Jacho-Ch´avez DT. 2010. On internally corrected and symmetrized kernel estimators for non-parametric regression. Test 19: 166–186.
Ma S, Racine JS. 2013. Additive regression splines with irrelevant categorical and continuous regressors. Statistica Sinica 23: 515–541.
Nie Z, Racine JS. 2012. The crs package: Nonparametric regression splines for continuous and categorical predictors. The R Journal 4: 48–56.
Racine JS. 2012. Rstudio: A platform independent IDE for R and Sweave. Journal of Applied Econometrics