Policy
ISSN: 2146-4553
available at http: www.econjournals.com
International Journal of Energy Economics and Policy, 2019, 9(2), 166-173.
Examining Rational Bubbles in Oil Prices: Evidence from
Frequency Domain Estimates
Adedoyin Isola Lawal
1*, Adeniyi Olayanju
1, Afeez Adebare Salisu
2,3, Abiola John Asaleye
1,
Olatunde Dahunsi
1, Oluwasogo Dada
1, Oluwasola Emmanel Omoju
4, Olabisi Rasheedat Popoola
11Landmark University, Omu Aran, Nigeria, 2Ton Duc Thang University, Ho Chi Minh City, Vietnam, 3University of Ibadan, Nigeria, 4Xiamen University, Xiamen, China.*Email: [email protected]
Received: 16 November 2018 Accepted: 06 February 2019 DOI: https://doi.org/10.32479/ijeep.7463
ABSTRACT
This study examined the existence of rational bubbles in oil prices by employing a frequency domain econophysics technique that have capacity to identify both explosive behaviour and bubbles in oil prices for the three largest oil future markets – WTI, Brent and OPEC basket. Our results show that the three prices experienced bubbles in four distinct periods. We attempt to provide some explanations on each of these bubbles using geopolitical, war and economic events. We equally noted that oil prices bubbles are largely influenced by the fact that oil is a major source of energy and is non-renewable. The study observed that existence of bubbles have some economic consequences such as welfare loss resulting from distortion in prices and economic instability among others. We provide some policy recommendation.
Keywords: Oil Prices, Rational Bubbles, Energy
JEL Classifications: C22, C50, G10, G12
1. INTRODUCTION
Over the years, financial and energy experts has devoted time to
investigate the existence or otherwise of rational bubblesin asset prices1 (oil prices inclusive). This is premised on the fact that
most recent financial crises are preceded by bubbles in real asset prices (Miao and Wang, 2015; Miao, 2014; Miao et al., 2015a; Lammerding et al., 2013; Escobari et al., 2017; Lawal et al., 2017; Sharma and Escobari, 2018; Branch, 2016; Caspi and Graham, 2018; Branch, 2016; Escobari et al., 2017). The impact of rational
bubbles on economic growth management, employment and the
financial system cannot be over-emphasized, given the recent evidence from global financial crisis (Kilian, 2008; Leung, 2010;
1 Evidence of rational bubbles implies that no long run relationship exist between asset prices and dividends (Kilian, 2008; Leung, 2010; Ye, et al., 2011; Coleman, 2012; Zhang et al, 2014; Narayan and Narayan, 2014; Maio et al., 2015; Martins and Ventura, 2015; Su et al., 2017)
Babajide et al., 2015; Babajide et al., 2016; Baur and Heaney, 2017; Lawal et al., 2018; Fashina, et al., 2018; Lawal et al., 2018; Lawal et al., 2016; Madsen et al., 2018; Babajide et al., 2016; Madsen et al., 2018; Ibrahim and Alagidede, 2018). For instance,
overshooting oil prices may induces erroneous adjustment of
monetary policy framework; it may expose market participants to significant financial losses (Lammerding et al., 2013), thus policy
makers, investors and other economic agents are expected to pay
keen attention to timely identification of rational bubbles in asset
prices so as to harness the windows of opportunity in preventing losses to investments and distortions in the economy.
The current study investigates the existence or otherwise of rational bubbles in the oil prices by employing a frequency domain model
capable of accounting for heteroskesdascity; allows for nonlinear structure in data with breaks; can detect multiple breaks; and
can detect explosive behavior and bubbles. These models can be
applied to data at any frequency and is more objective for real
time bubble detection. The study also employed (Engle, 2002)
simple dynamic conditional correlation model (DCC) to examine the links between bubbles across of oil market prices.
Our interest in oil is motivated by the fact that oil play strategic role in economic growth of nations as it often act as predictor variable
(Lorusso and Pieroni, 2018; Lee et al., 2017; Cuestas and Gil-alana, 2018; Lawal et al., 2018; Su et al., 2017; Cuestas and Gil-Alana, 2018; Shah, et al., 2018; Degiannakis et al., 2018). Over the years, it has been observed that wild fluctuation in oil prices induces huge
shocks on economic development with impact depending on the
side of the divide an individual economic is. For instance, with
sharp decline in prices, oil exporting countries experience drastic reduction in income while oil importing countries experience positive/upward shift in purchasing power. On the other hand, a
sudden upward surge in price inflicts suffering on oil importing economies characterized by fall in her purchasing power with a
possibility of downward presume on economic growth. Under this condition, for the oil exporting economies, upward surge in price connotes increase in income (all things seeing equal).
Furthermore, evidence abound to show that oil is an important
input factor of many products, thus, increases in oil prices may
distort production with significant effect on product prices, it may also induce inflationary pressure, causes recessions and bearish stock market (Domínguez-gijón et al., 2018; Fantazzini, 2016; Lorusso and Pieroni, 2018).
(Balcilar et al., 2014) noted that oil prices bubbles and crashes are
induced by a number of factors which includes political, military,
financial or economic shocks. The authors further classified the
causes into two categories that subjects crude oil prices to a level of sensitivity to all manner of information, given that the investors
in the market are ready to capitalize on available information so as to maximize profit. These categories are: Over dependent of global economic activities on crude oil as the source of energy;
and depletive nature of oil. They stresses that welfare loss owing to distortion in relative prices and economic instability, increase in employment resulting from job loss, wages and price level
fluctuating among others are the consequences of occurrence
of erratic bubbles and burst in crude oil. The authors suggested investment in alternative source of energy as crucial to curbing oil price bubbles stressing that total welfare gain that will accrue from preventing national bubbles outweigh the cost of investing in alternative energy sources.
Given this important role that oil plays, attention of huge investors has been drawn to the sector (Lawal et al., 2018; Sanders and Irwin, 2017; Zhang and Wang, 2015; Sanders and Irwin, 2017). As noted
by the US Energy information Administration (2015) oil prices
responds to a number of geopolitical, economic events, changes
in expectations on economic growth, non-economic fundamental
factors that distorts the long run cointegration between oil prices and the fundamentals suggesting the existence of rational bubbles.
(Lucas, 1978) pioneered empirical work on identification of
rational bubbles in asset prices. Ever since, a number of studies
attempted to investigate the presence or otherwise of asset bubbles with majority employing linear base models like (Johansen and
Juselius, 1992; Johansen, et al, 2000; Johansen and Juselius, 1992)
with symmetric adjustment which fails to capture asymmetries property of the data generating process as it has lower power in
an asymmetric adjustment process (Escobari et al., 2017); Su et al., 2017; Miao and Zhou, 2015b); these methods also fail to
incorporate structural breaks into the model, implying that the power to reject a unit decreases when stationary alternative is true
and structural break is ignored. Other methods includes
Markov-switching model that fails to distinguish between periods likely to appear spuriously explosive resulting from high variance and
periods with genuine explosive behavior (Funke et al., 1994; Phillips, 2011) PSY; (Phillips et al., 2015) (PWY) that have high
chances of erroneously interpreting the presence of explosive behaviour for the presence of rational bubbles (Balcilar et al.,
2016; Caspi and Graham, 2018; Ye et al., 2011). We extends extant literature by employing (Herzog, 2015) econophysics frequency
domain model that allows for stochastic bubbles, not prone to
model identification problem to examine the existence of bubbles
in the three leading oil market price indexes. The models allow for nonlinear structure in data with breaks, can detect multiple breaks. These models can be applied to data at any frequency and is more
objective for real time bubble detection (Bahmani-Oskooee et al., 2016; Almudhaf, 2017; Lee and Phillips, 2016; Caspi and Graham, 2018). We equally employed the DCC to analyses the correlations
between bubbles across oil markets.
For shadowing our results, it was observed that strong evidence
of bubbles occur in all the three oil markets prices. We also noted a clear overlap of bubbles periods across markets prior to the
2007 global economic meltdown. Our results also show that there
are strong relationships among each of the studied oil markets, with high level of correlation when the three oil markets exhibits bubbles. The same was noted when none of the markets exhibits
bubble suggesting huge potential for diversification of investment
during periods of bubbles in the markets.
The remaining part of this study is structured as follows: Section
2 provides a brief literature review; section three presents the material and methods; section 4 presents the results, while section five concludes the study.
2. LITERATURE REVIEW
The theoretical note for this study is based on the (Lucas, 1978)
framework that postulates existence of rational bubbles in asset prices. According to the narrative, rational bubbles exists when there is no long run relationships between asset prices and
dividends. (Campbell, 2012; Caspi and Graham, 2018; Ye et al., 2011, Branch, 2016) extended the model by relying on (Gordon, 1962) framework to calibrate the dividend demising yield into the
study on rational bubble. The author stressed that dividend growth
and return rate changes overtime. (Phillips, 2011; Phillips, et al., 2015) extends literature on rational note by introducing models that can detect change of dynamics from I (1) to an explosive
Extant literatures on rational bubble mainly focus on asset prices.
For instance, (Tran, 2017) examined the existence or otherwise
of rational bubbles in Latin America stock markets focusing on
Argentina, Brazil, Chile, Colombia, Mexico and Peru based on data sourced from 1990-2009, and observed that collapsing bubbles exist in the studied markets, with bubbles majorly influenced by the presence of foreign investors. His findings are similar to earlier findings like (Diego et al., 2015; Sharma and Escobari, 2018; Adämmer and Bohl, 2015) for the Latin America markets. In a related development, (Balcilar et al., 2016; Almudhaf, 2017)
among others have documented existence of explosive behavior (rational behavior) for some selected African markets.
Besides, the examination of rational bubble existence in stock markets, other applications have been found in real estate (Escobari
and Jafarinejad, 2016; Xie and Chen, 2015; Wu, et al., 2017; Versmissen and Zietz, 2017); banking crises (Miao and Wang, 2015; Virtanen et al., 2018; Drehmann and Juselius, 2014); Debt-to-GDP (Hong and Sraer, 2013; Bidian, 2015); Portfolio (Bidian, 2015; Bejan and Bidian, 2014; Bidian, 2016); Credit-to-GDP (Ftiti et al., 2016; Martin and Ventura, 2015) among others.
Literature on the investigation of rational bubbles as it relates to
commodity futures includes: (Ozdemir, 2016; Bohl et al., 2018; Barbaglia et al., 2016; Sanders and Irwin, 2017; Brooks et al., 2015; Algieri and Leccadito, 2018; Paris, 2018; Chen, 2015; Tsvetanov et al, 2016; Zhang and Yao, 2016; Lammerding et al., 2013; Brooks et al., 2015; Baldi et al., 2016; Balcilar et al., 2014; Su et al., 2017; Tsvetanov et al., 2016; Zhang and Wang, 2015; Sharma and Escobari, 2018; Su et al., 2017; Sharma and Escobari, 2018; Balcilar et al., 2014), oil inclusive. A major flaw of these studies is that they focused only on the period 2006-2008; despite
the fact that crude oil markets predates this periods, suggesting
the possibilities of bubbles before those periods. Furthermore, most of these studies employed Granger - causality and Johaneten
tests that are weak in capturing nonlinear structure and bubbles in the data set. A critical review of these studies also shows that
besides, (Balcilar et al., 2014; Ye et al., 2018) and (Sharma and Escobari, 2018) that focused only on oil, other discussed bubbles
in oil alongside other commodities. The issue here is that the salient features of each of the baskets of commodities that form
the samples used in the studies is ignored (Enders and Lee, 2012). It is also important to state that though (Balcilar et al., 2014; Sharma and Escobari, 2018; Su et al., 2017) focused on oil, none
of them considered OPEC series in their analysis. This creates a
gap in literature. The current study therefore fills these gaps by first extending the scope of the period of our analysis from February 1, 1986 to October 30, 2018. We equally followed (Herzog, 2015) to employ a more appropriate estimation techniques - Econophysics
frequency domain model that allows for stochastic bubbles, not
prone to model identification problems to test for the existence
of bubble as well as to identify the periods of explosive pricing behavior with focus on obtaining the dates of the beginning and the end of explosive behavior in the WTI, Brent and OPEC oil
prices. Furthermore the study attempted to examine the linkages among the series by employing the DCC-GARCH model.
3. MATERIAL AND METHODS
This study used daily data for the three world largest oil prices:
WTI; OPEC oil price index; and the BRENT Oil prices sourced from 01/02/1986 to 30/10/2018; obtained from the US EIA. As stated earlier, we followed Herzog (2015) to employ an
econophysics frequency domain model to conduct our analysis.
The strength of our frequency domain model like SADF, GSADF, SPP and GSPP is that it is not mandatory to have information on market fundamental when employing it (Diego et al., 2015); (Harvey et al., 2015). A major flaw of SADF, GSADF, SPP and GSPP methods is that they may lead to hasty conclusion that
there is an asset bubble, if they discover that market fundamental, that is positively correlated with the price of an asset is growing unprecedentedly above the existing level, whereas finding empirical evidence of explosive behavior does not necessarily
imply evidence of bubbles (Escobari et al., 2017).
(Herzog, 2015) frequency domain model have the capacity to
identify the beginning and ending of explosive behavior in a random walk, it can also identify multiple periods of explosive behavior within the historical as well as when new information
arrives in asset prices. These features make the model of significant
relevant to policy makers and investors. The model is as presented below.
Given that a functional relationship exist between trade volume, trading density and benefit-loss-field, the fundamental law of
Physics suggests that
q(p,t) = ρ(p,t)*u(p,t) (1)
Where trading volume equals q(p,t) = ρ(p,t)*(p,t), ρ(p(f,t), t given that pa<pi<pb. Factoring in the impact of news into our model based on the concept of a jump-discontinuity, we obtained
( )
( )
Í b , a p p t =∫
p t dp (2)Here, the integral is well define though ρ(p,t) has a
jump-discontinuity given that a jump connotes a trading stop or news.
In line with equation (1), q = ρ*μ, t. We derived equation (3) to
dt yields such that:
( )
(
)
(
)
( ) ( ) , , ( , ) , ( , ) b a a p p b a b a b p d dp d p t dp q p t p t q p t p t dt dt dt = − − − ∫
As noted by (Herzog, 2015), if the trading density on both sides changes
proportional, such that dpa dpb dps
dt = dt = dt and we equate equation
(3) to zero such that s
(
,) ( )
, q( , )( )
,a b b b
dp p t p t p t q p t
dt − = − ,
(
)
(
,,)
( , )( , )[ ]
[ ]
a b s a b q p t q p t q dp dt p t p t − = = − (3) Here,[ ] ( )
q :=q p t q p ts, −( )
s+, and ,[ ]
:=( )
p ts −( )
p ts+, .Ifwe substitute this into equations (3) and (2), we obtain
(
)
(
,,)
( , )( , ) * *u( ) a b s max max o o a b max o q p t q p t dp u dt p t p t − − = = − − (4)Given that efficient markets characterized by many news have potentials to induce on small bubbles; and that inefficient markets characterized by high asymmetric information with little news may induce large bubbles cum with established state of inefficiency in global oil prices (see for instance, Lawal et al., 2018), it is
important to account for the sources, types and signals of rational bubbles, thus we employed
* ( )* o o s max o u p t = − − (5)
Equation (5) suggests that increasing time, t, enforces an automatic fall in prices on asset prices as a result of news lag. Thus, more agents access the market to transact on asset, which induces herd behaviour and rational bubble.
The study also examined the bubble periods inter-link among the three oil markets by following (Escobari et al., 2017) to employ a DCC - Generalized Autoregressive Conditional Heteroskedascity (DCC-GARCH). The model is presented as follows:
t = +0 1 tk+t (6)
Where k
(
WTI, Brent, OPEC)
;(
WTI, Brent, OPEC)
.t t t t t t t t
= =
We model the time-variation of the variance-covariance matrix
Ht = GtCtGt
Ht= GtCtGt (7)
Given that GtCt are time varying, Ct is a (3*3) correlation matrix
and Gt is a (3*3) diagonal matrix.
4. RESULTS AND DISCUSSION
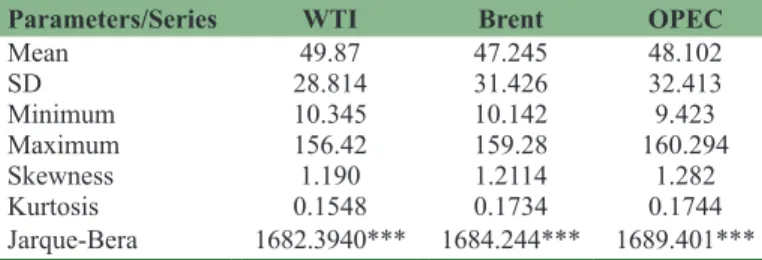
Table 1 presents the descriptive statistics of the series used in this research. From the results, it can be deduced that the series
are right skewed (in terms of skewness and kurtosis) towards the
right, while the Jarque-Bera normality test result shows that all the series are non-normally distributed suggesting that the series are
fat tailed with a probability of extreme values higher than normal distribution. The results of the ARCH tests show strong ARCH effect suggesting volatility persistence and clustering.
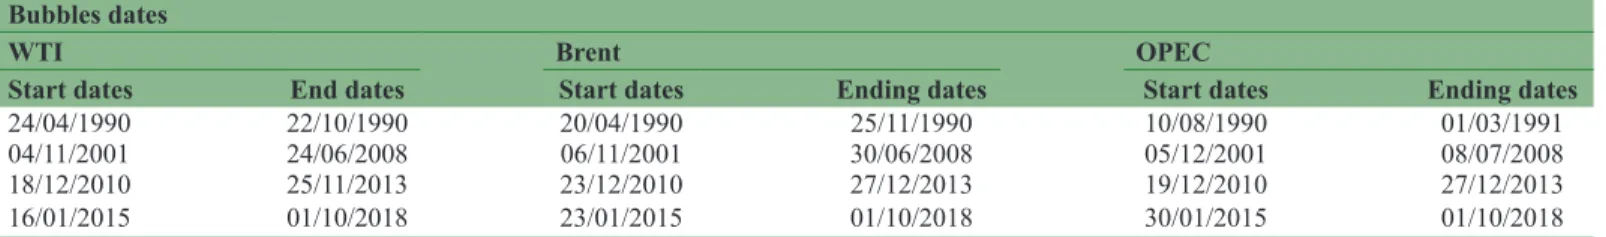
In Table 2; we present the results of the beginning and ending dates of bubbles identified by our model. Our results show that the
For instance the first bubble can be traced to uncertainly traceable to fluctuation in supply of oil because of 7 months Kuwait (Gulf) war of 1990/1991. This period was characterized with sharp swings in oil price, for instance oil prices surge up from about $17 per barrel (p/b) in April 1990 to a peak of $33 p/b in October, 1990; and fell sharply to about $17 p/b in March 1991. This development
created bubbles in the oil market with various bubbling duration,
for instance, the bubble lasted for 5.8 months (i.e., 180 days) for WTI, 7.1 months (i.e., 213 days) for Brent and 6.5 months (i.e., 201 days) for OPEC basket. The results on the duration are consistent with (Kilian, 2008; Balcilar et al., 2014) among others. Another sharp decline was noticed in between January 1997 and December 1998 as shown in Figure 1b. There was a sharp fall in oil price from $23 p/b in January 1997 to $10 p/b in December, 1998. This could be traced to the effect of East Asian Financial crisis of 1997/1998. OPEC responded to this fall in price by augmenting
her quota system. This induced an upward shift in price toward
recovery in the early part of 1999. Another bubble spring up in November, 2001 and spanned for 2432 days for WTI, 2441 days for Brent and 2424 days for OPEC prices, for instance price rose above $40 in 2004 from $25/b in September, 2003. As at August 11, 2005 oil price stood at $60 and $75 by the middle of 2006. It reached its highest level at $147.02 p/b on the 11th of July, 2008.
The bubble burst such that price fell to as low as $60 on November 6, 2008, and to $32/b at the end of December, 2008. The fluctuation
in price could be traced to Libya’s threat to cut output and OPEC’s President prediction of prices regarding events around Northern Summer, and the Lehman Brothers bankruptcy. Other factors that
influenced the sharps decline in price include increasing strength
of the US Dollar cum with a fall in European demand for oil.
From the curves, it can be seen that a temporary rise in price was noted in 2009 beginning in January to 13th February with price
rising to as $35 p/b. This coincides with tensions in Gaza strip. The periods 2010-2013 was characterized with some forms of steady price increase largely influenced political crisis in Egypt, Libya, Yemen, and Bahrain. Other factors are European Debt crisis; sanction on Iran over nuclear claims, refineries problems especially the August 7 California refinery fire, Tropical Storm
Ernesto, good news about US economic which all contributed to
about 20% hike in prices. On July 10, 2013, oil prices reached $108.51 p/b and continue to grow to $116.61 on August 28, 2013 owing to crises in the Middle East and blockage of the Suez Canal. There was a sharp fall in price on January 2, 2014 from $110.53 p/b
Table 1: Descriptive statistics
Parameters/Series WTI Brent OPEC
Mean 49.87 47.245 48.102 SD 28.814 31.426 32.413 Minimum 10.345 10.142 9.423 Maximum 156.42 159.28 160.294 Skewness 1.190 1.2114 1.282 Kurtosis 0.1548 0.1734 0.1744 Jarque-Bera 1682.3940*** 1684.244*** 1689.401*** Source: Authors, computation 2018. ***Implies 1% significance level
East2. By May 24, oil rose to $107.41 (Brent) due to re-surging problems in Libya, Houston ship channel collision among others.
The period 2015 to the second quarter of 2018 was characterized with low oil prices as prices hoovers below $80 p/b. In some cases it was as low as $36.46 p/b as noted on the December 30, 2015. The result of the DCC-GARCH estimation techniques are
presented in Table 3. From the result, it can be deduced that the
correlations among bubbles in the three series are greater than the unconditional correlations. This suggests strong evidence of interdependence among bubbles periods across these oil markets. It also implies that common macroeconomic shocks impact these series and there is evidence of clustering of prices. We equally observed that correlations among the markets are higher when all prices are either experiences bubble period or when none is experienced. This type of behaviour has been document for stock
markets (Lawal et al., 2017; Escobari et al., 2017; Leone and de Medeiros, 2015; Ye et al., 2011).
5. POLICY IMPLICATIONS
These results have some policy implications for various economic
agents. For instance, as earlier stated, a bubble in oil market could
2 The relative peace stimulates production in Iran, Libya and North Sea.
imply a potential economic slide among investors which usually
precedes financial crises, thus, policy makers should pay keen
attention to bubble occurrence in oil markets as it may induce
financial crisis (Baur and Heaney, 2017; Wang and Wong, 2015; Miao and Wang, 2015; Su et al., 2017; Kunieda and Shibata, 2016; Acharya and Naqvi, 2018). The monetary policy makers (Central
bankers) should always be cautious of the tin link between the US dollar and oil prices and the impact of the former on the latter’s bubbles, thus, make concerted efforts to achieve exchange rate stability so as to avoid taking unsound decision when making
monetary policy decision. Furthermore, since bubbles in the
oil price markets are systemic (resulting from war, geopolitical
crisis, economic crises) which is difficult to prevent, policy
makers should focus on investing in alternative sources of energy especially renewable energy so as to reduce the bubble tendency of oil prices as crude oil responds rapidly to information about these events.
On the part of investors, as argued by (Balcilar et al., 2014) oil bubbles are essentially influenced by two points; first, oil as a significant source of energy impacts global economic activities;
second, crude oil is a non renewable energy. These points
make crude oil market to be highly sensitive to fluctuation in
expectations on economic, geopolitical, wars, and other events that shapes global demand and supply of energy. Investors in the
Table 2: Beginning and ending dates of bubbles
Bubbles dates
WTI Brent OPEC
Start dates End dates Start dates Ending dates Start dates Ending dates
24/04/1990 22/10/1990 20/04/1990 25/11/1990 10/08/1990 01/03/1991
04/11/2001 24/06/2008 06/11/2001 30/06/2008 05/12/2001 08/07/2008
18/12/2010 25/11/2013 23/12/2010 27/12/2013 19/12/2010 27/12/2013
16/01/2015 01/10/2018 23/01/2015 01/10/2018 30/01/2015 01/10/2018
Sources: Authors’ computation 2018
Figure 1: (a) BRENT prices behaviour, (b) WTI prices behaviour, (c) OPEC prices behaviour
a b
crude oil markets should speculate in the product by effectively accommodating and calibrating the news from these events into their investment decision endeavors.
6. CONCLUSION AND RECOMMENDATION
The current study employed a frequency domain estimation technique to examined the existence or otherwise of rational bubbles in the global oil prices covering the three major oil price indices – WTI, Brent and the OPEC Basket using daily
data source from February 11, 1986 to October 30, 2018. We extend existing literature in three ways - Methodology, Data coverage and Series coverage. For instance, the study employed
an econophysics frequency domain framework to examined the existence or otherwise of rational bubbles in the series. Existing
studies employed time domain PSY, GSADF, BADF among other. As argued by (Escobari et al., 2017) though these techniques are good at testing for explosive behavior in asset prices, finding
explosive behavior does not necessary states that bubbles exist. Our study extends literature by building a mathematical model of bubbles from an econophysics frequency domain framework that have the capacity to identify both explosive behavior and bubbles in oil price indices.
In term of data coverage, the current study employed daily data on
the three most popular oil series - WTI, Brent and OPEC basket. Existing literature often use one of the series or at best two - WTI,
BRENT. Hardly will one see a literature that considered the three as used in the current study. OPEC Basket is key in determining global oil behavior as OPEC is a key player in of global oil market. It is also interesting to state that we employed daily data from
February 01, 1986 to October 30, 2018 making our work to cover
the most current trends in the global oil market.
Our findings show that the three prices experienced bubbles in four periods, 20th April 1990 to 10th August, 1st March 1991;
4th November, 2001 to 8th July, 2008; 18th December, 2010 to
27th December, 2013; and 16th January, 2015 to 1st October, 2018.
We attempts to provide explanations on each of these bubble dates using geopolitical and economic events as a practice in literature.
information on geopolitical, war and economic events; and that
investors in the crude oil markets are eager to beat the market. We
also noted that oil prices bubbles are largely influenced by the fact
that oil is a major source of energy for global economic activities
and that oil is non-renewable.
We noted that bubble have some economic consequences like welfare loss resulting from distortion in prices and economic
instability, increase in unemployment, inflation among others. We
recommend that to enjoy stability in oil prices, concerted efforts
should be made to reduce the over-sensitivity of crude oil future
market to information by increasing production of alternative sources of energy.
REFERENCES
Acharya, V., Naqvi, H. (2018), On Reaching for Yield and the Coexistence of Bubbles and Negative Bubbles. Journal of Financial Intermediation. Available from: https://www.doi.org/10.1016/j. jfi.2018.08.001.
Adämmer, P., Bohl, M.T. (2015), Speculative bubbles in agricultural prices. The Quarterly Review of Economics and Finance, 55(2015), 67-76. Algieri, B., Leccadito, A. (2018), Of the Commodity Futures
Modernization Act, Enacted by the Clinton Administration. Journal of Commodity Markets. Available from: https://www.doi. org/10.1016/j.jcomm.2018.05.008.
Almudhaf, F. (2017), Speculative bubbles and irrational exuberance in African stock markets. Journal of Behavioral and Experimental Finance, 13, 28-32.
Babajide, A.A., Lawal, A.I., Olukayode, S.R. (2016), Stock market volatility: Does our fundamentals matter? Economic Studies Journal, 18(3), 33-42.
Babajide, A.A., Lawal, A.I., Somoye, R.O.C. (2015), Monetary policy dynamics and the stock market movements: Empirical evidence from Nigeria. Journal of Applied Economic Sciences, 38(8), 1179-1188. Babajide, A.A., Lawal, A.I., Somoye, R.O.C. (2016), Stock market
response to economic growth and interest rate volatility: Evidence from Nigeria. International Journal of Economics and Financial Issues, 6(1), 354-360.
Bahmani-Oskooee, M., Chang, T., Ranjbar, O. (2016), Asymmetric causality using frequency domain and time-frequency domain (wavelet) approaches. Economic Modelling, 56, 66-78.
Balcilar, M., Gupta, R., Jooste, C., Wohar, M.E. (2016), Periodically
Table 3: Estimation results of DCC-GARCH model
Series WTI Brent OPEC
Panel A: Mean equation
δ0 0.430* (0.0107) 0.164* (0.0524) 0.178 (0.0504)
δ1 −0.0399* (0.0501) −0.135* (0.0679) −0.147* (0.0778)
Panel B: Mean equation
c 0.00445* (0.000701) 0.0504* (0.0168) 0.0304* (0.00541)
A 0.527* (0.0128) 0.482* (0.0842) 0.304* (0.0744)
B 0.487* (0.0415) 0.473* (0.142) 0.642* (0.138)
Panel C: Multivariate DCC equation
θ1 0.428* (0.0472)
θ2 0.137* (0.0342)
Observations 11675
χ2 16.59
χ2 (P-value) 0.00544
Source: Authors’ computation 2018. *Represents 1% significant level, figures in parentheses are standard errors t= +0 1 tk+t. where
( , , ); ( , , ).
k WTI Brent OPEC WTI Brent OPEC t t t t t t t t
= = The variance equation is express as 2 ( 1) (( 1))
i i i i i i
t t t
International Business and Finance, 38, 191-201.
Balcilar, M., Ozdemir, Z.A., Yetkiner, H. (2014), Are there really bubbles in oil prices? Physica A: Statistical Mechanics and Its Applications, 416, 631-638.
Baldi, L., Peri, M., Vandone, D. (2016), Stock markets’ bubbles burst and volatility spillovers in agricultural commodity markets. Research in International Business and Finance, 38, 277-285.
Barbaglia, L., Wilms, I., Croux, C. (2016), Commodity dynamics : A sparse multi-class approach. Energy Economics, 60, 62-72. Baur, D.G., Heaney, R. (2017), Bubbles in the Australian housing market.
Pacific Basin Finance Journal, 44, 113-126.
Bejan, C., Bidian, F. (2014), Bubbles and trading in incomplete markets. Journal of Mathematical Economics, 53, 137-144.
Bidian, F. (2015), Portfolio constraints, differences in beliefs and bubbles. Journal of Mathematical Economics, 61, 317-326.
Bidian, F. (2016), Robust bubbles with mild penalties for default. Journal of Mathematical Economics, 65, 141-153.
Bohl, M.T., Siklos, P.L., Wellenreuther, C. (2018), Speculative activity and returns volatility of Chinese agricultural commodity futures. Journal of Asian Economics, 54, 69-91.
Branch, W.A. (2016), Imperfect knowledge, liquidity and bubbles. Journal of Economic Dynamics and Control, 62, 17-42.
Brooks, C., Prokopczuk, M., Wu, Y. (2015), Booms and busts in commodity markets: Market, bubbles or Fundamentals? Journal of Futures Markets, 35(10), 916-938.
Brunnermeier, M.K. (2008), Bubbles. In: Durlauf, S., Blume, L., editors. New Palgrave Dictionary of Economics. 2nd ed. London: Palgrave
Macmillan. p1-17.
Campbell, G. (2012), Myopic rationality in a mania. Explorations in Economic History, 49(1), 75-91.
Caspi, I., Graham, M. (2018), Testing for bubbles in stock markets with irregular dividend distribution. Finance Research Letters, 26(12), 89-94. Chen, P. (2015), Global oil prices, macroeconomic fundamentals and
China’ s commodity sector comovements. Energy Policy, 87, 284-294. Cuestas, J.C., Gil-Alana, L.A. (2018), Oil price shocks and unemployment
in central and Eastern Europe. Economic Systems, 42, 164-173. Degiannakis, S., Filis, G., Panagiotakopoulou, S. (2018), Oil price shocks
and uncertainty: How stable is their relationship over time? Economic Modelling, 72, 42-53.
Diego, E., Damian, D., Andres, B. (2015), A time series test to identify housing bubbles. Journal of Economics and Finance, 39(1), 136-152. Domínguez-Gijón, R.M., Venegas-Martínez, F., Palafox-Roca, A.O., De
Estadística, N., De Economía, S., Nacional, I.P. (2018), Short-and long-term relations among prices of the Mexican crude oil blend, West Texas intermediate, and brent : Market trend and risk premia, 2005-2016. International Journal of Energy Economics and Policy, 8(3), 87-91.
Drehmann, M., Juselius, M. (2014), Evaluating early warning indicators of banking crises : Satisfying policy requirements. International Journal of Forecasting, 30, 759-780.
Enders, W., Lee, J. (2012), A unit root test using a fourier series to approximate smooth breaks. Oxford Bulletin of Economics and Statistics, 74(4), 574-599.
Engle, R.F. (2002), Dynamic conditional correlation-a simple class of multivariate GARCH models. Journal of Business and Economic Statistics, 20, 339-350.
Escobari, D., Garcia, S., Mellado, C. (2017), Identifying bubbles in Latin American equity markets: Phillips-perron-based tests and linkages. Emerging Markets Review, 33, 90-101.
Escobari, D., Jafarinejad, M. (2016), Date stamping bubbles in real estate investment trusts. Quarterly Review of Economics and Finance, 60, 224-230.
Fantazzini, D. (2016), The oil price crash in 2014/15 : Was there a
(negative) financial bubble ? Energy Policy, 96, 383-396.
Fashina, O.A., Asaleye, A.J., Ogunjobi, J.O., Lawal, A.I. (2018), Foreign aid, human capital and economic growth nexus: Evidence from Nigeria. Journal of International Studies, 11(2), 104-117.
Ftiti, Z., Kablan, S., Guesmi, K. (2016), What can we learn about commodity and credit cycles ? Evidence from African commodity-exporting countries. Energy Economics, 60, 313-324.
Funke, M., Hall, S., Sola, M. (1994), Rational bubbles during poland’s hyperinflation: Implications and empirical evidence. European Economic Review, 38, 1257-1276.
Gordon, H. (1962), The Investment, Financing and Valuation of the Corporation. Homewood, IL: Irwin.
Harvey, D.I., Leybourne, S.J., Sollis, R. (2015), Recursive right-tailed unit root tests for an explosive asset price bubble. Journal of Financial Econometrics, 13(1), 166-187.
Herzog, B. (2015), An econophysics model of financial bubbles. Natural Science, 7, 55-63.
Hong, H., Sraer, D. (2013), Quiet bubbles. Journal of Financial Economics, 110(3), 596-606.
Ibrahim, M., Alagidede, P. (2018), Effect of Financial Development on Economic Growth in Sub-Saharan Africa. Journal of Policy Modeling, Available from: https://www.doi.org/10.1016/j. jpolmod.2018.08.001.
Johansen, S., Juselius, K. (1992), Testing structural hypothesis in a multivariate co integration analysis of the PPP and UIP for UK. Journal of Econometrics, 53, 211-244.
Johansen, S., Mosconi, R., Nielsen, B. (2000), Cointegration analysis in the presence of structural breaks in the deterministic trend. Econometrics Journal, 3, 216-249.
Kilian, L. (2008), Exogenous oil supply shocks: How big are they and how much do they matter for the US economy. Review of Economics and Statistics, 90, 216-240.
Kunieda, T., Shibata, A. (2016), Asset bubbles, economic growth, and a self-ful filling financial crisis. Journal of Monetary Economics, 82, 70-84.
Lammerding, M., Stephan, P., Trede, M., Wil, B. (2013), Speculative bubbles in recent oil price dynamics : Evidence from a Bayesian Markov-switching state-space approach. Energy Economics, 36, 491-502. Lawal, A.I., Asaleye, A.J., Olorunkanmi, J.I., Popoola, O.R. (2018),
Economic growth, agricultural output and tourism development in Nigeria: An application of the ARDL bound testing approach. Journal of Environmental Management and Tourism, 28(4), 786-794. Lawal, A.I., Babajide, A.A., Nwanji, T.I., Eluyela, D. (2018), Are oil
prices mean reverting ? Evidence from unit root tests with sharp and smooth breaks. International Journal of Energy Economics and Policy, 8(6), 292-298.
Lawal, A.I., Nwanji, T.I, Adama, J.I., Otekunrin, A.O. (2017), Examining the Nigerian stock market efficiency: Empirical evidence from wavelet unit root test approach. Journal of Applied Economic Sciences,12(6), 52, 1680-1689.
Lawal, A.I., Nwanji, T.I., Asaleye, A., Ahmed, V. (2016), Economic growth, financial development and trade openness in Nigeria: An application of the ARDL bound testing approach. Cogent Economics and Finance, 4(1), 1-15.
Lawal, A.I., Oye, O.O., Toro, J., Fashina, O.A. (2018), Taxation and sustainable economic growth: Empirical evidence from Nigeria. In: Sengupta, P.P., editor. Contemporary Issues on Globalization and Sustainable Development. Vol. 1. New Delhi: Serials. p121-144. Lawal, A.I., Somoye, R.O., Babajide, A.A. (2017), Are African stock
markets efficient? Evidence from wavelet unit root test for random walk. Economics Bulletin, 37(4), 1-16.
Lee, C.C., Lee, C.C., Ning, S.L. (2017), Dynamic relationship of oil price shocks and country risks. Energy Economics, 66, 571-581.
Lee, J.H., Phillips, P.C.B. (2016), Asset pricing with financial bubble risk. Journal of Empirical Finance, 38, 590-622.
Leone, V., de Medeiros, O.R. (2015), Signalling the dotcom bubble: A multiple changes in persistence approach. Quarterly Review of Economics and Finance, 55, 77-86.
Leung, G.C.K. (2010), China’ s oil use, 1990-2008. Energy Policy, 38, 932-944.
Lorusso, M., Pieroni, L. (2018), Causes and consequences of oil price shocks on the UK economy. Economic Modelling, 72(1), 223-236. Lucas, R.E. (1978), Asset prices in an exchange economy. Econometrica,
46, 1429-1445.
Madsen, J.B., Islam, R., Doucouliagos, H. (2018), Inequality, financial development and economic growth in the. European Economic Review, 101, 605-624.
Martin, A., Ventura, J. (2015), The international transmission of credit bubbles : Theory and policy. Journal of Monetary Economics 76, 37-56. Miao, J. (2014), Introduction to economic theory of bubbles. Journal of
Mathematical Economics, 53, 130-136.
Miao, J., Wang, P. (2015), Banking bubbles and financial crises. Journal of Economic Theory, 157, 763-792.
Miao, J., Wang, P., Zhou, J. (2015a), Asset bubbles, collateral, and policy analysis. Journal of Monetary Economics, 76, S57-S70.
Ozdemir, Z.A. Sornette, D., Balcilar, M., Gupta, R., Yetkiner, H. (2016), LPPLS Bubble Indicators over Two Centuries of the S and P 500 Index. Swiss Finance Institute Research Paper No. 16-05.
Paris, A. (2018), On the link between oil and agricultural commodity prices : Do biofuels matter ? International Economics, 2017, 1-13. Phillips, P., Shi, P., Yu, J. (2015), Testing for multiple bubbles: Historical
episodes of exuberance and collapse in the S and P500. International Economic Review, 56(4), 1043-1078.
Phillips, P.C.B. (2011), Explosive behavior in the 1990s nasdaq : When did exuberance escalate asset values ? International Economic Review, 52(1), 201-226.
Sanders, D.R., Irwin, S.H. (2017), Bubbles, froth and facts: Another look at the masters hypothesis in commodity futures markets. Journal of Agricultural Economics, 68(2), 345-365.
Shah, I.H., Hiles, C., Morley, B. (2018), How do oil prices, macroeconomic factors and policies affect the market for renewable energy ? Applied Energy, 215(2), 87-97.
Sharma, S., Escobari, D. (2018), Identifying price bubble periods in the
energy sector. Energy Economics, 69, 418-429.
Su, C.W., Li, Z.Z., Chang, H.L., Lobonţ, O.R. (2017), When will occur the crude oil bubbles? Energy Policy, 102, 1-6.
Tran, T.B.N. (2017), Speculative bubbles in emerging stock markets and macroeconomic factors: A new empirical evidence for Asia and Latin America. Research in International Business and Finance, 42, 454-467.
Tsvetanov, D., Coakley, J., Kellard, N. (2016), Bubbling over! The behaviour of oil futures along the yield curve. Journal of Empirical Finance, 38, 516-533.
Versmissen, J., Zietz, J. (2017), Is there a leverage target for REITs? Quarterly Review of Economics and Finance, 66, 57-69.
Virtanen, T., Tölö, E., Virén, M., Taipalus, K. (2018), Can bubble theory foresee banking crises? Journal of Financial Stability, 36, 66-81. Wachira, P.N. (2013), The January Effect and Market Returns : Evidence
from the Nairobi securities Exchange a Research Project Submitted in Partial Fulfillment of the Requirements for the Award of the Degree of Master of Science in Finance, School of Business University of Na. Wang, M., Wong, M.C.S. (2015), Rational speculative bubbles in the US
stock market and political cycles q. Finance Research Letters, 13, 1-9. Wu, M., Huang, P., Ni, Y. (2017), Capital liberalization and various
financial markets: Evidence from Taiwan. Quarterly Review of Economics and Finance, 66, 265-274.
Xie, Z., Chen, S.W. (2015), Are there periodically collapsing bubbles in the REIT markets? New evidence from the US. Research in International Business and Finance, 33, 17-31.
Ye, J., Dang, Y., Li, B. (2018), Commun nonlinear sci numer simulat grey-markov pre diction model base d on background value optimization and central-point triangular whitenization weight function. Communications in Nonlinear Science and Numerical Simulation, 54, 320-330.
Ye, Y., Chang, T., Hung, K., Lu, Y.C. (2011), Revisiting rational bubbles in the G-7 stock markets using the fourier unit root test and the nonparametric rank test for cointegration. Mathematics and Computers in Simulation, 82(2), 346-357.
Zhang, Y., Wang, J. (2015), Exploring the WTI crude oil price bubble process using the markov regime switching model. Physica A, 421, 377-387.
Zhang, Y., Yao, T. (2016), Interpreting the movement of oil prices : Driven by fundamentals or bubbles? Economic Modelling, 55, 226-240.