Efficiency in the Ethiopian Banking System: An Application of
Data Envelopment Analysis
Tesfaye Boru Lelissa
PHD student at University of South Africa(UNISA) Manager, Risk and Compliance Department, Zemen Bank S.C.
[email protected], P.O.BOX 1212 Abstract
The study is basically intended to conduct assessment on the efficiency level of Ethiopian Banks for the period 2008-2012 using the Data Envelopment Analysis. The result has shown that the industry efficiency level is at modest level but the technical and scale efficiency of Banks is characterized by both inter and intra group variations across different ownership and size. The efficiency of the government banks is the highest and specifically the CBE’s efficiency score persistently is at the frontier. In aggregate basis, banks that were recently emerged in the industry were less efficient than the other groupings, nevertheless, there appear some banks from this group whose efficiency score is as equivalent as the most efficient bank in the industry. The variation among the private banks specifically of the small banks supports the government stance towards following the infant industry protection scheme. The study analyzed the causes of the efficiency variances across various groups and has found out that the variations in efficiency among public and private banks can be explained by public banks favorable support from the government in creating easy market for deposit, loans and forex which has contributed a lot in reducing the cost of fund and boosting both interest and non-interest income. Based on the findings, the study recommends that banks need to work more towards improving their efficiency level so as to ensure equalization of banks towards technical efficiency and increase their competitiveness at international level. This will help in case the government allows foreign banks to operate in the country. In addition, the government should not only protect private banks from external competition but also should support them to enhance their capacity to compete internally by creating a level playing field and enhancing the supervisory capacity in a way to support the technical efficiency of the management.
Keywords: Efficiency Bank Ethiopia Introduction
Since 1991 Ethiopia has been taking various liberalization measures which are intended to enhance the performance of banks in the industry. Some of the measures include lifting of the lending rate cap, allowing private owners to invest in banks, introducing new financial instruments like introducing treasury bills, inter-bank foreign exchange market and others.
However, despite the reforms introduced in the sector, the financial sector still remains to be undiversified in types of ownership, market share and financial instruments. With regard to market share, the Commercial Bank of Ethiopia (CBE) has been the dominant bank in both deposit and loan market taking more than half of the industry share(Tesfaye 2007). Hence, such oligopolistic kind of structure coupled with the restrictions on foreign banks not to operate in the country has been criticized by the IMF and World Bank in various times. This is mainly for the reason that such type of structure hampers the performance of the industry and enables inefficiency to reign in the sector among others. However, studies that focused on assessing the efficiency level of the Ethiopian banking system are scanty. Hence, this study tries to fill such gap with basic intention to identify the efficiency level of Ethiopian banks, the variation level among identified groups and provide justifications for the variations in efficiency among the various groups in the banking sector. In addition, the study assesses the allegedly understanding that public banks, which are prone to agency problem, operate at less efficiency level than private banks. However the impact of such efficiency variation on the performance of banks is one of the areas that need to instigate further research works.
Literature Review Concepts
The measurement of relative efficiency where there are multiple possibly incommensurate inputs and outputs was addressed by Farrell (1957) . He laid the foundation to measure efficiency and productivity studies at the micro level.
Farell proposed efficiency consists of two components: technical efficiency and allocative efficiency. The former reflects the ability of a Decision Making Unit (DMU) to minimize input use as to produce a given amount of output. The latter reflects the ability of a DMU to use inputs in optimal proportions, given their respective prices and the production technology Together, these two measures represent a total efficiency
The other efficiency type having similar context with the concept of Farell is X-efficiency. It is an intra-firm inefficiency or the deviation from the production efficient frontier, which depicts the maximum attainable output for a given level of input. This inefficiency can arise from the differences in managerial ability to control cost and/or maximize profits Harvey Leibenstin (1966). Berger et al (1993) describe X-inefficiency, as a variance from the efficient frontiers set by the best practice or benchmark firm. It incorporates two components, those technical and allocative inefficiencies. According to Farrell (1957) technical inefficiency occurs due to sub optimal usage of input leading to waste, while allocative inefficiencies arise from inappropriate mix or composition of inputs using inefficient business process. Both inefficiencies are attributed to employee, management or environment factors.
Scale Efficiency often arises from the ability of large firms to allocate fixed costs such as advertising expenses or cost of technology across a greater volume of output. It also shows whether the decision-making units (e.g. banks) operate at the minimum of their long run average cost curve. It focuses on technical efficiency, which is the ability of a bank to produce maximal output from a given set of inputs over a certain time period (Adongo et al, 2005).
Empirical
There appear numerous studies which aim to analyze the efficiency of Banks. Despite the variation in modalities, the Data Envelopment Analysis is the most popular in literature. For instance, Barr et al. (2002) evaluated the productive efficiency of U.S. commercial banks. Study results revealed a close interdependence between efficiency and independent measures of performance. Casu and Molyneux (2000) employed the DEA approach to investigate the efficiency in European banking systems. They attempted to examine whether the productive efficiency of European banking systems has improved and converged towards a common European frontier. Jemric (2002) investigated the efficiency of banks in Croatia. The main results showed that foreign banks are, on average, the most efficient; also banks that recently entered the market are more efficient than those operating for a long time. Also, small banks are more efficient than large ones.
Wu (2005) examined productivity and efficiency of banks in China during 1983-2001. The main results reported that efficiency increased in times of deregulation. Loukoianova (2008) made a comparison of the banking sectors in Western Europe, the U.S. and Japan depending on the specialization of banks.
In Africa as well there is an attempt to measure efficiency and its impact on performance. Figueira, Nellis and Parker 2006 investigated to what extent the ownership structure of banks affects their performance which is based on a range of performance ratios as well as parametric and non-parametric estimations. The results show that in Africa, on average, privately-owned banks do not appear to outperform state-owned banks. However, where private ownership involves foreign ownership then this does seem to have a positive effect on bank performance.
Agu 2004 examined the efficiency of the Gambia's financial sector and found out that Gambia's banking system has not performed the functions as efficiently as it ought to. The causes of inefficiencies in the performance of the various functions include the heavy regulatory framework, the oligopolistic market structure and the small banking market.
So far, as far as my knowledge is concerned, no research has been conducted assessing the efficiency of Ethiopian banks using Data Envelopment Analysis or any other frontier approaches.
3. Methodology
The study applies Data Envelopment Analysis (DEA) which traces its origin to Chames, Cooper, and Rhodes (978). The DEA model is a specific methodology for analysis of the relative efficiency for multiple inputs and outputs by evaluation of all decision-making units (DMUs). The DEA measures efficiency performance in respect to the best practice banks, which is called efficient frontier. The DEA does not require in advance assumptions about the production function’s analytical form and is not affected by the unit of measure. However, it is sensitive to extreme observations and choice of variables as inputs and outputs.
The study uses the CCR and VCR models and their divisional output to compute for the scale effect or scale efficiency. CCR-model was developed by Charnes, Cooper and Rhodes (Charnes et al. (1978)). Its specific assumption is that the DMU operates under constant returns to scale (CRS). BCC-model was defined by Banker, Charnes and Cooper (Banker et al. (1984)). It estimates the efficiency under the assumption of variable returns to scale (VRS).
The basic DEA problem to estimate the relative efficiency of each bank is given by: θ *= Min θ subject to
∑ λj xij ≤ θxio i= 1,2,….m
∑ λj yrj ≥ yro r= 1,2,….s
∑ λj=1
Where xio and yro are the i-th input and r-th output of the Bank under evaluation, respectively and θ is a bank-specific scalar that varies between zero and one and conveys the efficiency score of the bank-specific bank. Banks with θi = 1 their input-output mix lies on the efficient frontier. The λ j is an Nx1 vector of bank-specific weights that conveys information on the benchmark comparators for bank i. A modification of the model with addition of the convexity constraint, ∑ λj=1 allows to compute efficiency under variable returns to scale (VRS) and disentangle technical efficiency from scale efficiency. The VRS model thus envelops the data more tightly and provides efficiency scores that are equal or greater than those of the CRS model (Banker et al., 1984).
Data Source and Variable settings
The literature has followed various approaches to specify the input-output variables. The most commonly used approach are the intermediation and production approaches. In addition, there are others including the value-added approach, user cost approach and asset approach (Jemric and Vujcic (2002), Pawlowska (2005), Grigorian and Manole (2002)).
Since there is no consensus about which of the available approaches to DEA should be used for efficiency scores estimation, the choice of inputs and outputs in our model followed the intermediation approach. The intermediation approach considers the banks core function of intermediating funds between depositors and borrowers at lowest possible costs. In the Ethiopian context this approach is relevant considering banks highly engagement in the traditional intermediation activities. Hence, the framework assumes that banks use three inputs to produce three outputs.
The inputs consist of deposits, branch network and fixed assets (including investment in ITs) with their respective prices of interest expense, salary expense (brunch running cost) and other expenses mainly including amortization and depreciation of fixed assets. Hence, unit input prices are estimated by dividing interest expenses by the amount of total deposits, total salary expenses by the number of branches and other general expenses by the fixed asset. The outputs consist of loans, bills and securities (exposure to investments on government securities) and other earning assets mainly of the foreign deposit.
The variable which is different from the literature reviewed is the branch running cost which is the result of salary expense per number of branches. The study preferred this measure over the usual salary expense per number of employees because of the high correlation of number of branch with size of staff. In addition, it provides flexibility to consider both the number of staff working in a branch and the salary paid for each staff. The other output variable bills and securities is considered in the study for the fact that it has been attached with the intermediation activities following the regulator’s requirement for banks (excluding the Commercial Bank of Ethiopia) to purchase government bills equivalent of 27% of new loan disbursements. The bills are purchased at a very lower rate 3% and even below the minimum interest rate to be paid on saving and fixed time deposit (5%). The other earning asset component which is mainly dominated by the foreign reserve of banks is the major (next to loan) source of income of banks and it utilizes the local deposit of banks as inputs.
In addition to the output measures, the related output prices were computed. The addition or removal of output prices has not effect on the result of the efficiency score. However, the study used it to explain the causes of variation in the efficiency among Ethiopian banks.
The data used for the model are obtained from the publicly available financial accounts of each banks with coverage from 2008-12. All banks except two banks that operated for less than a year during 2012 are considered for the study.
Results
The CCR-Model (Constant Return to Scale)
During the time period 2008-12, only four banks out of the average 14 banks were efficient. However, the industry average technical efficiency is at modest level, 0.867 but appear less than the findings in some of developed countries. For instance, Berger and Humphrey, 1997 found industry average of 0.95 for France which instigates the need for Ethiopian Banks further improve efficiency. The industry average depicts that a bank on average used 13.3% of inputs to produce the same outputs as the efficient bank. In other words a bank could have produced 13.3% more outputs using the same amount of inputs if it was operating in the efficiency level of the efficient bank.
In terms of number of Bank’s as well despite the entry of six new private banks in the industry between the periods, the number of efficient banks has grown by one only. In addition, even if a modest increase in the efficiency level is observed during the recent periods, the trend was not stable to move on the increasing front. This is well reflected in a mean value very closer to the mean value of the initial period. The variation in efficiency on average was closer to 10% which is an indicator that a considerable variation among banks operating in the Ethiopian Banking industry.
Table 1: The CCR-Model (Constant Return to Scale)
2012 2011 2010 2009 2008 average
Number of DMUs 16 15 14 12 10 13.4
Efficient DMUs in number 4 4 4 3 3 3.6
Efficient DMUs in % 0.250 0.267 0.286 0.250 0.300 0.270 Industry average efficiency (E) 0.881 0.893 0.846 0.821 0.864 0.867 Average inefficiency (1-E) 0.119 0.107 0.154 0.179 0.136 0.133 Inefficiency/efficiency (1-E)/E 0.136 0.120 0.182 0.218 0.157 0.153
Maximum 1.000 1.000 1.000 1.000 1.000 1.000
Minimum 0.709 0.688 0.623 0.423 0.537 0.725
Range 0.291 0.312 0.377 0.577 0.463 0.275
Standard Deviation 0.105 0.100 0.137 0.161 0.150 0.084 Source: Author Computation using MAX DEA Pro 6 Software
The minimum efficiency level also shows at times there were banks operating halfway below the level of the efficient Bank. In fact this to certain extent can be associated with the entry of new banks in the industry which incur high establishment and organization costs during the entry period as well as the reasonable time required to fully engage in intermediation activities.
The BCC-Model (Variable Return to Scale)
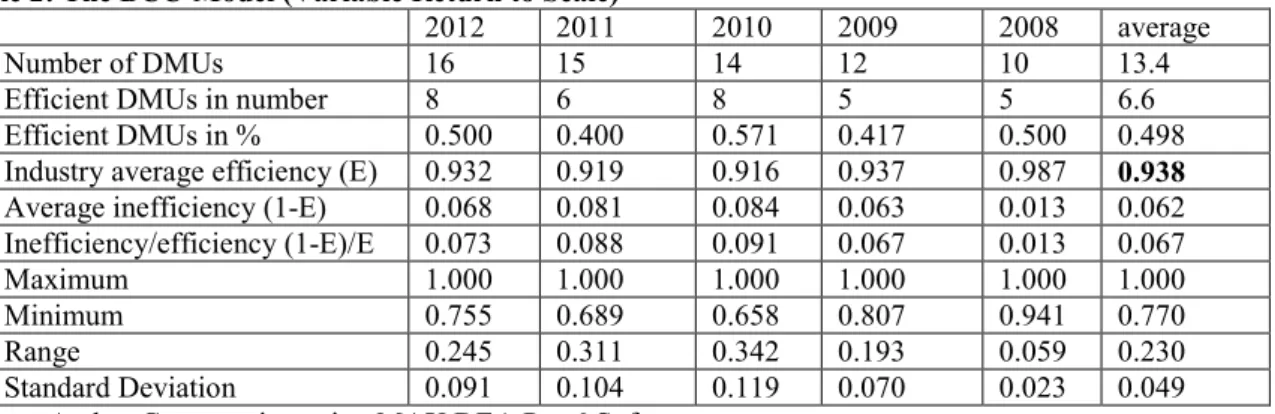
Under the variable returns scale which always tolerates higher efficiency score because of its considerations for banks operating under both the increasing and decreasing returns to scale, the industry average has increased substantially, 0.938. The variable return scale appears to be realistic approximations of the efficiency score of banks because the CRS assumes that all banks are operating at an optimal scale. However, various factors like imperfect competition and internal factors may constrain a bank not to be operating at optimal scale.
Table 2: The BCC-Model (Variable Return to Scale)
2012 2011 2010 2009 2008 average
Number of DMUs 16 15 14 12 10 13.4
Efficient DMUs in number 8 6 8 5 5 6.6
Efficient DMUs in % 0.500 0.400 0.571 0.417 0.500 0.498 Industry average efficiency (E) 0.932 0.919 0.916 0.937 0.987 0.938 Average inefficiency (1-E) 0.068 0.081 0.084 0.063 0.013 0.062 Inefficiency/efficiency (1-E)/E 0.073 0.088 0.091 0.067 0.013 0.067
Maximum 1.000 1.000 1.000 1.000 1.000 1.000
Minimum 0.755 0.689 0.658 0.807 0.941 0.770
Range 0.245 0.311 0.342 0.193 0.059 0.230
Standard Deviation 0.091 0.104 0.119 0.070 0.023 0.049 Source: Author Computation using MAX DEA Pro 6 Software
The change appears not only on the efficiency score but obviously also on the number of Banks operating at the efficient level. The VRS almost doubled the efficient number of Banks with a growing but fluctuating trend. However, the result in both approaches is far a way to conclude that all players in the industry are operating at the optimal level. Still under the VRS approach the high efficient banks share stood 50% of the number of banks in the industry with 50% inefficient banks operating the industry. In addition, despite the reduced variation in efficiency level, 5%, and increase in the minimum efficiency level 0.658, it can be inferred that there exists a considerable variation in the efficiency level of banks.
Hence, under the CRS and VRS assumptions the technical efficiency of Banks is with variations and signaled the need to work more towards improving the efficiency level of some of the banks in the industry. This will ensure the move towards equalization of banks towards their technical efficiency and hence could increase their competitiveness both at internal and international level if the country relaxes its policy of allowing foreign banks to operate in the country. The current efficiency scores by large supports the government stance of following the protection of the infant industry approach. Especially the existence of banks that were operating halfway below the local efficient bank can still questions the capacity of local banks to compete with their international counterparts.
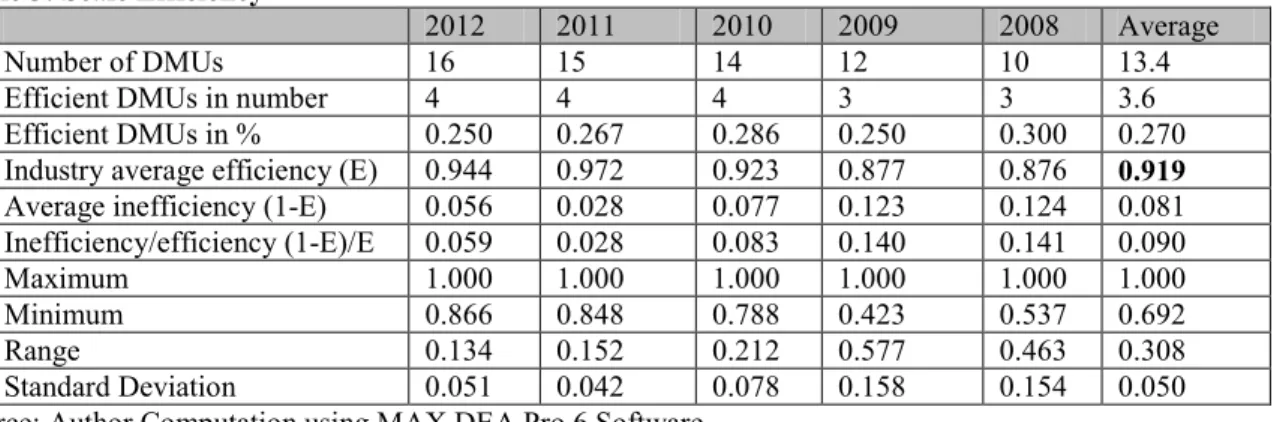
Scale Efficiency
scale efficiency. As stated above since the number of banks operating at efficiency level increased to 50% from 27% under the constant return scale, the high value of the scale efficiency score will not be a surprise. However, the variation 5% and the minimum value 0.423 of the scale efficiency shows there appear a need to further enhance the efficiency level of some banks operating in the industry.
Table 3: Scale Efficiency
2012 2011 2010 2009 2008 Average
Number of DMUs 16 15 14 12 10 13.4
Efficient DMUs in number 4 4 4 3 3 3.6
Efficient DMUs in % 0.250 0.267 0.286 0.250 0.300 0.270 Industry average efficiency (E) 0.944 0.972 0.923 0.877 0.876 0.919 Average inefficiency (1-E) 0.056 0.028 0.077 0.123 0.124 0.081 Inefficiency/efficiency (1-E)/E 0.059 0.028 0.083 0.140 0.141 0.090
Maximum 1.000 1.000 1.000 1.000 1.000 1.000
Minimum 0.866 0.848 0.788 0.423 0.537 0.692
Range 0.134 0.152 0.212 0.577 0.463 0.308
Standard Deviation 0.051 0.042 0.078 0.158 0.154 0.050 Source: Author Computation using MAX DEA Pro 6 Software
Intermediation Efficiency by Bank Types and ownership
This section presents the efficiency score of bank via classifying commercial banks based on a mix of variables: size, ownership and length of stay in the industry. The result shows that long stayed government banks have the highest score of both technical and scale efficiencies. This is a surprising result and deviates from a common understanding that private banks operate in better efficiency level than government Banks. This assumption is derived from the flexibility of private banks to undertake the intermediation activities in the sector of their choice unlike government banks which are expected to serve the priority sectors set by the government and to some extent are required to play societal role besides maximizing profitability. Separate evaluation of banks also revealed that the Commercial Bank of Ethiopia has been operating with the highest efficiency score. The efficiency level was not only on the frontier level but is also persistently on the efficient zone in all the periods considered.
Table 4: Efficiency by Bank Group
Number Average Efficiency ST. Deviation CRS VRS Scale
(CRS/VRS)
CRS/ VRS CRS/VRS
Government Banks: 2 0.964 0.982 0.981 0.051 0.026 0.027
Middle sized Private Banks: 6 0.883 0.955 0.924 0.044 0.029 0.037 Small Sized Private Banks: 8 0.832 0.910 0.912 0.095 0.053 0.064
All private Banks 14 0.846 0.920 0.918 0.079 0.049 0.053
Source: Author Computation using MAX DEA Pro 6 Software
The other result is that banks that were recently emerged in the industry were less efficient than the other groupings. Out of the 16 banks, six of them have commenced operation after year 2008. The reduced efficiency score of such banks is even lower from banks of similar ownership structure but is not significantly pronounced. In fact, part of such variation for the new banks can be explained by the high entry cost requirement for branch opening, acquiring of fixed assets and reasonable time required to engage in full and efficient intermediation activities. The coefficient of variation among the small sized banks, nevertheless, signaled high variation among new banks. The middle sized private banks are in the middle of the efficiency scores among the groups having a lower score from the government banks. On, individual bank basis the persistency (for the five years) of high efficiency registered by the CBE was not observed in any of other banks.
Bank Size and Efficiency Score- spearman’s correlation
So as to check the relation of bank size with the efficiency levels, a correlation coefficient was calculated. The coefficient ranges between 0.377 under scale efficiency and 0.459 for constant return to scale. Hence, the bank size which enables to earn the benefits of economies of scale associated with size explains around 40% of the efficiency level.
Table 5: Bank Size and Efficiency Correlation VRS CRS/VRS CRS Average Asset VRS 1.0000 CRS/VRS 0.5346 1.0000 CRS 0.8620 0.8885 1.0000 Average Asset 0.4086 0.3770 0.4590 1.0000
Source: Author Computation using STATA 10 Software
However, the significant level of efficiency is explained by variables other than bank size. Therefore, the relevant question will be if it is not size, what factor/s explain the variation in efficiency level among the Ethiopian Banks? This will be addressed in the next section.
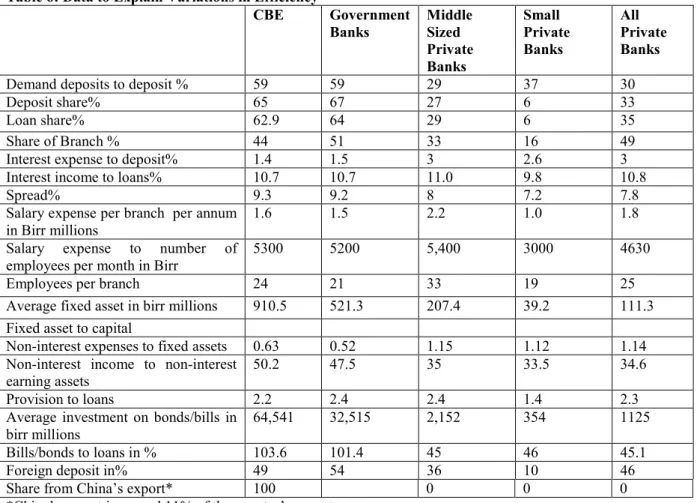
What caused the variation and for the persistence efficient score of the CBE? Input Side Explanation
Deposit- One of the areas in which large concentration has been noted is the deposit market. The share of government banks from the total deposit market is on the high side (67%). Of which the CBE has enjoyed a market share of 65% from the industry. Besides the long time stay in the industry, the advantages related to holding the public enterprise market and the implicit guarantee of the depositors for CBE being a government owned bank has contributed to boost its dominance in the deposit market. This will not be a surprise as CBE is chosen by the government to spearhead the national saving augmenting plan as well as depositors’ trust for public banks will not be blamed in a country where there is no deposit insurance scheme. In addition, CBE appear to be the key and sole player in some of the national projects that support the urban poor like the housing/condominium projects which are designed loans on saving basis and account opening at the CBE appear to be one of the requirements.
From the efficiency side, the advantage of the CBE is not only arose from the suitable deposit market situations, but its ability to raise very low or closer to nil deposit types (demand deposit) in significant amount. The share of demand deposit is 59% of the total deposit which means public banks mainly of the CBE were operating with deposits types having almost a nil cost of fund.
Branch/staff size- in terms of branch network, more than half of the branch network is under the domain of the two public banks with CBE’s share in the market being the highest, 44%. The middle sized banks together hold of 33% of the branch network with an average branch share of 5%. This is obviously far away from the 44% share owned by the single bank. In recent period as well the percentage share will favor the CBE as it’s aggressively engaging in branch expansion which was considered instrumental by the Bank to meet the national saving augmentation plan. CBE has opened 148 branches within a year from June 30,2012. In terms of staff size which is highly correlated (0.99) with the number of branch networks, CBE is obviously the leading employer of the industry. However, the question here is that is does such aggressive expansion in branch and hence in number of employees could potentially affect its efficiency? This could be further reviewed in the input price part.
Fixed Assets (including investment in Information Technology) - the average size of fixed asset is about 3-4 times of the average of the middle sized banks. In addition, the capital to fixed asset ratio also shows that CBE has strong room to easily expand its product horizon in those efficiency enhancing technology products. The Bank appeared to be the leading bank in introducing some of e-banking products like forex ATMs, mobile-banking services etc. As expected, small banks do not invested more on fixed assets due to their limited capital position.
Table 6: Data to Explain Variations in Efficiency CBE Government Banks Middle Sized Private Banks Small Private Banks All Private Banks
Demand deposits to deposit % 59 59 29 37 30
Deposit share% 65 67 27 6 33
Loan share% 62.9 64 29 6 35
Share of Branch % 44 51 33 16 49
Interest expense to deposit% 1.4 1.5 3 2.6 3
Interest income to loans% 10.7 10.7 11.0 9.8 10.8
Spread% 9.3 9.2 8 7.2 7.8
Salary expense per branch per annum in Birr millions
1.6 1.5 2.2 1.0 1.8
Salary expense to number of employees per month in Birr
5300 5200 5,400 3000 4630
Employees per branch 24 21 33 19 25
Average fixed asset in birr millions 910.5 521.3 207.4 39.2 111.3 Fixed asset to capital
Non-interest expenses to fixed assets 0.63 0.52 1.15 1.12 1.14 Non-interest income to non-interest
earning assets
50.2 47.5 35 33.5 34.6
Provision to loans 2.2 2.4 2.4 1.4 2.3
Average investment on bonds/bills in birr millions
64,541 32,515 2,152 354 1125
Bills/bonds to loans in % 103.6 101.4 45 46 45.1
Foreign deposit in% 49 54 36 10 46
Share from China’s export* 100 0 0 0
*China’s export is around 11% of the country’s export.
Source: Author Computation form Bank’s financial statements and NBE annual Report Input price
Interest expense-As discussed above, besides the dependable deposit market originated from the public enterprises, depositors with high trust and supporting national plans that encourage saving, the CBE unlike other banks is enjoying with higher share of the low cost types of deposits (demand deposit). The effect of the large share of the demand deposit can be revealed with a cost of fund (1.4%) equivalent to half of the cost of fund of the private banks (3%). In other words, the high share of demand deposits enabled the CBE to reduce its cost of fund by large percentage points than the private banks from the minimum legal requirement of interest rate to be paid on saving and fixed time deposit (5%). The high share of current accounts is also neutralizes the effect of a policy change in the floor price of time and saving deposits by the regulatory organ. Therefore, besides ensuring the intermediation efficiency via reducing its cost of fund, the high share of current accounts is providing multi-dimensional advantages like risk mitigation for changes in prices, dependable source of liquidity etc to the CBE. The reduced cost advantage can be more explained by the ease to get more market share in the loan market as well via charging borrowers a lower interest rate from the market and keeping the spread at a comparable or even at higher level than the industry norm (see next section).
Branch Running Costs or Staff Expenses- The small sized banks were the least employer per branch followed by the CBE. The middle sized banks staff size per branch is by far large as compared to the small and government banks. This is in association with pursuing limited branch concept by small banks, practice of substituting or complementing branches with technology products like ATMs, opening more branches outside the capital where the need to employee more staff is reduced. Interestingly, similar variation in the amount of salary paid per employee is prevalent among the three groups. Hence, this has reduced the annual branch running costs for small private and public banks.
Non-interest Expenses (including depreciation, amortization, promotion and others) - this is a residual expense after netting of staff and provision expenses. The public banks are also beneficiary from reduced interest expense which is by far lower than their fixed asset balance. This is unlike the private banks whose
non-interest expense obviously gone above their fixed assets or the cumulative amount of amortization and depreciation expenses. This provides indication that private banks invest more on promoting themselves to build trust in the banking market, which the public banks have already acquired it implicitly being owned by the government.
Output Side
Loans,spread, asset quality - a structure very closer to the deposit market is exhibited for the credit market, where the dominant bank, CBE controls above 62% of the loan market. Private Banks share remained 35%. As the deposit market the CBE has large spectrum of borrowers from the public enterprises specifically of any credit demand by the parastatals is totally fulfilled by the CBE. Its relatively large capital enabled the Bank to lend up to Birr 1 billion for a single borrower unlike other private banks whose maximum capacity is Birr…million. The restriction of the single borrower limit, which is 25%, of capital remains a disadvantage to small banks as they are not able to attract large borrowers due to their limited capital position.
The most important issues with regard to the intermediation is the pricing setting mechanism followed by the dominant bank. With its lower cost of fund the CBE has two options: charge the same price as the market and earn high spread or set a price lower than (by cost of fund saved) the market rate and earn a spread equivalent to the market. The fact however shows that CBE charges almost equivalent (a bit lower) interest rate enjoying a spread above the market. This is one of the characters of monopoly or powerful oligopolies which can play on the price in a way to maximize their earnings.
The other appreciable scenario in both government and private banks is the asset quality parameter which has been a worrying issue especially for public banks, is now coming on the favorable front. The proxy measure for asset quality, the provision to loan ratio is less than 3% which shows banks in general hold quality asset which costs them not more than the general provision required for loans under special mention status. Hence, asset quality issue cannot be mentioned as a reason for the efficiency variation among public vs private groups. However, this can be considered as a reason to explain variations among the private banks themselves.
Bills and Securities- all banks except the CBE are required to purchase bills amounting 27% of new loan disbursements. This is basically with the intention to support the mega national development project, the renaissance dam. The main complains with regard to such requirement from banks is related to the lower yield (3%) from bills that doesn’t even cover the minimum cost of fund required to be paid for saving and time deposit (5%). In addition, there are some banks which consider the exemption of CBE as a double standard and indicator of lack of a level playing field in the industry. However, in terms of exposure to low yielding government securities, the CBE appear to be the biggest contributor to national development project.
The exposure to bonds and securities amounted Birr 64 billion which is even larger than the size of its loan portfolio. Other banks exposure on average is not higher than 3 billion and remained around 45% of their loan exposure. Hence, the government decision of exempting the CBE from the requirement to purchase bills appear reasonable considering its very high exposure to other forms of low yielding government securities. In addition, in terms of yield on bill purchase, the government seems set the price of bills considering the aggregate cost of fund of the private banks which is exactly equivalent to the yield on the bills. This is obviously a lower rate as compared to the 7-8% spread on the commercial lending but it largely affects the CBE than other private banks following its large exposures. Hence, the effect of the bill purchase requirement even if it can reign inefficiency in the entire industry via negatively affecting the activities and the yield from intermediation by diverting a large sum of money in low yielding investments, its effect appear more negative to the performance of the CBE. However, the justifications towards compelling banks to channel part of their funds to support national projects remain an arguable issue. In addition, the effect of bill purchase on performance and liquidity position of banks requires further research work.
Other Earning assets (mainly of the foreign deposit)- in terms of foreign deposit which is a proxy indicator of the level of foreign currency flow and the level of foreign reserve of banks, the dominance of the CBE in the loan and deposit market is still observed in the forex market. The share (almost half) of CBE appears at the top of the industry. A convenient policy framework for CBE in such regard is the requirement for every export and import transactions with China to be channeled through the CBE. The recent statistics shows that the trade direction of the country is shifting towards the South East Asian countries especially of China , which by large will be providing additional benefit to the CBE and raising concern on the fairness of the policy .
Result with the exclusion of Public Banks
The aforesaid analysis has pointed that various implicit and explicit policy frameworks in deposit, loans and forex market are supporting the CBE to enhance its efficiency. Hence, it appears reasonable to separately consider the efficiency variation among the relatively old and newly emerging private banks. With the exclusion
of public banks from the analysis, the middle sized banks appear to have a better efficiency score. This is congruent with the previous result, however, surprisingly no middle sized bank was on the frontier under the constant return scale still witnessing that small sized banks are becoming the benchmark of efficiency. The efficiency of the middle sized banks is also with little variation unlike the small private banks which witnessed less variation among themselves with regard to efficiency. Hence, the result with separate evaluation has not changed the initial finding of the study with regard to efficiency inequality, the need to improve the efficiency level of some of the banks and increase their competitiveness both at internal and international level.
Table 7: Efficiency Score of Private Banks
CSR VSR CSR/VSR
Number of DMU 14 14 14
Efficient DMUs in middle sized banks 0 4 0 Efficient DMUs in small banks 3 4 3 Middle sized banks average efficiency 0.905 0.979 0.927 Small sized banks average efficiency 0.868 0.909 0.955 Middle sized banks st. deviation 0.069 0.037 0.047 Small sized banks st. deviation 0.115 0.105 0.057 Source: Author Computation using MAX DEA Pro 6 Software
Conclusions and Recommendations
The study is basically intended to conduct assessment on the efficiency level of Ethiopian Banks for the period 2008-2012 using the Data Envelopment Analysis. The result has shown that the industry efficiency level is at modest level but requires to be improved towards the level of international banks. Under both methods of the DEA, the CRS and VRS, the technical efficiency of Banks is characterized by both inter and intra group variations across different ownership and size. The efficiency of the government banks is the highest and specifically the CBE’s efficiency score persistently is at the frontier. The middle sized private banks are in the middle of the efficiency scores and with little variation in the group. In aggregate basis, banks that were recently emerged in the industry were less efficient than the other groupings, nevertheless, there appear some banks from this group whose efficiency score is as equivalent as the most efficient bank in the industry. This has witnessed the high variation in efficiency score among the small sized banks. The study analyzed the causes of the efficiency variances across various groups and has found out that the variations in efficiency among public and private banks can be explained by public banks favorable support from the government in creating easy market for deposit, loans and forex. Even in some cases totally dedicated market for public banks has contributed a lot in reducing the cost of fund and boosting both interest and non-interest income. However, internal driven efficiency issues related to high fixed asset for IT investment and well managed asset quality also contributed positively for high efficiency score of public banks. The variations among private banks are purely related to variations in management’s capacity to efficiently handle the intermediation activities. Despite the variations in policy framework for public and private banks, the existence of banks from the smaller groups that managed to perform at the efficiency frontier can witness the possibility of maximizing the efficiency score of Ethiopian banks. Hence, banks need to work more towards improving their efficiency level so as to ensure equalization of banks towards technical efficiency and increase their competitiveness at international level which will be helpful in times when foreign banks are allowed to operate in the country. The current efficiency scores by large supports the government stance of following the protection of the infant industry approach. Especially the existence of banks that were operating halfway below the local efficient bank can still questions the capacity of local banks to compete with their international counterparts. However, the government should not only protect private banks from external competition but also should support them to enhance their capacity to compete internally by creating a level playing field and enhancing the supervisory capacity in a way to support the technical efficiency of the management. The study identified future research attempts with regard to the effect of bill purchase on performance of banks as well as the impact of the variation in the efficiency scores on the performance of banks as areas that need instigate further research works.
References
Adongo, J., Christoph Stork, and Elisa Hasheela (2005) Measuring the Alternative Profit X-efficiency of Namibia’s Banking Sector. The Namibian Economic Policy Research Unit. (Research Report No. 36.).
Agu c.c 2004, Efficiency of Commercial Banking in the Gambia, African Review of Money Finance and Banking pp31-50.
Barr, R.S. et al. 2002. Evaluating the productive efficiency and performance of U.S. commercial banks. Managerial Finance, 28-8, pp.3-25.
Standard Distributional Assumptions. Journal of Productivity Analysis 4, 261–292.
Casu B. and Molyneux P. (2000), A comparative study of efficiency in European Banking, WP Financial Institutions Center, nr. 17, Wharton School, University of Pennsylvania.
Coelli, T., Rao, D.S P., O’Donell, C.J. and Battese, G.E. (2005). An introduction to Efficiency and Productivity Analysis, New York: Springer.
Figueira C, Nellis J, Parker D (2006) Does ownership affect efficiency of African banks? Journal of Developing Areas, 40 (1) 37-62.
Farrell, M. J.,1957. The Measurement of Productive Efficiency. Journal of the Royal Statistical Society, Series A, 120, 253-290.
Jemric and B. Vujcic (2002), “Efficiency of banks in Croatia, A DEA approach,” Comparative Economic Studies 44, pp. 169-193.
Leibenstein, Harvey, 1966, “Allocative Efficiency Vs. X-Efficiency,” American Economic Review, Vol. 56, June, pp.392-415
Tesfaye Boru 2007, Impact of Financial Liberalization on the Ownership Market Structure and Performance of the Ethiopian Banking Industry, Master Thesis submitted to AAU, unpublished.
Wu, Yanrui, 2005, “Productive efficiency in Chinese industry: a review”, Asia-Pacific Economic Literature 7(2), 58-66.