Revista ELectrónica de Investigación y EValuación Educativa
ISSN: 1134-4032
e-Journal of Educational Research,
Assessment and Evaluation
Background questionnaires of PISA: a study of the
assessment indicators
Cuestionarios de contexto PISA: un estudio sobre los indicadores de evaluación González-Such, José; Sancho-Álvarez, Carlos & Sánchez-Delgado, Purificación
Universidad de Valencia (Spain)
Abstract
The PISA assessment system has generated and continues to generate intense debate about its structure and usefulness. This article focuses on the context questionnaires as a way to analyze and understand the results properly. The objectives are to analyze the background indicators used in the different editions of the PISA tests, used in different studies and the results of these studies. An overview of the model used is provided to ensure that these indicators are no longer something that accompanies the performance test to reach their true meaning: jointly analyze the performance along with the variables that may be influencing the results. As methodology is used document analysis of publications related to PISA and results, as well as a semantic analysis of scientific work that has generated PISA. The results show that some indicators have remained throughout the various editions of PISA, while others have changed. The translation of a stable model in editions from PISA 2015 in which the most relevant items are included will undoubtedly facilitate the study of results at vertical and horizontal level. Thus, the importance of PISA context questionnaires established to properly understand their results and the need for more complex studies of multilevel or nested that normally used, generally based on descriptive statistics and / or percentages.
Keywords:
PISA, background questionnaires, evaluation indicators, evaluation of educational systems, education, measurement
Reception Date 2016 April 12 Approval Date 2016 June 16 Publication Date: 2016 June 16 Resumen
El sistema de evaluación de PISA ha generado y continúa generando intensos debates sobre su estructura y utilidad. Este artículo se centra en los cuestionarios de contexto, como forma de analizar y entender de manera adecuada los resultados. Los objetivos son analizar los indicadores de contexto que se utilizan en las distintas ediciones de las pruebas PISA, su utilización en distintos estudios y en los resultados de estos estudios. Se proporciona una visión general del modelo utilizado para conseguir que estos indicadores dejen de ser algo que acompaña a las prueba de rendimiento para que alcancen su verdadero sentido: analizar conjuntamente el rendimiento junto con las variables que pueden estar influyendo en los resultados. Como metodología se utiliza el análisis documental de publicaciones relacionadas con PISA y sus resultados, así como un análisis semántico sobre trabajos científicos que ha generado PISA. Los resultados muestran que algunos indicadores se han mantenido a lo largo de las distintas ediciones de PISA, mientras que otros han ido variando. La plasmación de un modelo estable en las ediciones a partir de PISA 2015 en el que se especifican los
Fecha de recepción 12 Abril 2016 Fecha de aprobación 16 Junio 2016 Fecha de publicación 16 Junio 2016
ítems más relevantes facilitará sin duda el estudio de los resultados a nivel vertical y horizontal. Así, se establece la importancia de los cuestionarios de contexto de PISA para poder entender de manera adecuada sus resultados y la necesidad de realizar estudios más complejos del tipo multinivel o anidados que los que normalmente se utilizan, en general basados en estadísticos descriptivos y/o porcentajes.
Palabras clave:
PISA, cuestionarios de contexto, indicadores de evaluación, evaluación de sistemas educativos, educación, medición.
The presence of PISA in our environment is indisputable. The opinions range from support for this system and criticism of the same (Popkewitz, 2013; Rindermann, 2007). PISA, born in the framework of the OECD as a way to analyze the differences between countries with common tests focused on measuring expectations regarding school performance and benchmarks (Duru-Bellat, 2013; Popkewitz, 2013), compares the reading, mathematical and scientific competence with tests away from curriculum in order to describe the situation of education in the countries and promote its improvement. The results of these evaluations should be used by countries to solve their problems in education and to improve their education systems, not to be compared with others in performance issues (Rendon & Navarro, 2007). In Spain the combination of factors has led to growing unrest about the education system (Marchesi, 2006).
Since the Coleman report (Coleman, et al., 1966) has been proving the relationship between the socio-cultural level and academic performance so it is essential to know the contextual conditions in which it occurs through context questionnaires (see Sancho Álvarez, Jornet, & González Such, 2016). The evaluation of educational systems has some weaknesses, including the limited statistical treatment of obtained information, which could be improved by explanatory analysis of the product from context, by means of simple and complex indicators represented by instruments derived from well-designed scales. Limited knowledge of some explanatory models are among the causes of this limited statistical treatment, which leads to analyze data descriptively, or fear to manipulate data,
based on which statistical analysis disrupts the initial configuration.
In our view, the greatest difficulties in an assessment reside in the definition of a theoretical model that supports the system and in addressing the indicators of input variables, context and product with quality instruments (López-González, González-Such, & Lizasoain, 2012, p. 128).
In general, it is considered that PISA tests are methodologically well built, although there are issues to be resolved, "such as lack of motivation of students in assessments without consequences, rigor in controlling the response rates and exclusions, fairness and neutrality in research and the use and impact of results” (Martínez Arias, 2006, p. 111).
A structure that delimits a body of issues that should facilitate the comparison between cycles for the monitoring of the educational systems was established in PISA 2012 (OECD, 2016). Taking into account the objectives of the evaluation of the context, the decisions of the Government team of PISA, the overall framework developed by PISA 2012 and recommendations of the research, PISA 2015 assumes that those responsible for the education system in participating countries need to be informed on four major areas: results, context of students, teaching and learning processes, and educational policies and Government (OECD, 2016).
In the design of PISA in general it holds change in the approach of context questionnaires in cognitive assessment: reading is the main reference domain in PISA 2000, 2009 and 2018; Mathematics in PISA
2003, 2012 and 2021 and sciences in PISA 2006, 2015 and 2024 (OECD, 2016).
In the majority of studies on educational evaluation is not respected the nested structure of the PISA data, i.e., students are in a school, within a district, in a city, region, etc.
However, many studies have shown how factors relating to school, classroom and teacher variables influence the educational achievement of students (Cervini, 2002, 2003b & 2004; Piñeros & Fernández & Blanco, 2004; Theule, 2006;) (Rendon & Navarro, 2007, p. 119).
A solution are multilevel studies (Gaviria & Castro, 2005). However, research on the PISA databases is relatively scarce in our country.
Objectives
This article aims to analyze the context indicators that have been used in the various editions of PISA. Documentary analysis based on the PISA-related publications and its results will be used as a methodology. In addition, presents a global model based on the items of context that is to be introduced in studies on PISA and analyzed what these items have been used in different studies.
Method
From a collection of official documents - technical reports and context questionnaires - there has been done a documentary analysis (Bisquerra, 2012) to help complement and contrast information across years.
Analyzed questionnaires have been shown below:
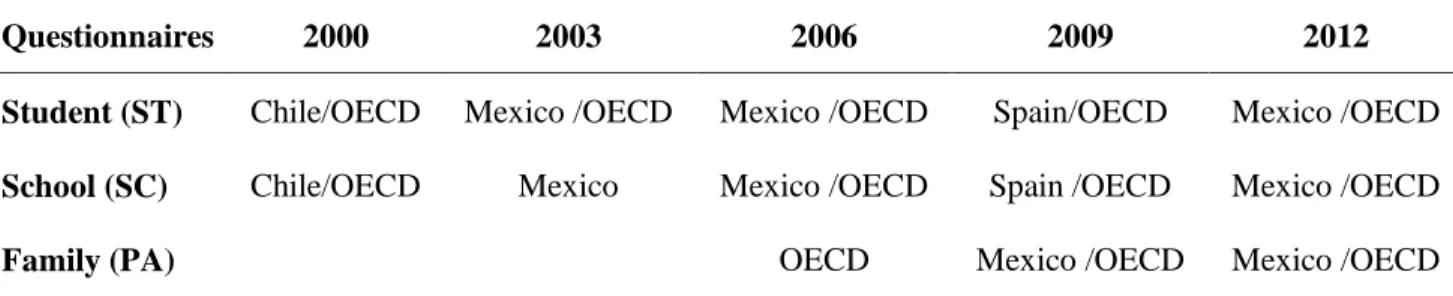
Table 1. Source of information across countries of questionnaires
Questionnaires 2000 2003 2006 2009 2012
Student (ST) Chile/OECD Mexico /OECD Mexico /OECD Spain/OECD Mexico /OECD
School (SC) Chile/OECD Mexico Mexico /OECD Spain /OECD Mexico /OECD
Family (PA) OECD Mexico /OECD Mexico /OECD
Note: 2015 is not yet available full information The phases developed, according to
Bisquerra (2012, pp. 351-352), were the following:
1. Tracking and inventory of existing and available documents.
2. Classification of documents identified.
3. Selection of documents more relevant for research purposes.
4. A close reading of the contents of the selected documents.
5. A cross and comparative reading of the documents in question.
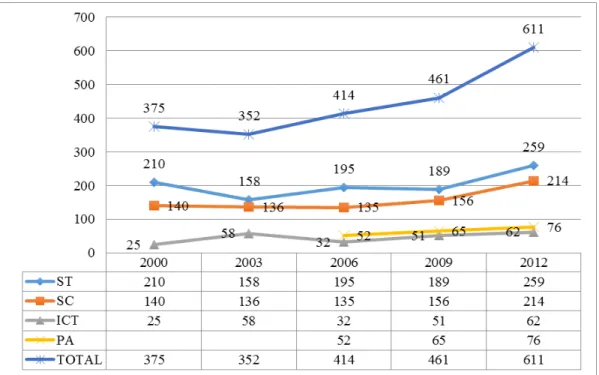
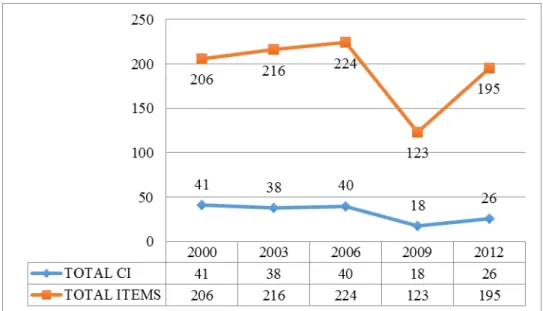
Figure 1. Totals of context questionnaires items across years We found a total of 1011 items
administered from 2000 to 2012 for students, 781 questionnaires center, ICT 228, 193 for families ; a total of 2213.
Through the analysis of 2213 items between 32 background questionnaires across the countries (Chile, Mexico and Spain) and the primary and official background questionnaires of the OECD, finally it has worked with structured 964 items between 101 and 100 simple indicators and complex indicators, according the currently existing technical reports (Adams & Wu, 2002; OECD, 2005, 2009, 2012, 2014) about the Programme for International Student Assessment, PISA 2000, 2003, 2006, 2009 and 2012.
Results
PISA work with two types of indicators (or indices):
• Simple indicators: base on direct recoding of responses to one or more variables.
• Complex indicators: constructed by
applying a methodology of scale, involving multiple questions and responses.
To confirm the theoretically expected behavior of the indicators and to validate their comparability across countries, was used the structural equation modelling. The analysis was done using Structural Equation Modelling (SEM) for a Confirmatory Factor Analysis (CFA) of questionnaire items. CFA was used to validate the indicators, and item response theory (IRT) techniques were used to produce scale scores. For the complex indicators was scaled using the Rasch item response model, and was estimate the maximum likelihood estimate, indicated the parameters estimates and delta for the any variable of the indicator and across countries (Adams & Wu, 2002).
Therefore, in this part the simple index variables (those based on direct recoding of responses to one or more variables) are described first, followed by complex indices (those that have been constructed by applying IRT scaling methodology), indicating for each indicator variables used by the OECD to provide parameters estimates for any item and for this reason finally this variables is finally analyzed in depth.
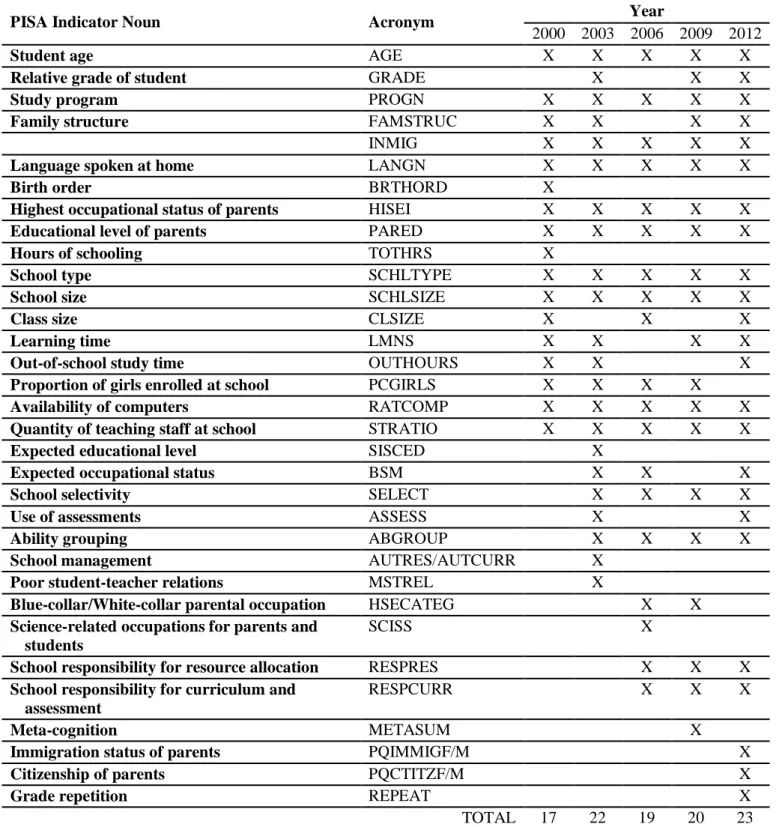
Table 2. Results of the Simple indicators
PISA Indicator Noun Acronym Year
2000 2003 2006 2009 2012
Student age AGE X X X X X
Relative grade of student GRADE X X X
Study program PROGN X X X X X
Family structure FAMSTRUC X X X X
INMIG X X X X X
Language spoken at home LANGN X X X X X
Birth order BRTHORD X
Highest occupational status of parents HISEI X X X X X
Educational level of parents PARED X X X X X
Hours of schooling TOTHRS X
School type SCHLTYPE X X X X X
School size SCHLSIZE X X X X X
Class size CLSIZE X X X
Learning time LMNS X X X X
Out-of-school study time OUTHOURS X X X
Proportion of girls enrolled at school PCGIRLS X X X X
Availability of computers RATCOMP X X X X X
Quantity of teaching staff at school STRATIO X X X X X
Expected educational level SISCED X
Expected occupational status BSM X X X
School selectivity SELECT X X X X
Use of assessments ASSESS X X
Ability grouping ABGROUP X X X X
School management AUTRES/AUTCURR X
Poor student-teacher relations MSTREL X
Blue-collar/White-collar parental occupation HSECATEG X X
Science-related occupations for parents and students
SCISS X
School responsibility for resource allocation RESPRES X X X
School responsibility for curriculum and assessment
RESPCURR X X X
Meta-cognition METASUM X
Immigration status of parents PQIMMIGF/M X
Citizenship of parents PQCTITZF/M X
Grade repetition REPEAT X
TOTAL 17 22 19 20 23
Complex indicators
As shown in table 2, there is diversity of simple indicators that vary according to each wave of application. Highlight School management and Poor student-teacher relations
indicators, which were used in the implementation of the 2000 and who have not
subsequently been used. Others have been parsed every year as they can be Study program, Immigration background, Highest occupational status of parents (HISEI), Educational level of parents (According to the ISCED through years of schooling PARED), School size and type, Availability of computers, Quantity of teaching staff at school
and Ability grouping. However, some have been incorporated in recent years to enrich the analysis of the context, such as those relating
to Blue-collar/White-collar parental
occupation, Science-related occupations for parents and students, Meta-cognition, immigrant background and citizenship of parents; It is worth mentioning that others have changed since converted along with other
variables in complex indicators, as we will see later.
The scaling methodology and construct validation of the complex indicators were scaled using IRT, with the One-Parameter Rasch model (Rasch, 1960) for dichotomous items, according to the following formula (OECD, 2014):
Where Pi (θn) is the probability of person n to score 1 on item i, θn is the estimated latent trait of person n and
δi the estimated location of item I on this dimension. For each item, item responses are modelled as a
function of the latent trait θn (p.312)
In the case of items with more than two (k) categories (as for example with Likert-type items) this model can be generalized to the
partial credit model (Masters and Wright, 1997), according to the following formula (OECD, 2014):
Where Pxj (θn)denotes the probability of person n to score x on item i out of the m possible scores on the
item. θn denotes the person’s latent trait, the item parameter δi gives the location of the item on the latent
continuum, and τij denotes an additional step parameter (p. 312)
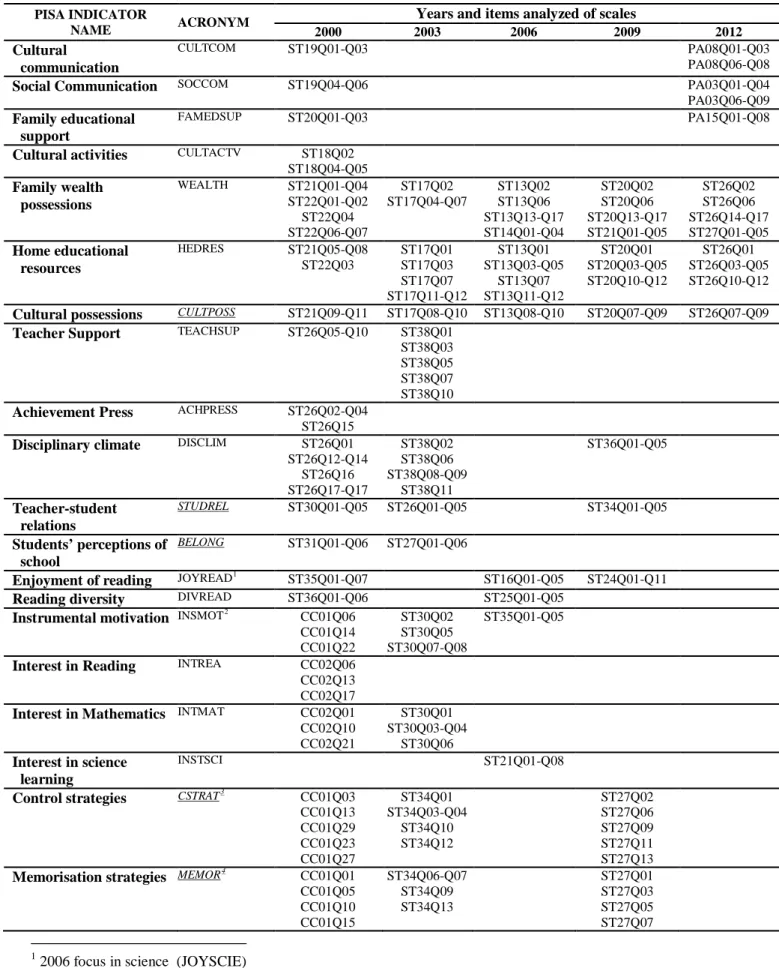
The following table contains complexes indicators with their categories of response for each application and we indicated in italics and underlined the indicators that are repeated
identical across years (see table 4). Therefore, we also indicate the differences between the indicators.
Table 3. Results of complex indicators across years and calculation of items PISA INDICATOR
NAME ACRONYM
Years and items analyzed of scales
2000 2003 2006 2009 2012
Cultural
communication
CULTCOM ST19Q01-Q03 PA08Q01-Q03
PA08Q06-Q08
Social Communication SOCCOM ST19Q04-Q06 PA03Q01-Q04
PA03Q06-Q09 Family educational
support
FAMEDSUP ST20Q01-Q03 PA15Q01-Q08
Cultural activities CULTACTV ST18Q02 ST18Q04-Q05 Family wealth possessions WEALTH ST21Q01-Q04 ST22Q01-Q02 ST22Q04 ST22Q06-Q07 ST17Q02 ST17Q04-Q07 ST13Q02 ST13Q06 ST13Q13-Q17 ST14Q01-Q04 ST20Q02 ST20Q06 ST20Q13-Q17 ST21Q01-Q05 ST26Q02 ST26Q06 ST26Q14-Q17 ST27Q01-Q05 Home educational resources HEDRES ST21Q05-Q08 ST22Q03 ST17Q01 ST17Q03 ST17Q07 ST17Q11-Q12 ST13Q01 ST13Q03-Q05 ST13Q07 ST13Q11-Q12 ST20Q01 ST20Q03-Q05 ST20Q10-Q12 ST26Q01 ST26Q03-Q05 ST26Q10-Q12
Cultural possessions CULTPOSS ST21Q09-Q11 ST17Q08-Q10 ST13Q08-Q10 ST20Q07-Q09 ST26Q07-Q09 Teacher Support TEACHSUP ST26Q05-Q10 ST38Q01
ST38Q03 ST38Q05 ST38Q07 ST38Q10 Achievement Press ACHPRESS ST26Q02-Q04
ST26Q15 Disciplinary climate DISCLIM ST26Q01
ST26Q12-Q14 ST26Q16 ST26Q17-Q17 ST38Q02 ST38Q06 ST38Q08-Q09 ST38Q11 ST36Q01-Q05 Teacher-student relations STUDREL ST30Q01-Q05 ST26Q01-Q05 ST34Q01-Q05 Students’ perceptions of school BELONG ST31Q01-Q06 ST27Q01-Q06
Enjoyment of reading JOYREAD1
ST35Q01-Q07 ST16Q01-Q05 ST24Q01-Q11 Reading diversity DIVREAD ST36Q01-Q06 ST25Q01-Q05
Instrumental motivation INSMOT2 CC01Q06 CC01Q14 CC01Q22 ST30Q02 ST30Q05 ST30Q07-Q08 ST35Q01-Q05
Interest in Reading INTREA CC02Q06 CC02Q13 CC02Q17 Interest in Mathematics INTMAT CC02Q01 CC02Q10 CC02Q21 ST30Q01 ST30Q03-Q04 ST30Q06 Interest in science learning INSTSCI ST21Q01-Q08
Control strategies CSTRAT3
CC01Q03 CC01Q13 CC01Q29 CC01Q23 CC01Q27 ST34Q01 ST34Q03-Q04 ST34Q10 ST34Q12 ST27Q02 ST27Q06 ST27Q09 ST27Q11 ST27Q13 Memorisation strategies MEMOR4
CC01Q01 CC01Q05 CC01Q10 CC01Q15 ST34Q06-Q07 ST34Q09 ST34Q13 ST27Q01 ST27Q03 ST27Q05 ST27Q07 1
2006 focus in science (JOYSCIE) 2
2003 focus in mathematics; 2006 focus in science 3
2003 focus in mathematics 4
2003 focus in mathematics
Elaboration strategies ELAB CC01Q09 CC01Q17 CC01Q21 CC01Q25 ST34Q02 ST34Q05 ST34Q08 ST34Q11 ST34Q14 ST27Q04 ST27Q08 ST27Q10 ST27Q12
Effort and perseverance EFFPER CC01Q07 CC01Q12 CC01Q20 CC01Q28 Preference for
co-operative learning COOPLRN CC02Q02 CC02Q08 CC02Q19 CC02Q22 ST37Q02 ST37Q04 ST37Q06 ST37Q08-Q09 Preference for competitive learning COMPLRN CC02Q04 CC02Q11 CC02Q16 CC02Q24 ST37Q01 ST37Q03 ST37Q05 ST37Q07 ST37Q10 Self-concept in reading SCVERB CC02Q05
CC02Q09 CC02Q23 Mathematics self-concept SCMAT5 CC02Q12 CC02Q15 CC02Q18 ST32Q02 ST32Q04 ST32Q06-Q07 ST32Q09 ST37Q01-Q06
Academic self-concept SCACAD CC02Q03 CC02Q07 CC02Q20 Perceived self-efficacy SELFEF6
CC01Q02 CC01Q18 CC01Q22
ST31Q01-Q08 ST17Q01-Q08
Control expectation CEXP CC01Q04 CC01Q11 CC01Q16 CC01Q24 Perceived ability to use
computers COMAB IT02Q01-Q03 IT03Q01 Condidence in routine tasks ROUTCONF IC06Q01 IC06Q03-Q05 IC06Q07-Q11 IC06Q18 IC06Q21 ICT program/software use PRGUSE7 IT05Q03-Q04 IT06Q02-Q05 IC05Q03 IC05Q05 IC05Q07-Q09 IC05Q11 IC04Q03 IC04Q05 IC04Q07-Q08 IC04Q10 IC06Q01-Q09 Confidence in internet tasks INTCONF IC06Q12-Q14 IC06Q19 IC06Q22 IC05Q01 IC05Q07-Q09 IC05Q13 IC05Q15 Confidence in ICT high
level tasks HIGHCONF IC06Q02 IC06Q06 IC06Q15-Q17 IC06Q23 IC05Q02-Q04 IC05Q10-Q12 IC05Q14 IC05Q16 IC08Q01-Q05 ICT Internet/entertainment use INTUSE IC05Q01-Q02 IC05Q04 IC05Q06 IC05Q10 IC05Q12 IC04Q01-Q02 IC04Q04 IC04Q06 IC04Q09 IC04Q11 IC04Q01-Q09
Attitudes towards ATTCOMP IT07Q01 IT08Q01
IC07Q01-Q04 IC10Q01-Q04
5
2006 focus in science 6
2003 focus in mathematics; 2006 focus in science
7
2012 focus at school
computers IT09Q01 IT10Q01
School autonomy SCHAUTON SC22Q01-Q12 SC26Q01-Q12 SC24Q01-Q12 Teacher Participation TCHPARTI SC22Q01-Q12 SC26Q01-Q12 SC24Q01-Q12 Teacher-related factors affecting school climate TEACBEHA SC19Q01 SC19Q03 SC19Q07-Q08 SC19Q15 SC19Q13 SC17Q16 ST25Q03 ST25Q05-Q06 ST25Q09 ST25Q11 ST25Q13 SC17Q01 SC17Q03 SC17Q05-Q06 SC17Q09 SC17Q11 SC17Q13 Student-related factors affecting school climate STUDBEHA SC19Q02 SC19Q06 SC19Q09-Q10 SC19Q13 SC19Q15 ST25Q02 ST25Q04 ST25Q07-Q08 ST25Q10 ST25Q12 SC17Q02 SC17Q04 SC17Q07-Q08 SC17Q10 SC17Q12 Teacher morales TCMORALE SC20Q01-Q04 SC24Q01-Q04
Quality of the school’s educational resources
SCMATEDU8 SC11Q04-Q09 SC08Q09
SC08Q15-Q20
SC14Q07-Q13 SC11Q07-Q13
Quality of the school’s physical infrastructure
SCMATBUI SC11Q01-Q03 SC08Q11-Q13
Teacher shortage TCSHORT9 SC21Q01-Q04 SC08Q01-Q06 SC14Q01-Q04 SC11Q01-Q04 Home possessions HOMEPOS ST17Q02-Q12 ST19Q01 ST13Q01-Q17 ST14Q01-Q04 ST15Q01 ST20Q01-Q17 ST21Q01-Q05 ST22Q01 ST26Q01-Q12 ST26Q14-Q17 ST27Q01-Q05 ST28Q01 Index of economic,
social and cultural status ESCS10 HISEI PARED WEALTH HEDRES CULTPOSS HISEI PARED HOMEPOS HISEI PARED HOMEPOS HISEI PARED HOMEPOS HISEI PARED HOMEPOS Attitudes towards school ATSCHL ST24Q01-Q04 ST33Q01-Q04
Mathematics anxiety ANXMAT ST32Q01
ST32Q03 ST32Q05 ST32Q08 ST32Q10 Student morale STMORALE SC11Q01-Q07
Teacher consensus TCCONS ST21Q03
ST22Q03 ST23Q03 Future-oriented science
motivation
SCIEFUT ST29Q01-Q04
School preparation for science career
CARPREP ST27Q01-Q04
General value of science GENSCIE ST18Q01-Q02 ST18Q04 ST18Q06 Parent’s views on
importance of science
PQSCIMP PA04Q01-Q04
Parent’s vie won general value of scienca PQGENSCI PA06Q01-Q02 PA06Q04 PA06Q06 PA06Q09
Mathematics activities MACTIV11 SCQ17Q01-Q05 ST19Q01-Q06 SC21
8
2000 one less
9
2003 one more
10
Every years with variation in the HOMEPOS
11
2006 focus in science (SCIEACT)
at school SC16Q05-Q06 SC16Q08 Personal value of science PERSCIE ST18Q03 ST18Q05 ST18Q07-Q08 ST18Q10 Parent’s view on personal value of science PQPERSCI PA06Q03 PA06Q05 PA06Q07-Q08 Awareness of environmental issues ENVAWARE ST22Q01-Q05 Perception of environmental issues ENVPERC ST24Q01-Q06 Parent’s perception os environmental issues PQENPERC PA07Q01-Q06 Environmental optimism ENVOPT ST25Q01-Q06 Parent’s environmental optimism PQENVOPT PA08Q01-Q06 Responsibility for sustainable development RESPDEV ST26Q01-Q07 Student information on science careers CARINFO ST28Q01-Q04 Science teaching: interaction SCINTACT12 ST34Q01 ST34Q05 ST34Q09 ST34Q13 ST37Q01-Q07
Science teaching: hands-on activities SCHANDS13 ST34Q02-Q03 ST34Q06 ST34Q14 ST38Q01-Q08 ST38Q01 Science teaching: student investigations SCINVEST ST34Q08 ST34Q11 ST34Q16 Science teaching: focus
on models or applications SCAPPLY ST34Q07 ST34Q12 ST34Q15 ST34Q17 School activities to
promote the learning of science
SCIPROM SC20Q01-Q05
School activities for learning
environmental topics
ENVLEARN SC22Q01-Q05
Science activities at age 10
PQSCIACT PA02Q01-Q05
Parent’s perception of school quality
PQSCHOOL PA03Q01-Q07 PA14Q01-Q07
Parent’s reports on science career motivation
PQSCCAR PA05Q02-Q05
ICT availability at home ICTHOME ST17Q04-Q06 ST20Q05-Q06 IC01Q01-Q08
Online Reading ONLNREAD ST26Q01-Q07
Library use LIBUSE ST39Q01-Q07
ICT availability at school
ICTSCH IC02Q01-Q05
ICT use at home for HOMESCH IC05Q01-Q05
12
2009 focus in Read (STIMREAD)
13
2009 focus in read (STRSTRAT)
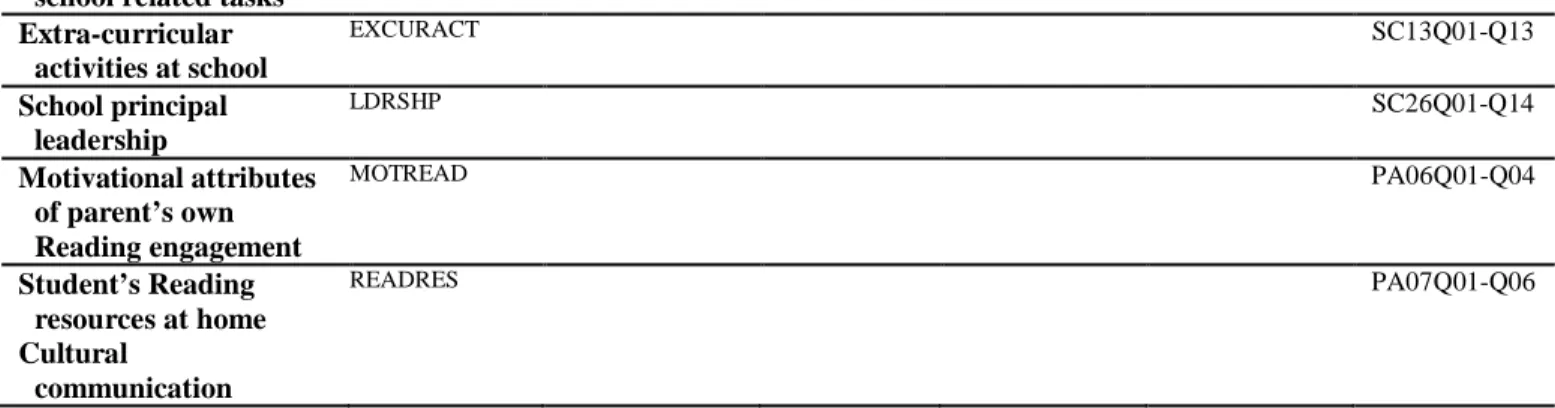
school related tasks Extra-curricular activities at school EXCURACT SC13Q01-Q13 School principal leadership LDRSHP SC26Q01-Q14 Motivational attributes of parent’s own Reading engagement MOTREAD PA06Q01-Q04 Student’s Reading resources at home READRES PA07Q01-Q06 Cultural communication
Highlights the complex indicators of Academic self-concept, Control expectation, Cultural activities, Achievement Press, Interest in Reading, Effort and perseverance, Self-concept in
Reading, Academic self-concept and Perceived
ability to use computers that only analyzed in 2000, as well as confidence in carrying out daily tasks, mathematics anxiety, Moral learner and teacher collegiality in 2003. It also highlights many interesting regarding science and environmental indicators, but has only been so wide in 2006, as shown in Table 3; from future motivation science or overall value science to school activities promoting science. In this regard, during the years 2009 and 2012 indicators are extended with respect to digital technology and competition.
In general, we can see that the complex indicators across years are focused between differents topics. For example, in PISA 2000 and PISA 2009 the focus is Mathematics, in PISA 2003 and PISA 2012 is Reading, and in PISA 2006 are the Sciences; also in PISA 2012 there are many indicators focused in digital competence.
Therefore, as shown in the chart below, analytically we can observe the variation of variables studied, and its evolution in terms of trends in PISA waves depending on the type of indicator-simple SI or complex CI- with the total set.
Figure 2. Totals of types of indicator The evolution is growing in terms of simple
indicators but will be lower in relation to complex indicators. Also, we found a total of 101 simple indicators and 100 complex
indicators (a total of 201 indicators analyzed -see table 1 and 2).
Figure 3. Totals of complex indicators and items If we look in depth in the number of
complex indicators associated with his variables respective, we can see that the trend is decreasing in some measure. Also, in relation to the 100 complex indicators we have been studied a total of 964 associated variables (see Table 3).
However, although the number of complex indicators is declining -figure 3-, the items that are included in the questionnaires are higher by year -see graphic 1- ; as it happened in relation to simple indicators -figure 2-.
The case of the index of economic, social and cultural status (ESCS)
The indicator of ESCS was used first time in the PISA 2000 with an analysis derived from five indicators: highest occupational status of parents (HISEI), highest educational level of parents (in years of education according to ISCED), family wealth
(WEALTH), cultural possessions
(CULTPOSS), and home educational
resources (HEDRES).
The ESCS for PISA 2003 and 2006 was derived from three indicators related to family background: highest parental education (in number of years of education according to ISCED classification), highest parental occupation (HISEI scores), and number of home possessions including books in the home. For this reason, in PISA 2003 and PISA 2006, PISA 2009 PISA 2012 variables compressed for the possessions of the household (HOMEPOS) indicator are all items of WEALTH, CULTPOSS and HEDRES indicators. As well as the books at home (specific question structured in a scale of response of four points; less or equal to 25 books, 26-100 books) (, 101-500 books, more than 500 books).
For each country, the ESCS scores were obtained as (OECD, 2014):
Table 4. Results of the ECSC calculation by items across years Index of economic, social and cultural status ESCS: 2000 2003 2006 2009 2012 F am il y w ea lt h pos se ss ions
WEALTH In your home, do you have:
ST21Q02: ST17Q02: ST13Q02: ST20Q02: ST26Q02:
A room of your own
ST21Q04: ST17Q06: ST13Q06: ST20Q06: ST26Q06:
Link to the internet ST21Q01 a
dishwasher? ST21Q03
educational software?
ST17Q04 d) A computer you can use for school work
ST17Q05 e) Educational software ST17Q07 g) Your own calculator
ST13Q13 A dishwasher
ST13Q14 A <DVD or VCR> player ST13Q15 <Country-specific wealth item 1> ST13Q16 <Country-specific wealth item 2> ST13Q17 <Country-specific wealth item 3>
ST20Q13 A dishwasher
ST20Q14 A <DVD or VCR> player ST20Q15 <Country-specific wealth item 1> ST20Q16 <Country-specific wealth item 2> ST20Q17 <Country-specific wealth item 3>
ST26Q14 A <DVD or VCR> player ST26Q15 <Country-specific wealth item 1> ST26Q16 <Country-specific wealth item 2> ST26Q17 <Country-specific wealth item 3> How many of these
do you have at your home? ST22Q01 <Cellular> phone ST22Q02 Television ST22Q04 Computer ST22Q06 Motor car ST22Q07 Bathroom
How many of these are there at your home? ST14Q01 Cellular phones
ST14Q02 Televisions ST14Q03 Computers ST14Q04 Cars
How many of these are there at your home? ST21Q01 Cellular phones
ST21Q02 Televisions ST21Q03 Computers ST21Q04 Cars
ST21Q05 Rooms with a bath or shower
How many of these are there at your home? ST27Q01 Cellular phones
ST27Q02 Televisions ST27Q03 Computers ST27Q04 Cars
ST27Q05 Rooms with a bath or shower
H o m e ed u cat io n al r es o u rces
HEDRES In your home, do you have:
ST21Q07 ST21Q06 ST21Q05 ST17Q01 ST17Q03 ST17Q12 ST13Q01 Un ST13Q03 Un ST13Q12 Un ST20Q01 ST20Q03 ST20Q12 ST26Q01 ST26Q03 ST26Q12 A desk to study at
A quiet place to study A dictionary ST21Q07 a desk for
study? ST21Q08 text
books?
How many of these do you have at your home? ST22Q03 Calculator
ST17Q07 your own calculator ST17Q11 books to help with your
school work
S ST13Q04 a computer you can use for school work
ST13Q05 educational software ST13Q07 you own calculator ST13Q11 Books to help with your
school work
ST20Q04 a computer you can use for school work
ST20Q05 educational software
ST20Q10 Books to help with your school work
ST20Q11 Technical reference books
ST26Q04 a computer you can use for school work
ST26Q05 educational software ST26Q10 Books to help with your
school work
Cultural possessions
CULTPOSS
In your home, do you have:
ST21Q09 ST21Q10 ST21Q11 ST17Q08 ST17Q09 ST17Q10 ST13Q08 ST13Q09 ST13Q10 ST20Q07 ST20Q08 ST20Q09 ST26Q07 ST26Q08 ST26Q09 Classical literature (e.g., <Shakespeare>)
Books of poetry
Works of art (e.g., paintings)
Home possessions HOMEPOS WEALTH+ HEDRES+ CULTPOSS WEALTH+ HEDRES+ CULTPOSS+
How many books are there in your home? (ST19Q; ST15; ST22; ST28)
Highest parental occupation
HISEI ISEI The highest occupational status of parents according to the ICED clasification
Highest parental education PARED (expressed as years of schooling)
The case of the ESCS is odd because although it has been significantly varying your calculation regarding the inclusion of differences between variables for indicators and general index, over the years been coming as a single status to consider for its analysis. I.e., as you can see between years, wealth and family possessions are not equal in any of the waves. As you can see the same situation with regard to the educational resources home. On the contrary, there is certain unification in relation to the indicator cultural possessions, possessions from home, level highest family occupation and level higher than family
studies; Stressing that from 2003 includes the variable number of books home.
For this reason, the OECD has had to go making great efforts of compensation between the calculations of this controversial index made up of several simple and complex, indicators that certainly deserves a more thorough analysis and in depth; focus of attention will be addressed in future research.
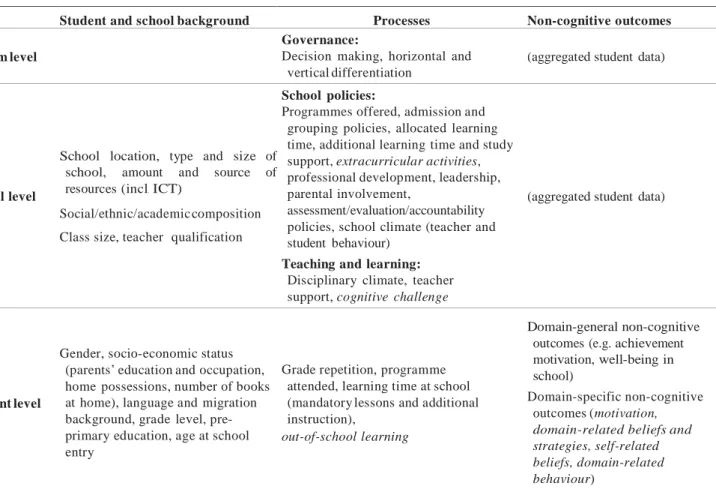
In this order of things, it is convenient to observe which analyzes PISA about 2015 context questionnaires. To do this, below the measures with respect to the core of evaluation of context and its planned structure modular. Table 5. Measures to be included in the core context assessment for Pisa
Student and school background Processes Non-cognitive outcomes System level
Governance:
Decision making, horizontal and vertical differentiation
(aggregated student data)
School level
School location, type and size of school, amount and source of resources (incl. ICT)
Social/ethnic/academic composition Class size, teacher qualification
School policies:
Programmes offered, admission and grouping policies, allocated learning time, additional learning time and study support, extracurricular activities, professional development, leadership, parental involvement,
assessment/evaluation/accountability policies, school climate (teacher and student behaviour)
Teaching and learning:
Disciplinary climate, teacher support, cognitive challenge
(aggregated student data)
Student level
Gender, socio-economic status (parents’ education and occupation, home possessions, number of books at home), language and migration background, grade level, pre-primary education, age at school entry
Grade repetition, programme attended, learning time at school (mandatory lessons and additional instruction),
out-of-school learning
Domain-general non-cognitive outcomes (e.g. achievement motivation, well-being in school)
Domain-specific non-cognitive outcomes (motivation, domain-related beliefs and strategies, self-related beliefs, domain-related
behaviour)
Note: Measures in italics are adapted to the respective major domain, e.g. science in PISA 2015. Source: (OECD, 2016)
Table 6 shows the modular structure of PISA 2015, placing the modules in the overall structure of context, process and results,
including the areas of non-cognitive outcomes, context of the student content, political and Government of teaching and learning.
Table 6. Modular structure of the PISA 2015 context assessment design
Student background Processes
Non-cognitive outcomes
Family Education Actors Core processes Resource
allocation S ci en ce -rel a ted to p ics 5 Out-of-school science experience 1. Teacher qualification and professional knowledge 2. Science teaching practices 12. Learning time and curriculum 4. Science-related outcomes: motivation, interest, beliefs…
Teaching and learning
3. School level learning environment for science
G en era l t o p ics 7. Student SES and family 9. Educational pathways in early childhood 14. Parental involvement 13. School climate: interpersonal relations,, trust, expectations 16. Resources 6. Career aspirations 8. Ethnicity and immigration 15 Leadership and school management 10. General behaviour and attitudes School policies 17. Locus of decision making within the school system 19 Assessment, evaluation and accountability 18. Allocation, selection and choice 11. Dispositions for collaborative problem solving Governance Source: (OECD, 2016, pág. 107)
Non-cognitive outcomes include high priority modules 10 (general domain student attitudes and behavior) and 4 (results related to science; motivation, attitudes, beliefs) as well
as low-priority modules 6 (Science Careers) and 11 (available for collaborative problem solving).
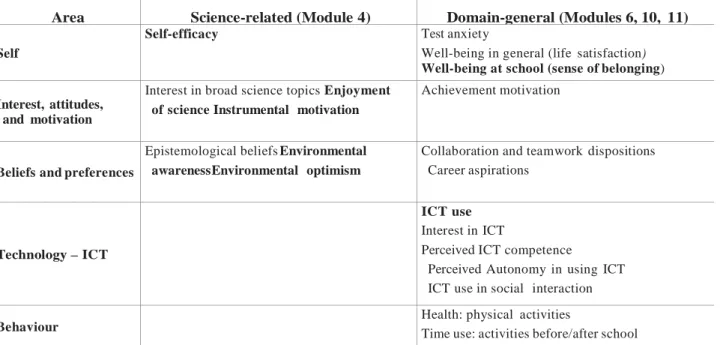
Table 7 • Measures of non-cognitive outcomes included in the Pisa 2015 main survey
Area Science-related (Module 4) Domain-general (Modules 6, 10, 11)
Self
Self-efficacy Test anxiety
Well-being in general (life satisfaction)
Well-being at school (sense of belonging)
Interest, attitudes, and motivation
Interest in broad science topics Enjoyment of science Instrumental motivation
Achievement motivation
Beliefs and preferences
Epistemological beliefs Environmental awareness Environmental optimism
Collaboration and teamwork dispositions Career aspirations
Technology – ICT
ICT use
Interest in ICT
Perceived ICT competence
Perceived Autonomy in using ICT ICT use in social interaction
Behaviour Health: physical activities
Time use: activities before/after school
Note: bold = trend measures. Source: OECD, 2016, p. 109. Another considered paragraph is the
evaluation of the processes of teaching and learning, with high-priority modules 2 (teaching practices of science), 12 (learning
and curriculum) and 1 (qualifications of teacher and professional knowledge), together with the low-priority module 5 (experience outside of school science).
Table 8. Assessment of learning time and loss of learning time in PISA 2015
Student Questionnaire School Questionnaire
Student
+ Additional instruction and study (time use) - Truancy
Engaged time (ET) =
RT – student absenteeism, truancy, mentally disengaged time
Classroom
- Disciplinary climate and loss in science classes
Realised learning time (RT) =
PT – loss due to classroom management,
assessment time, waiting time, etc�
School
+ Amount of school learning time
+ Number and type of science classes
- Loss on school level Provided learning time (PT) =
AT – loss due to weather, holidays,
teacher absenteeism, etc�
Source: OECD, 2016, p. 113. The teacher-related measures are shown in
table 9.
Table 9. teacher-related measures in the Pisa 2015 field trial
Science-related General
Background Gender, age, employment status, job experience, subjects studied
Initial education
Goal of first qualification, type of teacher education and training programme (if attended), mode of qualification
N b f h b d i l l (S Q)
Science-related content
Number of science teachers by level of qualification
Professional development
Participation in different type of activities
Obligation amount of participation, school policies (ScQ) Collaboration
Science-related content
Co-operation General content
Beliefs Self-efficacy (related to science content and teaching science) Job satisfaction
Source: OECD, 2016, p. 114
Note: If not indicated otherwise, constructs are included in the optional PISA 2015 Teacher Questionnaire
Finally, in the section on evaluation policies, advice and Government, include module 19 (advice, assessment and accountability) of high priority and modules of
low-priority 3 (level school for science learning environment) and 13-18 - see table 10.
Table 10. Measures in Pisa 2015 related to assessment, evaluation and accountability
External evaluation Teacher evaluation Internal evaluation Formative assessment
Purpose and criteria
General assessment practice (ScQ) Purpose of assessment results (ScQ)
Evaluation policies (ScQ) Teacher’s grading (TQG)
Practices Teacher-evaluation methods (ScQ) Classroom-assessment instruments (TQG/TALIS) Use and consequences Processes of external evaluation (ScQ) Use of achievement data for accountability (ScQ) Consequences of internal evaluation (ScQ) Feedback: student perception (StQ) Adaptation of instruction (StQ) Source: OECD, 2016, p. 116. Indicators studies
Studies that used these indicators focuses on the relationship between one or more variables of type performance, gender, autonomous and simple or complex indicators such as those reported by PISA in Focus (general -
http://www.mecd.gob.es/inee/PISA-in-focus.html). Or in some of the newsletters
EducaINEE
(
http://www.mecd.gob.es/inee/Boletin-de-educacion.html) where relevant results are
extracted from PISA studies in general or focusing on specific countries, in our case in Spain, in some cases by analyzing the differences by autonomous communities, as is the case with the series of AACC.
Table 11. Summary of results of some research context indicators.
DATE TITLE RESULTS INDICATORS
JUN-15 Assistance to early childhood education and performance in mathematics. The case of the Spanish autonomous communities. (INEE, 2015a)
Students attending preschool show superior performance in math than those who did not. This difference is significant between all the autonomous communities.
To greater economic, Social and Cultural status of PISA index likely to gain access to early childhood education by AACC
DEC-14 Motivation to learn Mathematics and PISA 2012: the case of the Spanish autonomous communities. (INEE, 2014a)
In Spain students who are more motivated to learn math, because they believe that it will be beneficial to their future studies and careers, earn best score in math.
On average, boys are more motivated to learn mathematics than girls are. In the autonomous communities, this gender gap in motivation is positively associated with the difference in score in mathematics between boys and girls. AACC JUN-14 Persevering to success in studies:
PISA 2012 and the autonomous communities. (INEE, 2014b)
Spanish students demonstrate levels of perseverance that are among the highest in the OECD countries. All the communities that have participated in PISA 2012 exceed the average for developed countries, except for Balearic Islands and Catalonia. Basque country, Andalusia, Madrid and Extremadura stand out for the high rates of perseverance
the data indicate the existence of a positive effect of perseverance on the score
PISA 2012 raises students specific questions about if at the onset of a problem surrender immediately; they postpone the difficult problems; or on the contrary remain interested in tasks that start and continue working on a task until everything is perfect. AACC
MAY-14 Occupations of parents and PISA 2012 (INEE, 2014c)
There are substantial differences in the educational achievement of students according to the type of work of the parents. At international level, children of parents with more skilled occupations tend to perform better than the other students. The educational systems of the autonomous communities with a composition of employment more oriented to the most qualified occupations, obtain best average scores.
Occupations of parents AACC
MAR-14 Truant and PISA 2012 (INEE, 2014d) PISA 2012 students were asked about how many times had arrived late or missed some classes or whole days of school without permission during the two weeks prior to the test. Throughout the OECD 35% arrived later once the Center percentage identical to the Spain. There are differences of up to 15 points between AA CC participating in PISA.
The higher the percentage of students who miss class for days, tends to be lower scoring students who never missing
Question being late or missing. Performance by AACC
FEB-16 Low achievers: why get left behind and how we can help them (INEE, 2016)
The PISA study defines students with underachievement as those whose score is below the level 2 on the PISA scale.
Performance / GDP / repeat course / duties / subjects / sex / absences attendance / perseverance / leadership / resources.
JUN-15 Effects of the schoolmates in academic performance (INEE, 2015b)
An increase of 10 percentage points in the proportion of girls improves educational outcomes in children mathematics and General. Results on girls is not significant.
NOV-14 The results of learning in mathematics at PISA 2012 (INEE, 2014e)
The most important factor in explaining differences in the results of mathematics is repetition. The difference in performance between students who have repeated ever and the non-repeaters corresponds to more than two years of schooling. There is an inverse relationship between the socio-economic level and the percentage of repeaters, made that questions the fairness of the system.
• On the other hand, as reflected in other reports of PISA, education in a public or private Centre hardly influences the results of mathematics
• Both the effort and productivity are important factors in explaining academic results.
Index of sociometric status and Cultural (ESCS) / Center (Pub, priv) / repeat course (Yes/No) productivity / effort
JUL-14 Spanish results in financial competence in PISA (I) (INEE, 2014f)
The level of financial competence of Spanish students is below the OECD average. This is due mainly to the lower percentage of students with a high level of financial competence.
• 64% of the variation in the results in financial competition in Spain is measured by the skills in math and reading. The percentage of financial competition variation explained by competition in mathematics is in Spain the highest of the whole sample of countries assessed.
• The Spanish girls score lower in financial skills than boys, although the differences are not statistically significant.
• Immigrant status affects the scores achieved in financial competition in the negative sense.
• The educational level of the parents has a positive influence on the financial competence of children.
• Students who have repeated course are worse than the non-repeaters. The gap between these groups is lower in Spain than in the OECD. The Spanish repetitive score is higher than the counterparts in the OECD.
• Larger municipalities are associated with higher scores in financial competition.
Financial competence / performance / troubleshooting / gender / immigrant / repeat / parent education / size town / skills in math and reading
MAY-14 Computers and academic performance (INEE, 2014g)
There is moderate evidence on the positive effect of the use of computers in the school performance in Spain. In the most disadvantaged socio-economic contexts, the effect is even more significant, which would be a potential tool to achieve greater equity. However, the results are not at all significant, raising doubts about the impact of the use of computers on academic performance.
Performance / use of goats and Tena (2013) computers in a recent article estimated the causal effect of the use of computers in the results of the Spanish students in the PISA 2012 event.
Non-parametric Bayesian modelization APR-14 Spanish results in competence of
problem solving in PISA (INEE, 2014h)
Evaluation of the ability of students to solve problems this competition aims to measure the essential cognitive processes that students should use to resolve problems that may be found in your everyday life. Problem solving is evaluated by a computer, which allows you to record data on aspects such as the type, frequency, duration and order of the actions carried out by the students when they answered the questions.
Troubleshooting / gender / immigrant / repetition / sociometric status socio-economic status of students, approximate in PISA by an index that includes the educational level of the parents, your professional occupation and the technological and cultural resources available in the home.
FEB-14 Disaggregated analysis of the results of Spain in PISA (INEE, 2014i)
In the case of Spain results from PISA 2012 show differences of up to 53 points in favour of the natives, up to 57 points in favor of those who have not repeated ever and up to 132 points in favor of the students when one of the parents has completed tertiary studies. The results suggest that if:
1) stabilizes the phenomenon of immigration, 2) Gets a greater reduction of the problems of repetition, supported by a real educational improvement, and
3) continues the improvement of educational levels of parents, one might expect in the future a further progress of results and better positioning of Spain in the international context in this area as relevant for the possibilities of social and economic development.
Techniques shift-share of decomposition of differences, the impact of the condition of immigrant, Repeater and the educational level of the parents in the evolution in time of the results obtained by Spain in PISA, as well as in the position relative to developed countries
DEC-13 PISA 2012: results by computer (INEE, 2013)
The results of Spain are significantly lower when students take the test in computer instead of doing it on paper.
• Compared to what was happening on paper, Spain has one higher proportion of students to the OECD in the lower levels, especially in reading comprehension. At higher levels, the OECD presents percentages much higher than Spain, as it did in the paper.
• In the whole of the OECD, in mathematics, both sexes perform better when they perform the test by computer than when do them on paper, as opposed to in Spain. However, in reading comprehension only boys perform better on the test computer for the whole of the OECD. In addition, the differences between both modes of testing are much higher in Spain than in the OECD average.
Evaluation of mathematical competition. • Evaluation of General knowledge and skills related to the technologies of information and communication technology (ICT): use of the keyboard and mouse, and other common conventions. • Evaluation of competences related to the interaction between mathematics and ICT: realization of graphics through an Assistant, planning and implementation of a strategy for sorting in a spreadsheet to locate the desired data
autonomy in the management of the centers, the differences between public and private schools, the use of instruments of accountability or the discipline in the classroom.
Centre / Performance / Discipline
On the other hand, the table 12 shows some studies on PISA 2006 context indicators are
used.
Table 12. Selected analytical models used in publications on the PISA 2006 data for contexts of science achievement
Publication Research Question or Model
Nagengast and Marsh (2014) Cross-cultural measurement invariance for motivation and engagement in science
Drechsel, Carstensen and Prenzel (2011)
Dimensionality of science interest
Olsen and Lie (2011) Country- and culture specific profiles of interest
Ainley and Ainley (2011a) Students’ enjoyment, learning engagement, and achievement Ainley and Ainley (2011b) Knowledge, affect, value, and students’ interest in science Lavonen and Laaksonen
(2009)
Learning activities, interest in science, efficacy, self-concept, and performance
Fensham (2009) Gender, task context and science performance Buccheri, Gruber and
Bruhwiler (2011)
Gender specificity in interest and vocational choices Mc Conney et al. (2011) Science interests among minority students
Luu and Freeman (2011)
Scientific literacy and ICT-related variables Kubiatko and Vlckova (2010)
Ho (2010) Parental involvement and students’ science performance Basl (2011)
Explaining interest in future science-related careers Kjaernsli and Lie (2011)
Willms (2010) School composition, school and classroom context, and
students’ literacy skills
Dincer and Uysal (2010) Effects of school programme types
Coll et al. (2010) influence of educational context in a western vs. Asian country Source: OECD, 2016, p. 127
Conclusion
The PISA tests have become a global benchmark for evaluation and improvement of educational systems of the countries that conducted them. Despite the opinions against, PISA has come to stay. It is in general something abstract the public fails to understand but which everyone says.
The need to establish instruments of context which put the results merely performance on their actual situation is beyond doubt. They are especially necessary when it comes to evaluating education systems and improve them based on the comparison between countries, as it is the end of PISA.
In this work we have performed a review on the main indicators used by the various editions of PISA. Through this study, we have
seen how some indicators have been used in all editions, while others have fallen by the way, surely due to its little use.
It has been like some context indicators have been maintained throughout the various editions of PISA, while others have been varying from simple to complex or disappearing. Others have appeared in some editions, disappeared in the following and returned to use in others. The establishment of a model in which there are indicators which remain throughout different editions will allow comparison between the editions and a better adaptation of the results for longitudinal studies. This model has established itself already in PISA 2015, based on the experience of PISA 2012.
De la Orden and Jornet (2012) already noted the importance of considering the selection of the variables that measure in any plan of evaluation put this has consequences both in the approach and results. Why highlight that many reports on evaluation of systems provide results on variables of performance in a way isolated with respect to context variables referring to these aspects in a very superficial manner. For this reason, it advocates a model of evaluation of innovative, incorporating the knowledge acquired in educational research, the explanatory models of performance and a way of optimizing working for the development of systems of context questionnaires.
There is no doubt that the focus of indicators is an analysis to guide level macro on education, therefore, information that we must call this type of evaluations should be at this level and not to others, i.e., nor meso or micro analytical.
In this sense, although evaluative approaches most macro indicators have the shaft noun related to the performance of students, as they point out Jornet, López González & Touron (2012) there is also an option that allows to explain the performance from contextual so-called indicators - really of input, process, and context-(Jornet, 2012). In this way, would have the possibility to provide more holistic information in order to identify the keys to improving education, or give a reason for the why of certain results, from the performance variables relate to these context variables.
The possibility of accessing to the PISA data allows researchers realize studies that are not left in the mere description based on averages or percentages, but integrated into more complex studies nested variables which undoubtedly enhance the effect pursued by PISA.
References
Adams, R., & Wu, M. (2002). PISA 2000. Technical Report. París: OECD Publishing.
Bisquerra, R. (2012). Metodología de la investigación educativa. Madrid: La Muralla. Coleman, J. S., Campbell, E. Q., Hobson, C.
J., McPartland, J., Mood, A. M., Weinfeld, F. D., & York, R. L. (1966). Equality of Educational Opportunity. Washington, DC: US Government Printing Office.
De la Orden, A., & Jornet, J. M. (2012). La utilidad de las evaluaciones de sistemas educativos: el valor de la consideración del contexto. Bordón, 64(2), 69-88.
Duru-Bellat, M. (2013). Desde el atractivo poder de los datos de PISA a las desilusiones del Benchmarking. ¿Desafío a la evaluación de los sistemas educativos? Profesorado. Revista de currículum y formación del profesorado, 17(2), 94-104. Retrieved from
http://recyt.fecyt.es/index.php/profesorado/ar ticle/view/42409/24335
Gaviria, J. L., & Castro, M. (2005). Modelos jerárquicos lineales. Madrid: La Muralla. González-Montesinos, Manuel-Jorge &
Backhoff, Eduardo (2010). Validación de un cuestionario de contexto para evaluar sistemas educativos con Modelos de Ecuaciones Estructurales. RELIEVE, 16(2),
art. 4. doi:
http://dx.doi.org/10.7203/relieve.16.2.4133
Instituto Nacional de Evaluación Educativa (INEE). (2013). PISA 2012: resultados por
ordenador. EducaINEE (Boletín de
educación). Ministerio de Educación, Cultura
y Deporte. Retrieved from
http://www.mecd.gob.es/dctm/inee/boletines/
actualizacion.boletin25/educaineeboletin25.p df?documentId=0901e72b818cf242
Instituto Nacional de Evaluación Educativa (INEE). (2014a). Motivación para aprender matemáticas y PISA 2012: el caso de las CC.AA. españolas. EducaINEE (Boletín de Educación). Ministerio de Educación, Cultura y Deporte. Retrieved from
http://www.mecd.gob.es/dctm/inee/boletines/ especialccaa/educaineeautonomias4.pdf?doc umentId=0901e72b81b583ae
Instituto Nacional de Evaluación Educativa (INEE). (2014b). Perseverando hacia el éxito
en los estudios: PISA 2012 y las CC.AA. EducaINEE (Boletín de educación). Ministerio de Educación, Cultura y Deporte.
Retrieved from
http://www.mecd.gob.es/dctm/inee/boletines/ especialccaa/educaineeautonomias3.pdf?doc umentId=0901e72b819c7cac
Instituto Nacional de Evaluación Educativa (INEE). (2014c). Ocupaciones de los padres y PISA 2012. EducaINEE (Boletín de educación). Ministerio de Educación, Cultura
y Deporte. Retrieved from
http://www.mecd.gob.es/dctm/inee/boletines/ especialccaa/educaineeautonomias2.pdf?doc umentId=0901e72b81952125
Instituto Nacional de Evaluación Educativa (INEE). (2014d). Hacer novillos y PISA 2012. EducaINEE (Boletín de educación). Ministerio de Educación, Cultura y Deporte.
Obtenido de
http://www.mecd.gob.es/dctm/inee/boletines/ especialccaa/educaineeautonomias1.pdf?doc umentId=0901e72b8190a44e
Instituto Nacional de Evaluación Educativa (INEE). (2014e). Los resultados de aprendizaje en matemáticas en PISA 2012. EducaINEE (Boletín de educación). Ministerio de Educación, Cultura y Deporte.
Retrieved from
http://www.mecd.gob.es/dctm/inee/boletines/
educainee3925-11-2014.pdf?documentId=0901e72b81b46542
Instituto Nacional de Evaluación Educativa (INEE). (2014f). Los resultados españoles en la competencia financiera en PISA (I). EducaINEE (Boletín de educación). Ministerio de Educación, Cultura y Deporte.
Retrieved from
http://www.mecd.gob.es/dctm/inee/boletines/
educainee-35.-140709.pdf?documentId=0901e72b81a2be86
Instituto Nacional de Evaluación Educativa (INEE). (2014g). Ordenadores y resultados académicos. EducaINEE (Boletín de educación). Ministerio de Educación, Cultura
y Deporte. Retrieved from
http://www.mecd.gob.es/dctm/inee/boletines/
boletindeeducacion32v3.pdf?documentId=09 01e72b81977c07
Instituto Nacional de Evaluación Educativa (INEE). (2014h). Los resultados españoles en la competencia de resolución de problemas en PISA. EducaINEE (Boletín de educación). Ministerio de Educación, Cultura
y Deporte. Retrieved from
http://www.mecd.gob.es/dctm/inee/boletines/
educainee-31cba-3-3.pdf?documentId=0901e72b8190c336
Instituto Nacional de Evaluación Educativa (INEE). (2014i). Análisis desagregado de los resultados de España en PISA. EducaINEE (Boletín de educación). Ministerio de Educación, Cultura y Deporte. Retrieved from
http://www.mecd.gob.es/dctm/inee/boletines/ educainee27.pdf?documentId=0901e72b8186 8b0a
Instituto Nacional de Evaluación Educativa (INEE). (2015a). Asistencia a la Educación Infantil y Rendimiento en Matemáticas. El caso de las CC.AA. españolas. EducaINEE (Boletín de educación), Ministerio de Educación, Cultura y Deporte. Retrieved from
http://www.mecd.gob.es/dctm/inee/boletines/ especialccaa/educaineeautonomias5.pdf?doc umentId=0901e72b8201fe12
Instituto Nacional de Evaluación Educativa (INEE). (2015b). Efectos de los compañeros de clase en el rendimiento académico. EducaINEE (Boletín de educación). Ministerio de Educación, Cultura y Deporte.
Retrieved from
http://www.mecd.gob.es/dctm/inee/boletines/ educainee44.pdf?documentId=0901e72b8201 3480
Instituto Nacional de Evaluación Educativa (INEE). (2016). Alumnos de bajo rendimiento: por qué se quedan atrás y cómo se les puede ayudar. EducaINEE (Boletín de educación). Ministerio de Educación, Cultura
y Deporte. Retrieved from
http://www.mecd.gob.es/dctm/inee/boletines/ educainee47.pdf?documentId=0901e72b8202 aa4e
Jornet, J. M. (2012). Dimensiones Docentes y Cohesión Social: Reflexiones desde la Evaluación. Revista Iberoamericana de Evaluación Educativa, 5 (1e), pp.349-362.
Retrieved from
http://www.rinace.net/riee/numeros/vol5-num1_e/art27.pdf
Jornet, J. M., López-González, E., & Tourón, J. (2012). Evaluación de sistemas educativos: teoría y experiencia. Bordón, 64(2), 9-11. López-González, E., González-Such, J., &
Lizasoain, L. (2012). Explicación del rendimiento a partir del contexto. Algunas propuestas de análisis gráfico y estadístico. Bordón, 64(2), 127-149.
Marchesi, Á. (2006). El informe PISA y la política educativa en España. Revista de Educación, extraordinario, 337-355.
Martínez Arias, R. (2006). La metodología de los estudios PISA. Revista de Educación, extraordinario, 111-129.
Masters, G., & Wright, B. (1997). The Partial Credit Model. In W. Van de Linden, & R. Hambleton, Handbook of Modern Item
Response Theory. New
York/Berlin/Heidelberg: Springer.
OCDE (2002). PISA 2000 Technical Report. Paris: OECD Publishing. Retrieved from
https://www.oecd.org/pisa/pisaproducts/3368 8233.pdf
OCDE (2005). PISA 2003. Technical Report. Paris: OECD Publishing. Retrieved from
https://www.oecd.org/edu/school/programme forinternationalstudentassessmentpisa/35188 570.pdf
OCDE. (2009). PISA 2006. Technical Report. Paris: OECD Publishing. Retrieved from
https://www.oecd.org/pisa/pisaproducts/4202 5182.pdf
OCDE. (2012). PISA 2009. Technical Report. París: OECD Publishing. Retrieved from
https://www.oecd.org/pisa/pisaproducts/5003 6771.pdf
OCDE. (2014). PISA 2012. Technical Report. París: OECD Publishing. Retrieved from
https://www.oecd.org/pisa/pisaproducts/PIS A-2012-technical-report-final.pdf
OCDE. (2016). PISA 2015 Context Questionnaires Framework. In OECD, PISA 2015 Assessment and Analytical Framework: Science, Reading, Mathematic and Financial Literacy. París: OECD Publishing. doi:
http://dx.doi.org/10.1787/9789264255425-7-en
Popkewitz, T. (2013). PISA: números, estandarización de la conducta y la alquimia de las materias escolares. Profesorado. Revista de curriculum y formación del profesorado, 17(2), 47-64.
Rasch, G. (1960-1980). Probabilistic models for some intelligence and attainment tests. Copenhge: Nielsen & Lydiche, 1960-1980 (Re-edited in 1980 by University of Chicago Press).
Rendon, S., & Navarro, E. (2007). Estudio sobre el rendimiento en Matemáticas en España a partir de los datos del informe PISA 2003. Un modelo jerárquico de dos niveles. Revista Iberoamericana sobre Calidad, Eficacia y Cambio en Educación, 5(3), 118-136.
Rindermann, H. (2007). The g-factor of international cognitive ability comparisons: the homogeneity of results in PISA, TIMSS, PIRLS and IQ-tests across nations. European Journal of Personality, 21(5), 667-706. doi:
http://dx.doi.org/10.1002/per.634
Sancho-Álvarez, C., Jornet, J. M., & González-Such, J. (2016). El constructo Valor Social Subjetivo de la Educación: validación cruzada entre profesorado de escuela y universidad. Revista de Investigación Educativa, 34(2), 329-350. doi:
Acknowlegment
This work was performed under the project R & D Sistema educativo y cohesión social: diseño de un modelo de evaluación de
necesidades (SECS/EVALNEC). Ref.
EDU2012-37437, funded by the Ministry of Economy and Competitiveness of Spain. As
well as by Ajudes per a la formació de personal investigador de caràcter predoctoral, en el marc del Subprograma “Atracció de Talent 2013”
Autor To know more / Saber más
González-Such, José ([email protected]).
PhD in Education, Pedagogue and Professor of the Department of Research Methods and Diagnosis in Education (MIDE) of University of Valencia. He is the contact author for this article. Member of the Assessment and Measurement Group (GEM). His main lines of research are: Educational Measurement and Evaluation, Teacher Evaluation and Educational Innovation. Postal address: Faculty of Philosophy and Educational Sciences. University of Valencia. Avda. Blasco Ibáñez, 30. 46010 Valencia (Spain).
Sancho-Álvarez, Carlos ([email protected])
Research personnel in training of the Department of Research Methods and Diagnosis in Education (MIDE, in Spanish) of University of Valencia. Master in Social and Community Psychopedagogy, Bachelor in Pedagogy from the University of Valencia, and a diploma in Education from the University of Alcalá. Currently enrolled in a PhD program in Education at University of Valencia. Member of the Assessment and Measurement Group GEM-Educo. Postal address: Faculty of Philosophy and Educational Sciences. University of Valencia. Avda. Blasco Ibáñez, 30. 46010 Valencia (Spain)
0000-0001-9489-2502
Sánchez-Delgado, Purificación ([email protected]).
Professor Doctor of Department of Research Methods and Diagnosis in Education (MIDE) of University of Valencia. Member of the Assessment and Measurement Group (GEM). In the field of educational measurement works in development and validation of tests to measure different types of educational variables language area related. Postal address: Faculty of Philosophy and Educational Sciences. University of Valencia. Avda. Blasco Ibáñez, 30. 46010 Valencia (Spain).
R
evista
EL
ectrónica de
I
nvestigación y
EV
aluación
E
ducativa
E-Journal of Educational Research, Assessment and Evaluation
[ISSN: 1134-4032]
© Copyright, RELIEVE. Reproduction and distribution of this articles it is authorized if the content is no modified
and their origin is indicated (RELIEVE Journal, volume, number and electronic address of the document).
© Copyright, RELIEVE. Se autoriza la reproducción y distribución de este artículo siempre que no se modifique el contenido y se indique su origen (RELIEVE, volumen, número y dirección electrónica del documento).