This is the author version published as:
This is the accepted version of this article. To be published as :
This is the author version published as:
QUT Digital Repository:
http://eprints.qut.edu.au/
Khan, Roheena Q. and Corney, Malcolm W. and Clark, Andrew J. and Mohay,
George M. (2010)
Transaction mining for fraud detection in ERP Systems
.
Industrial Engineering and Management Systems, 9(2).
________________________________________ ________________________________________ ________________________________________ ________________________________________ † : Corresponding Author
Transaction Mining for Fraud Detection
in ERP Systems
Roheena Khan†, Malcolm Corney, Andrew Clark, George Mohay
Information Security Institute
Queensland University of Technology, Brisbane 4001, AUSTRALIA +61-07-313-89386, Email: {r.khan, m.corney, a.clark, g.mohay}@qut.edu.au
Abstract. Despite all attempts to prevent fraud, it continues to be a major threat to industry and government.
Traditionally, organizations have focused on fraud prevention rather than detection, to combat fraud. In this paper we present a role mining inspired approach to represent user behaviour in Enterprise Resource Planning (ERP) systems, primarily aimed at detecting opportunities to commit fraud or potentially suspicious activities. We have adapted an approach which uses set theory to create transaction profiles based on analysis of user activity records. Based on these transaction profiles, we propose a set of (1) anomaly types to detect potentially suspicious user behaviour, and (2) scenarios to identify inadequate segregation of duties in an ERP environment. In addition, we present two algorithms to construct a directed acyclic graph to represent relationships between transaction profiles. Experiments were conducted using a real dataset obtained from a teaching environment and a demonstration dataset, both using SAP R/3, presently the predominant ERP system. The results of this empirical research demonstrate the effectiveness of the proposed approach.
Keywords: Fraud Detection, Audit Trail Analysis, Security, Role Mining, Anomaly Detection, Enterprise
Resource Planning Systems.
1. INTRODUCTION
Fraud costs the Australian economy up to 3 billion dollars each year (Standards Australia 2008). Not only is the financial loss a great concern, fraud also means reduced macroeconomic outcomes. Yet, many businesses today are ill-prepared to detect and prevent fraud, with many having made little or no progress in developing any form of effective fraud control strategy (Standards Australia 2008). Although numerous high-end data mining tools incorporating fraud detection capabilities are available (Mohay et al. 2003), they only detect certain types of frauds; their capabilities are usually limited since the detection relies on simple, built-in rules defined by domain experts. Fraud examiners and auditors require scripting skills and an understanding of the underlying data mining functions to conduct effective audits.
As significant advances in technology emerge, more and more organizations are now adopting ERP systems, with most of the Fortune 1000 firms having installed ERP systems to run their businesses (Bingi et al. 1999). An ERP system is a packaged software solution that aims to automate and integrate the core business processes of an
organization. Whilst ERP systems provide numerous benefits to organizations, due to their nature they are vulnerable to many internal and external threats (Little and Best 2003).
Since the advent of ERP systems in the 1990s, researchers have primarily focused on fraud prevention rather than fraud detection. Many recent publications have discussed fraud prevention approaches such as role-based access control, segregation of duties, encryption, username and passwords, etc. (Huang et al. 2008; Vaidya et al. 2008; Albrecht et al. 2009). Although many organizations employ fraud prevention techniques, these only prevent simple kinds of fraud from occurring and are not enough on their own (Bolton and Hand 2002). Complex instances of fraud built over time, involving various applications, are difficult to prevent. Nevertheless only a few publications deal with fraud detection approaches in ERP systems (Cahill et al. 2002; Best et al. 2009). Another driver for better fraud detection particularly in ERP systems, is the shift towards service oriented architectures. These architectures allow a higher degree of automation of business processes, which may lead to more cases of fraud as the number of human checks are reduced and the number of entry points into the
system are increased.
Typically, auditors and fraud examiners review audit logs to detect fraud in ERP systems, a labor-intensive task requiring time, effort and resources (Wells 2008). In order to conduct effective audits, they need to have a good understanding of the business, ERP software and its features. According to the ACFE report to the nation (2006), most frauds are detected by tip or by accident. Generally fraudsters start by stealing smaller amounts, but if not detected early, they continue to steal larger and larger amounts. Also fraud detection is a continuously evolving discipline; as detection strategies are learned and therefore circumvented more easily by fraudsters, early detection is extremely critical. While regular audits are conducted generally once every financial year, fraud will only be detected towards the end of the year. In fact, according to the KPMG fraud survey (2006), the average time to detect fraud is 18 months.
The cost of financial fraud and its pervasive long-term impact is enormous. Organizations that have suffered fraud not only bear the direct cost of the fraud itself but also the indirect costs of investigating and preventing fraud from reoccurring. Victim organizations lose investor and consumer confidence and in many cases are unable to recover the losses. The typical organization loses 7% of its annual revenue to fraud (ACFE 2008) and according to a recent survey, as many as 42% of organizations recover none of their losses after discovering fraud (ACFE 2006). If a cost benefit analysis is done, the cost of not employing any fraud detection measures potentially outweighs the cost of the fraud detection system. Therefore it is not only prudent but critical that fraud detection measures form an essential component of both the risk mitigation strategy and the overall business strategy of the organization. The proposed system assists in mitigating the risk of financial fraud and aims to protect stakeholders such as shareholders, customers, suppliers and banks from the implications of fraud.
ERP systems typically use a form of role based access control which can assist in the segregation of duties to reduce the opportunities to commit fraud. Many researchers have discussed the use of role mining techniques to automatically identify roles from existing permissions assigned to users within an organization (Sandhu et al. 1996; Kuhlmann et al. 2003; Schlegelmilch and Steffens 2005; Vaidya et al. 2006; Zhang et al. 2007). Our current work has been motivated by role mining techniques, adapted to identify transaction profiles and so detect suspicious activities or anomalies and violations in segregation of duties with respect to the activities actually performed by users. We have also developed a graphical representation depicting the relationships between transaction profiles. The intention is to identify activity
which may be indicative of financial fraud. The key contributions of this article are:
(i) A novel and simple fraud detection approach: Many current fraud detection approaches employ techniques and algorithms that are complex and difficult to comprehend such as neural networks and support vector machines. In this article, we propose a new and simple approach which focuses on the set of all transaction types performed by an individual user to detect potentially fraudulent activities. Each unique set of activities used to profile a user, over a period of time is called a transaction profile. Our approach is inspired by role mining approaches and so far, to our knowledge has never been used to detect fraud.
(ii) An automated and efficient fraud detection approach: Auditors and fraud examiners generally review audit logs to identify fraudulent transactions. With potentially billions of records especially in large organizations, reviewing audit records manually is a labor intensive and tedious task requiring time, effort and resources. Generally the legitimate transactions far outnumber the fraudulent ones; making them more difficult to identify, for example: in a dataset consisting of some 12 billion transactions per year, approximately 10 million or one in every 1,200 transactions turn out to be fraudulent (Hassibi 2000). On the other hand, whilst commercial fraud detection packages are automated and efficient, auditors require scripting capabilities and an understanding of the data mining functions to conduct effective audits.
In this work, we propose an automated and efficient fraud detection approach which automatically generates a list of the most interesting or potentially suspicious activities to help focus the auditor’s attention on a relatively small number of significant records. Automated fraud detection approaches provide a possibility of real time fraud detection which can be conducted continuously therefore identifying frauds as soon as they are perpetrated and reducing the overall financial losses and time to detect fraud.
(iii) Potentially detect previously unforeseen fraudulent activities: Most current approaches detect
certain types of frauds that are known or specific to a particular field. Typically these frauds or activities are defined using built-in rules developed by domain experts. We propose a novel unsupervised approach which flags both known and unknown types of activities that represent anomalies or potentially suspicious behavior and are of interest to auditors. Our proposed approach does not rely on classification or identification of fraudulent and/or non-fraudulent transactions in historical datasets.
(iv) Fraud detection context or application area: Most fraud detection research has been applied to and classified into three main areas: health care, including
medical insurance, credit card and telecommunications. In this work, we present a fraud detection approach for ERP systems. Fraud detection research has virtually never been applied to the context of ERP systems and in particular, to detect anomalies.
This article extends our work discussed in Khan et al. (2009). The next section articulates the related work in the area of fraud detection, role mining and anomaly detection. The article follows with a discussion of the proposed approach, using transaction profiles, in Section 3. An illustration of the proposed scenarios for identifying inadequate segregation of duties and of anomaly types for detecting anomalous behavior are presented in Sections 3.1 and 3.2 respectively. Next, the generation and implementation of a directed acyclic graph, showing relationships between transaction profiles is explained with the help of an example in Section 3.2.1. The experiments and a discussion of the results are presented in Section 4. The article concludes with a brief description on the current work and future directions.
2. RELATED WORK
Role mining approaches generate roles from existing permissions assigned to users. We have adapted a role mining approach for generating transaction profiles from the user activities recorded in an ERP system. We have derived a set of anomaly types that flag potentially suspicious activities from these transaction profiles. We also detect scenarios that identify violations in proper segregation of duties from the transaction profiles, based on the principles presented in Little and Best (2003). The next subsections discuss the related work in the literature.
2.1 Fraud Detection
Since financial frauds involving Enron, HIH and WorldCom, there is increasing legislative pressure on organizations of all sizes to adopt proactive fraud detection techniques. Fraud detection refers to the activity of proactively searching for or finding the indicators (also called symptoms or red flags) that suggest that fraud may be occurring (Albrecht et al. 2006).
Many organizations choose not to publicize their losses from financial fraud or even the fact that they have suffered some kind of fraud. This is mainly because they might lose the trust and confidence of their customers, investors and suppliers. Even if organizations do publicize their losses from financial frauds, they may not choose to share their detection strategies - as fraudsters might use this knowledge to develop fraud techniques which avoid detection. Although literature on major financial frauds and
yearly facts and figures on the total losses from financial frauds are available, detailed descriptions of detection techniques are not available.
Essentially, fraud detection approaches have been categorized into supervised, unsupervised or hybrid (that is, a combination of both the supervised and unsupervised approaches) (Bolton and Hand 2002). Supervised methods can only detect previously known or existing fraud cases and are unable to detect novel fraud attacks. Samples of both fraudulent and non-fraudulent patterns are required to construct models in order to assign observations into one of the two classes. Supervised methods have the problem of unbalanced class sizes, that is, the legitimate transactions far outnumber the fraudulent ones and this imbalance can cause misspecification of models (Bolton and Hand 2002). Examples of rule-based algorithms that use supervised methods include RIPPER (Cohen 1995) and C4.5 (Quinlan 1993).
Unsupervised methods do not require prior knowledge of fraud cases, they try to establish profiles of normal behaviour and any deviations from the profile are considered to indicate possibly fraudulent behavior. Observations most dissimilar to the norm are more likely to be fraudulent and anomalous, and can then be examined more closely. Unsupervised fraud detection methods have been researched in the detection of computer intrusion (typically employing profiling and anomaly detection techniques – discussed further in Section 2.3). In this paper, we propose an unsupervised fraud detection approach (see Section 3).
Link analysis and visualization techniques have gained popularity among fraud investigators (Cox et al. 1997). Link analysis explores the inherent relationships between a principal and other data represented within the dataset, using visualization, record linkage and social network methods. With the aid of powerful visualization tools such as i2 and Netmap, analyzing patterns and relationships in large datasets, with potentially billions of records, have also become more effective.
After reviewing over 50 published papers on fraud detection, over a period of ten years, Phua et al. conclude that only seven studies claim the implementation of a fraud detection system (Phua et al. 2005). Table 1 shows a summary of the seven studies including their application area, classification method, technique employed and a brief description of the approach. Our approach is most similar to Cortes et al. (2003) and Cox et al. (1997) as they have used graph structures to represent data, in order to detect potentially suspicious behavior.
Most fraud detection research has been applied in the context of health care, credit card or telecommunications fraud. Only a few studies have discussed fraud detection approaches in the context of ERP systems. Best et al.(2009)
Table 1: Summary of the 7 studies which have implemented a fraud detection system
propose a supervised methodology in which ERP security logs are extracted and analyzed to flag users who have performed a critical combination of transaction codes. The flagged records are then further examined by checking additional information from other system tables to determine whether a fraud has actually occurred (Best et al. 2009).
2.2 Role Mining and Segregation of Duties
Segregation of duty policies reduce the opportunities for fraud by ensuring that the separate transactions making up a sensitive combination of transactions, must be invoked by separate people (Kuhn 1997; Sandhu et al. 1999). If, for example, an individual has privileges to both authorize and execute transactions, it is possible for them to commit and cover fraud in their normal course of duties. Effective internal control structures require such privileges to be segregated at various levels within an organization. Weaknesses in segregation controls are common and often provide opportunities for fraud (KPMG 2006). Numerous guidelines and principles for the separation of duties have been proposed in the literature to prevent fraud (Srinidhi 1994; Haelst and Jansen 1997; Arens and Loebbecke 2000; Little and Best 2003).
In an ERP system, where hundreds or thousands of users may be performing activities, the only way to segregate duties is to assign roles and authorizations to
users which would prevent any one of them from performing incompatible combinations of transactions (Little and Best 2003). When so many ERP system users must be assigned their own individual access permissions, role engineering saves significant time and money while protecting data and systems (Coyne and Davis 2007). Role engineering is the process of identifying a set of roles that is complete and correct and to do so in an efficient manner (Coyne 1996). Synonyms of role engineering include role discovery, role finding and role characterization. Essentially there are two main approaches to role engineering: (i) the top-down approach and (ii) the bottom-up approach. Some authors have also discussed a combination of the two approaches, called a hybrid approach (Schaad et al. 2001).
In the top-down approach, business processes are carefully examined to identify job functions and their associated roles. Top-down approaches are mainly adopted by small enterprises where there are no existing roles or permissions assigned to individuals (Martin et al. 2003). Though the approach identifies groups of users who perform similar activities accurately, it is a costly, time consuming and tedious process to understand the semantics of the business processes especially in large organizations with millions of authorizations and thousands of users (Vaidya et al. 2008). Detecting financial fraud is a labor-intensive task requiring time, effort and resources for internal and external auditors, and having to perform role
Study Area Classification Technique Approach
(Major and Riedinger 1992) Medical insurance Supervised Expert systems
A five-layer knowledge/statistical based system which compares each observation with other similar observations. (Cox 1995) Medical insurance Hybrid Neural network, fuzzy logic
A fuzzy system which derives clusters and then identifies patterns using a classification approach. (Dorronsoro
et al. 1997) Credit card Unsupervised
Neural network
Use the nonlinear discriminant analysis neural model to separate fraudulent operations away from other similar to normal traffic.
(Ghosh and
Reilly 1994) Credit card Supervised
Neural network
A three-layer feed forward Radial Basis Function (RBF)-based neural network is used to create a fraud score for each new observation.
(Cortes et al. 2003) Telecomm-unications Unsupervised Dynamic graph structures
Use graph theory to visually determine communities of interest to detect call patterns among groups of customers.
(Cahill et al. 2002)
Telecomm-unications Hybrid Event driven
Each call is given an average suspicion score according to the extent to which it deviates from the normal signature and resembles the fraudulent signature. (Cox et al.
1997)
Telecomm-unications Unsupervised Visualization
Graphical displays (showing relevance by color, size and position) of calls between subscribers in different geographical locations.
mining using this approach would further extend the manual audit processes.
On the other hand, the bottom-up approaches derive roles from existing permissions assigned to users, with minimal human intervention. Most studies in the literature have proposed bottom-up role mining techniques as they automate the process of role discovery and are therefore more cost effective (Zhang et al. 2007). This approach is not likely to consider the business functions within an organization (Shin et al. 2003).
Schlegelmilch and Steffens (2005) present a bottom-up approach which uses hierarchical clustering to create a hierarchical tree of permissions and users which can be used to derive roles. Their algorithm first computes for each permission the number of users who have that permission and groups these users together in a cluster. In this initial step, each different permission is in its own cluster, meaning that each user may be a member of multiple clusters. Pairs of clusters are combined based on the maximal overlap of their user sets. Newly formed clusters contain the permissions of their child clusters and the set of users from the child clusters who have all permissions in this new cluster. The algorithm stops when no more clusters can be combined or when all permissions are combined into one root node. The algorithm does not derive roles, but a tree with users and permissions, although is the authors include a discussion on manually deriving roles from the tree.
Another bottom up approach, proposed by Vaidya et al. (2006) uses subset enumeration to derive roles from existing permissions. The algorithm intersects all possible combinations of permissions to derive roles. It starts by considering existing permissions assigned to users as roles, called initial roles. The intersections of these roles are then used to generate more roles, called generated roles. Further intersections of generated and initial roles are carried out until no new roles are generated (Vaidya et al. 2006). Our implementation of this algorithm discovered that an enormous number of roles are generated, and not surprisingly, that some of these were not allocated to any users. We believe that this approach would be impractical and time consuming for an auditor to use to detect anomalous activities.
Compared to Vaidya et al. (2006) and Schlegelmilch and Steffens (2005) work, our approach is more similar to Schlegelmilch and Steffens (2005). In their study they have suggested roles that are derived from existing permissions assigned to users. While in our approach we use subset-superset relationships to derive transaction profiles from the activities actually performed by users (see Section 3 for details).
2.3 Anomaly Detection and User Profiling
There has been a vast amount of literature published in the past 20 years on intrusion detection, a field of computer security that deals with computer and network attacks. Misuse or signature detection tries to identify known or encoded attacks in the form of a pattern and constantly monitors the system for the occurrence of these patterns, for example, frequent changes to a payroll file or attempts to read a password file. Examples of misuse detection in audit trails include state transition analysis (Ilgun et al. 1995) and Coloured Petri Nets (Kumar et al. 1994).
Typical anomaly detection systems profile the regular (also called standard or normal) behavior of a user, generally referred to as the profiling phase, and any deviation from this standard behavior, known as the
detection phase, is indicated as a possible intrusion or
anomaly (Lu et al. 2006). Once the deviations or anomalies are identified, the system generates an alert. Anomaly detection models can be capable of adjusting their detectors to keep up with the changes in user behavior to accurately detect suspicious behaviour (McCue 2007). They are also capable of detecting novel attacks but are expensive in terms of overhead, as they keep track of profiles and updates (Kruegel and Vigna 2003) and sometimes identify unusual but legitimate behavior as malicious, therefore generating a high rate of false alarms. Anomaly-based intrusion detection systems are derived from Denning’s (1987) original model. Denning developed an intrusion-detection system that gathered information from various audit logs/records to create historical profiles for users. These profiles are then compared with normal user activity and anomaly records are generated for deviations found. Activity logs were maintained to track actions if particular conditions were met and could also be used for updating profiles and generating reports (Denning 1987).
Statistical techniques have been commonly used for anomaly detection, for example, the Next-generation Intrusion Detection Expert System (NIDES) which monitors real-time activities of users by calculating various statistics. New observations are then correlated with the calculated profiles to flag any deviations (Valdes and Anderson 1994). Classification techniques along with association rules and frequent episode programs have been used by Lee and Stolfo (1998) to automatically detect anomalies in audit data. These data mining techniques are used to find patterns of system features that describe program and user behavior and a set of relevant system features are used to compute classifiers that identify anomalies (Lee and Stolfo 1998).
The use of neural networks for anomaly detection has also been popular. Ryan et al. (1997) used back propagation neural networks in a Unix environment, to construct user
profiles based on the type and frequency of commands performed. The system detects anomalies offline on daily logs, based on previously observed behavior (Ryan et al. 1998). Ju and Vardi (2001) used a Markov model to profile command sequences of each user. Their approach compares a user's command sequence to the users and others' estimated signature behaviors in real time, to detect anomalies (Ju and Vardi 2001). Some investigators have used clustering (k-means or other) approaches for preprocessing or reducing the data before applying Hidden Markov models for anomaly detection (Lane and Brodley 2003). Often clustering algorithms are applied on their own to detect anomalous behavior. Oh and Lee (2003) detect anomalies in audit trail data by profiling the transactions executed by the users. They propose a method of clustering the activities of transactions generated by a user and detect anomalies based on each users’ profiles (Oh and Lee 2003).
More recently, graph based approaches to detect anomalous activities have also been discussed. Graphical methods have been used to detect insider threats in business processes or scenarios such as document control and management systems (Eberle and Holder 2009). Likewise, our approach detects anomalous transaction types from audit data by generating a collection of directed acyclic graphs.
In the next section, we propose an approach which builds user profiles based on the types of transactions performed by the user recorded in the audit log. Similar to (Ryan et al. 1998), our approach operates offline and does not consider the sequence of commands performed.
3. TRANSACTION PROFILES
In this section we discuss our three main contributions. We have adapted a role mining approach for deriving transaction profiles. We use the term transaction profile (TP) to denote a set of distinct transaction types that one or more users have performed. A transaction profile may be associated with one or many users and each user is associated with exactly one transaction profile. Our work uses information recorded in security audit logs which record the transactions performed by the users of the system. ERP systems generally have role based control over which transactions a user is allowed to perform. Users are assigned one or many roles and they are allowed to perform any transactions in those roles, but different policies may mandate only one role at a time.
Problems can occur when a user changes their job function or is promoted, meaning that they are assigned a new role or set of roles. Often their previous roles are not revoked (Schlegelmilch and Steffens 2005). This accumulation of roles cannot be avoided in some cases
when an organization has only a small number of employees and these employees must take on many roles. Often in small organizations role segregation is difficult and users have more permissions than they require (Little and Best 2003). These situations can provide the opportunity for fraudulent activities when a user has access to roles that allow them to carry out all transactions required for those fraudulent activities. As an example, a user may have the necessary role permissions to create a vendor and to create orders and invoices for that vendor.
Even though a user has access to all transactions in their assigned roles, they may not use all of them. Therefore, two users who have the same roles assigned in the system may have quite different transaction profiles based on the transactions that they actually use. In our work, we ignore roles and focus on the actual transactions that users perform as recorded in the ERP security audit logs.
We now describe our approach to detecting transaction profiles which represent potential fraud situations; situations which represent inadequate segregation of duties or user activity which is anomalous.
3.1 Detecting Inadequate Segregation of Duties
We aim to detect users whose transaction profile contains conflicting or incompatible transactions that violate the principles of segregation of duties. We implement and test our approach using the theoretical framework for separation of duties presented by Little and Best (2003). They propose the following set of seven principles for General Ledger (GL), Accounts Receivable (AR) and Accounts Payable (AP) applications of an ERP system:
(i) Users who are given the authorizations to create and edit master records should not be able to enter transactions. (ii) Credit management activities and master record maintenance should be separate in AR.
(iii) Credit management and dunning (i.e. the process of collecting overdue receivables from customers) functions must be segregated from invoice and receipt data entry. (iv) Receipt data entry should be separate from credit memo and invoice data entry.
(v) In AP, cheques and payments must be performed by someone who is not entering vendor invoices.
(vi) Writing off AR as a bad debt must be segregated from receipt data entry.
(vii) User activities between GL, AP and AR should not cross boundaries.
We detect scenarios based on these principles to identify inadequate segregation of duties from transaction profiles discovered by processing the security audit log. The idea is to identify users whose transaction profiles have provided the opportunity to commit fraud.
3.2 Detecting Anomalous Activities
We also aim to detect users whose transaction profiles are anomalous when compared to other users, based on differences in transaction profiles discovered from processing the security audit log. We use the following types and notation:
u : a user identifier t : a transaction type
tp : a user transaction profile – a set of transaction
types
ug : the set of users associated with a particular tp UG : the set of all ugs
U : the user set - the set of all user identifiers TP : the set of all unique tps
We now describe three of the anomaly types which we aim to identify.
Anomaly Type 1. The idea behind this anomaly type is to
detect a small group of users who behave slightly differently to a large group of users by performing some small number of additional transaction types. The number of additional transaction types used to detect this anomaly type is set as a threshold value, ∆trans, e.g. three extra
transaction types, and the difference in the number of users with the two transaction profiles is likewise set as some threshold, ∆users, e.g., the small group could be one-tenth
of the number of users in the large group. The detection of transaction profiles of interest tpi can be expressed as follows:
Find tpi∈ TP, st ∀ tpj∈ TP,
tpi≠ tpj ∧
tpj ⊆ tpi ∧
|ugi| < |ugj|/∆users ∧
|tpi| - |tpj| < ∆trans (1)
Anomaly Type 2. We aim to detect transaction profiles
which have a large number of transactions that are being performed by a small number of users. For example: users may have accumulated many roles over the course of their employment in an organization. The number of users can be set with some threshold value, ∆users and the number of
transactions can be set with another threshold value, ∆trans.
These transaction profiles may represent the administrators of the system which would mean that the transaction profiles are not anomalous. The user threshold value could be set based on the known number of system administrators to reduce the number of false positives. This can be expressed as follows (note that the thresholds ∆users and
∆trans have a different significance here than in Anomaly
Type 1):
Find tpi∈ TP st
|ugi| < ∆users ∧
|tpi| > ∆trans (2)
Anomaly Type 3. A third type of anomaly is proposed
which will detect transaction profiles that are completely separate from all other transaction profiles i.e. transaction profiles where none of the transaction types in the transaction profile can be found in any other transaction profile. Users having these transaction profiles could be interesting to locate, simply because they share no transaction types with other users. The number of users with such a transaction profile is expected to be low.
Find tpi∈ TP, st ∀ tpk∈ TP,
tpi≠ tpk∧
tpi∩ tpk = { } (3)
Discussion. It may be noticed that detection of these
anomaly types relies on set relations between transaction profiles. The transaction profiles of interest in Anomaly Type 1 have a transaction set which is a slight superset of a transaction profile which is used by a large number of users. Anomaly Type 2 may arise because the set of transactions in the transaction profile of interest is the superset of transaction sets of multiple other transaction profiles. Anomaly Type 3 may occur when the transaction profile has a unique transaction set i.e. the transaction profile has no transaction supersets or subsets.
We propose to use a directed acyclic graph of transaction profiles to represent the subset – superset relationships. Directed edges connect transaction profiles from a parent vertex to a child vertex where the transaction type set in the parent is a proper subset of those in the child. A graph built from transaction profiles may have multiple roots. These root vertices will be transaction profiles with unique transaction sets, probably with a small number of transactions. Internal and leaf vertices in the graph may have one or many parent vertices. There may be vertices in the graph which are not connected at all and these will relate to Anomaly Type 3 above.
When the graph has been built, it can be traversed to detect the anomaly types discussed above and flag possibly fraudulent transaction profiles and their users. We suggest that it is necessary to have security log data from a system for a long period of time in order to reduce the number of false positives that the anomaly types may generate.
3.2.1 Generating the Transaction Profile Graph
Our approach uses set theory to profile user activities recorded in ERP security audit log files. Given a set of users and transaction types, in an ERP security log, our algorithm progresses in three phases as follows:
(1) User-transaction mapping: We firstly traverse the ERP security audit log, to map users to a set of transaction types that they have performed. For each user, a user-to-transaction type set mapping is generated.
Algorithm 1. Transaction profile generation 1. TP ← { } 2. UG ←{ } 3. for each ui ∈ U do 4. tpi← get_tp(ui) 5. if tpi ∈ TP then 6. ugi ← get_ug(tpi) 7. ugi← ugi∪ ui 8. else 9. TP ← TP ∪ tpi 10. ugi← {ui} 11. end if 12. end for
(2) Transaction profile generation: We next generate a set,
TP, of unique transaction profiles from the
user-to-transaction type set mappings, ui → tpi. Each distinct set of transaction types represents a transaction profile, tpi. Users who have the same transaction profile are grouped into a set ugi, associated with that transaction profile. We have a mapping from users to their transaction profiles:
get_tp : u → tp
and a mapping from transaction profiles to the set of users associated with that transaction profile:
get_ug : tp → ug.
The process of generating transaction profiles is presented in Algorithm 1.
(3) Deriving the transaction profile graph: A directed acyclic graph, G, is generated by this phase of the algorithm which has a set of directed edges, E, and a set of vertices, V, which represent the transaction profiles generated in Phase 2. A directed edge is connected from one transaction profile to another if the transaction set of the former is a proper subset of the transaction set of the latter. The final graph has a further restriction that a transaction profile will not have direct edges to a vertex which is a descendant of one of its children as these are redundant. The process of deriving the directed acyclic graph is presented in Algorithm 2.
The graph is initialized with a special null transaction profile, tpØ, which has an empty transaction set (Steps 1 to 3 of Algorithm 2). This root vertex therefore acts as a
parent for all transaction profile vertices that are added to the graph because it is a proper subset of all other transaction profiles and is present only for simplifying graph generation. This root vertex is ignored in all further calculations once the graph has been generated.
The remainder of the transaction profiles are added to the graph in order of the cardinality of the transaction set, |tpi|, in the transaction profile. Each transaction profile is tested to determine if transaction profiles currently in the graph have transaction sets that are proper subsets of the current transaction profile’s transaction set. If the subset relationship is discovered, an edge from the parent transaction profile in the graph to the current child transaction profile is added to the set of edges (Steps 4 to 13 of Algorithm 2). Once a full pass of transaction profiles has been made, redundant edges as mentioned above are removed. This is achieved by starting at the leaves of the graph and moving back to the root vertex of the graph checking for such edges (Steps 14 to 24 of Algorithm 2). There are more efficient algorithms in the literature for determining subset enumeration (Haixun et al. 2006) but our approach runs in polynomial time, O(n3).
Algorithm 2. Deriving the transaction profile graph Require: TP from Algorithm 1
1. G = (V, E) 2. V ← {tpØ} 3. E ← { } 4. for x = 1 to max(|tpi|) do 5.
for each tpi
∈
TP| |tpi| = x6.
for eachtpg ∈ V 7.
if tpg ⊆ tpi then 8.
E ← E ∪ (tpg, tpi) 9.
end if 10.
end for 11. V ← V ∪ tpi 12. end for 13. end for 14. for x = max (|tpi|) to 1 do 15.
for each tpi∈ V| |tpi| = x 16.
for each tpj∈ V| tpi⊆ tpj
17.
foreach tpg∈ V| tpg≠ tpi
∧
tpg≠ tpj18. iftpg⊆ tpj
∧
tpg⊆ tpi then19. E ← E - (tpg, tpj) 20.
end if 21. end for 22. end for 23. end for 24. end for
An example. Suppose the ERP security audit log of an
organization consists of six users (u1…u6) each of whom have executed a subset of five transactions (t1…t5) during a
certain period of time. In Phase 1 of our approach, a user-to-transaction type set mapping is generated for each user (see Table 2). Each distinct set of transaction types represents a transaction profile. It can be observed from Table 2 that users u1 and u4 perform the exact same set of transactions, meaning that they will belong to the same transaction profile. Table 3 shows the transaction profiles,
tp and ug generated by Phase 2 of our approach. We then
add transaction profiles as vertices in the graph based on the relationship between the sets of transaction types in the transaction profiles.
Table 2: User transaction mapping.
U T t1 t2 t3 t4 t5 u1 0 0 1 0 0 u2 0 0 0 1 0 u3 0 0 1 1 0 u4 0 0 1 0 0 u5 1 0 1 0 0 u6 0 1 0 0 1
Table 3: Transaction profiles and user sets. Transaction profiles tp ug tp1 {t3} {u1, u4} tp2 {t4} {u2} tp3 {t3, t4} {u3} tp4 {t1, t3} {u5} tp5 {t2, t5} {u6}
As tp1 and tp2 have the lowest number of transaction types in this example, they become the root vertices (depicted in Figure 1). We then continue to work through the remaining transaction profiles. Transaction profile tp3 has transactions t3 and t4, making tp3 a child vertex of tp1 and tp2. As transaction profile tp5 does not have any transaction types that have subset-superset relationships with transaction types in other profiles, it is represented as an isolated vertex. The remainder of the vertex relationships can be seen in the final graph generated by our approach as shown in Figure 1.
Figure 1: An example of a directed acyclic graph and an isolated vertex.
4. EVALUATION
This section describes the experiments conducted to validate the proposed approach. Two different datasets have been extracted from ERP systems to detect anomalies and inadequate segregation of duties. In the following subsections we describe the datasets, implementation and experimental results.
4.1 Dataset
Data from ERP systems, more specifically SAP R/3 systems was extracted for evaluating the approach. SAP R/3 is an integrated ERP system which offers modules for the various business functions in an organization. It has its own set of master records and configuration tables. Each user needs to enter a client number, a username and a password while logging on to the SAP system. After successfully logging in, each user accesses the same main menu for accounting, logistics, human resources as well as the security administration and configuration functions.
User roles and authorizations restrict user access to individual functions (which are identified using transaction codes) (Best 2006). Typically a transaction code comprises four or more alphanumeric characters that uniquely identify an activity. For example the transaction code to create a vendor invoice is represented as FB601. A user can only log on if a user master record with a password for that user has been created in the system. The scope of activity of each user in the system is defined in the user master record by one or many roles. The user authorizations, roles, type and personal data such as the address are recorded in the user master record (SAP 2007).
The security audit logs are stored in a binary format and can most easily be extracted using the reporting facility. Filters are used to define which events may be recorded in the logs. Information is only recorded in the audit files if the audit logs are turned on. An extract from the SAP R/3 security audit log is depicted in Table 4. It contains fields for the date and time of the user activity, client identifier, user identifier, transaction code, terminal name, message number and message text. The message number and message text fields of the log provide more details about the transaction performed.
Some activities in the SAP system do not have specific transaction codes, such as logon and logoff. These activities are represented by ‘session_manager’ or the absence of a transaction code. These particular transaction codes on their own do not add any value to a transaction profile and therefore have been excluded from our experiments. Their
1
Note that this transaction code is not always unique.
(tp2 = {t4}) (tp1 = {t3})
(tp3 = {t3, t4}) (tp4= {t1, t3})
Table 4: Extract from SAP R/3 security audit log.
inclusion to build richer transaction profiles with other information stored in system tables and/or the security audit logs, such as in (Best et al. 2009), is currently being studied and will be addressed in the future work, discussed in Section 5. Table 5 shows a summary of the datasets, excluding transactions ‘session_manager’ and those with no transaction code, and the users associated with only these two transaction types.
The two different datasets that have been extracted from the SAP system for evaluating our approach are: (i) a dataset hosted by our university for teaching purposes and (ii) a demonstration or training dataset used for testing the different business functions within an organization. Dataset 1 consists of 60,988 records of real activities performed by administrators, instructors and students over a period of 12 months. Student activities are based on tutorial exercises conducted during two semesters. Amongst the 490 users in Dataset 1, only 202 users had transaction codes recorded against their names. These 202 users have executed 584 different types of transactions (shown in Table 5). On the other hand, Dataset 2 is a demonstration environment that is accessible to SAP customers from different organizations for learning and training on the SAP system. It consists of 304,126 records performed by 106 users. Only 39 users had transaction codes recorded against their names. Data was extracted over a period of 6 days in which users performed 183 different types of transactions.
Table 5: Summary of the experimental datasets.
N o Datasets Total records Period of extraction Total users Total transa -ction types 1 University dataset 60,988 12 months 202 584 2 Demonstrat
-ion dataset 304,126 6 days 39 183
As Datasets 1 and 2 are extracted from student and demonstration systems, any anomaly types or inadequate segregation of duties scenarios identified do not represent fraudulent behavior. However, we consider these datasets appropriate for demonstrating the effectiveness of the proposed approach.
4.2 Implementation
Algorithms 1 and 2 have been implemented in Java and the results of the experiments are stored in a MySQL database. Figure 2 describes the implementation process of the proposed approach. The security audit log, user master record and the transaction types table are exported to text files from the options available in the SAP R/3 system’s user interface. All user activities are recorded in the security audit log, even when a user fails to logon to the system due to a mistyped username. A user can only log on successfully if a user master record for that particular user is present in the system. Mistyped transaction types are also
Figure 2: Implementation of the approach.
recorded in the log. A list of all valid transaction types in the system is stored in an SAP table and can be used to cleanse the transactions recorded in data set to ensure only meaningful information is being analyzed. In the first step, the audit log file is filtered to exclude invalid user ids and transaction types by checking if the user name exists in the user master record and the transaction type exists in the table. This filtration does not exclude: (1) users who have attempted to logon with a valid user id and an invalid password and (2) users who have attempted to perform a legitimate transaction that they do not have access to.
To protect the confidentiality of the users, the username and the terminal identifier fields of the log are anonymized. The filtered and anonymized text file is then used as input to Algorithm 1. For each user in the text file, a user-to-transaction type set mapping is generated to create
Date Time Cl. User Transaction code Terminal MNo Text
17.03.2008 11:54:32 600 233-063 EC01 fitgp-s623-206 AU3 Transaction EC01 Started
17.03.2008 11:54:32 600 233-063 EC01 fitgp-s623-206 AUW Report RSECOP01 Started
transaction profiles, which are required as input for Algorithm 2. Algorithm 2 then builds a directed acyclic graph based on the subset relationships between these transaction profiles. The parent-child vertex information from the directed acyclic graph is then stored in the database (depicted in Figure 2). Alerts or red flags are identified by running a set of SQL queries constructed for the various anomaly types and scenarios. The queries produce standard reports providing details of the red flags such as the transaction profiles, day and time of the activity, the anonymized users assigned to that transaction profile and the transaction codes executed.
Figure 3: Timings for generating the user transaction mapping.
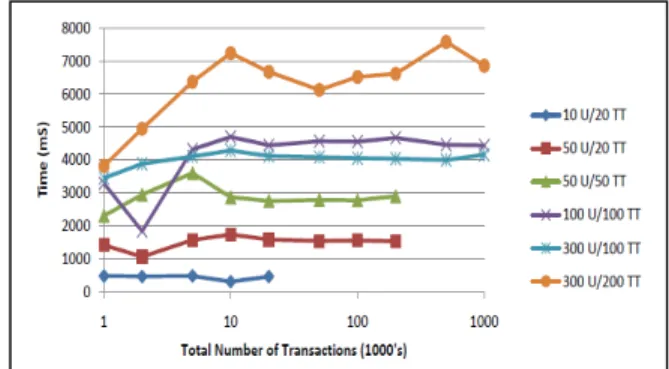
We conducted some analysis to determine the experimental time complexity of Algorithm 1 and 2. In order to compute the time complexity of the two main pieces of software, we generated synthetic log data with different combinations of the number of users and transaction types. The time required to produce the user-transaction mapping from the synthetic log was measured for various combinations of the number of users (between 10 and 300, (b) transaction types (between 20 and 200) and records in the log (between 1 000 and 1 000 000). The timings were recorded on a Pentium 4 computer with 4GB RAM, running Windows XP using Java 6 and MySQL Server 5.1.
Figure 4: Timings for generating the directed acyclic graph.
Figure 3 presents a graph of the time taken to generate the user-transaction mapping for the different configurations. It appears evident from the graph that the number of users (U) and the number of transaction types (TT) has only a minor impact on the time taken to produce the eventual mapping. The main impact on processing time is the total number of records in the log file. It can also be seen that the relationship between time and total number of transactions is almost linear, O(n).
Figure 4 depicts the time taken to generate the directed acyclic graph where the number of users (U), number of transaction types (TT) and total number of records in the synthetic log were varied. This step was undertaken after first generating the relevant user transaction mappings for the data set. While the total number of transactions provided the main impact on the time take for generating the user transaction mappings, it can be seen that this is not the case for generating the directed acyclic graphs. It appears that the main impact on the generation of the graph is the total number of transaction types in the transaction log.
4.3 Experimental Results
Once the datasets have been filtered and anonymized the algorithms generate a collection of directed acyclic graphs which would assist an auditor in visualizing the different groupings of transaction profiles in the dataset. Each visually disaggregated graph or grouping of transaction profiles contains related activities. In Dataset 1, the processing generated 9 disaggregated graphs with a total of 200 distinct transaction profiles. Table 6 shows the 9 disaggregated graphs or clusters, the depth of each graph and the number of transaction profiles and users in each graph. In order to give the reader an idea of the visual depth of each grouping or cluster of transaction profiles, we have included in Table 6 values for the number of levels in the graph. It can be observed that in Dataset 1 there are 4 graphs that have one or more levels and 5 graphs with no Table 6: Groupings of disaggregated graphs in Dataset 1.
Number of disaggregat -ed graphs Depth of each graph (in levels) Number of tp’s in graph Number of users in graph 1 4 178 179 1 1 2 3 1 1 10 10 1 1 5 5 5 0 1 1
levels i.e. these 5 graphs consist of single vertices. As a user can only belong to one transaction profile, there is no
overlap between users in different transaction profiles. It can be observed from Table 6, row one, that most users, that is 179 out of 202 in Dataset 1 belong to related transaction profiles. Also, all transaction profiles have one user each except two transaction profiles (in row one and two) which have two users each.
Table 7: Groupings of disaggregated graphs in Dataset 2. Number of disaggregat-ed graphs Depth of each graph (in levels) Number of tp’s in graph Number of users in graph 1 1 3 3 1 1 2 2 1 3 11 11 23 0 1 1
In Dataset 2 the processing generated 4 disjoint graphs with a total of 39 distinct transaction profiles. Table 7 shows a summary of the number of transaction profiles and users in each disaggregated graph. It can be observed that each transaction profile has only one user. As this dataset has fewer users and transaction types compared to Dataset 1, there are small groupings of transaction profiles. In Table 7, row four, it can be observed that there are 23 transaction profiles that do not have any connecting edges and are relatively different from the transaction profiles present in other directed acyclic graphs in Dataset 2.
The next subsections discuss the anomaly types and inadequate segregation of duties scenarios detected from these transaction profiles. The detailed discussion and implication of the results are presented in Section 4.4.
4.3.1 Detecting Inadequate Segregation of Duties
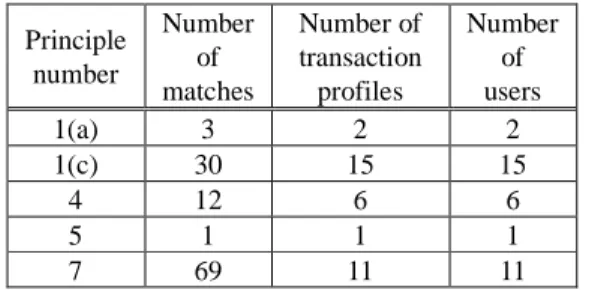
This section describes the results of the inadequate segregation of duties scenarios discussed in Section 3.1. Segregation violations are detected using SQL queries and reports are generated for any matches found. Table 8 shows the principle number, the exact number of matches found, the number of transaction profiles that contain incompatible transaction types and the number of users assigned to those transaction profiles in Dataset 1.
Principle 1 is split into (a), (b) and (c) for separation of transaction entry and master record maintenance for GL, AP and AR respectively. For Dataset 1, Table 8 shows that for principle 1(a) two transaction profiles, with one user each, have entered and posted GL transactions, and created, changed or deleted GL master records in the system. Most users (15 of them) have violated scenario 1(c), which detects users who have the authorizations to both maintain master records and post transactions in AR. From Table 8, (row 3) it can be observed that six users were flagged for
Table 8: Results of detecting inadequate segregation of duties in Dataset 1 Principle number Number of matches Number of transaction profiles Number of users 1(a) 3 2 2 1(c) 30 15 15 4 12 6 6 5 1 1 1 7 69 11 11
violating scenario 4, that is, these users have entered receipts, and posted credit memos and/or invoices. It might be interesting for an auditor to investigate these users as they could for example substitute a credit memo for a receipt in order to cover a theft of cash. The processing detected only one user breaching scenario 5. This particular user had performed transactions to post an invoice and process payments. These transactions must be segregated because an employee could for example: post a fictitious invoice and then pay it. Most matches (69 in total) were generated for scenario 7 which is segregation of transaction types across the GL, AP and AR activities.
Principles 1 (b), 2, 3 and 6 are not present in Table 8 as no students have performed the incompatible set of transaction types present in these scenarios. For Dataset 2, the queries did not detect any transaction profiles which contain conflicting or incompatible transaction types that violate the principles of segregation of duties.
4.3.2 Detecting Anomalies
In this section, we present the results of the three anomaly types described in Section 3.2. The results of Anomaly Type 1 are dependent upon the user and transaction threshold values. To see the effects of the variable transaction threshold values, we analyze the results by keeping the user threshold value steady. Anomaly Type 1 aims to detect a small group of users who have performed Table 9: Results for different transaction threshold values
of Anomaly Type 1 in Dataset 1. Transaction threshold value User threshold value Number of alerts 5 1 2 15 1 5 25 1 11 35 1 20 45 1 27 55 1 30
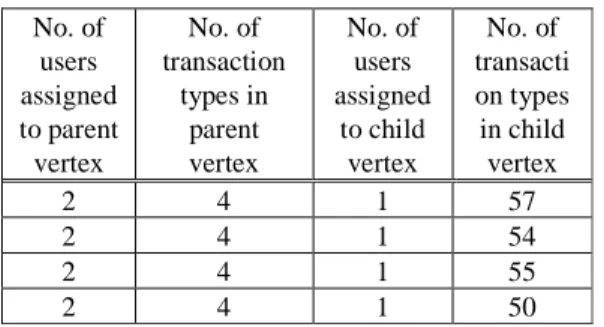
some additional transaction types compared to a large group of users. Table 9 shows the number of alerts generated for Anomaly type 1 in Dataset 1, for 6 different transaction threshold values and a steady user threshold value of 1. If the user threshold value is set to a value higher than 1, no alerts are generated because all 202 transaction profiles are assigned to one user each, except two transaction profiles which include two users. No alerts are generated if the transaction threshold value is higher than 55 (shown in the last row of Table 9). For an auditor or fraud examiner, these 30 alerts are perhaps the most interesting or potentially suspicious due to the large difference in the number of transaction types performed. Table 10: A sample of results for Anomaly type 1 in Dataset
1 if the transaction threshold value is set to 55. No. of users assigned to parent vertex No. of transaction types in parent vertex No. of users assigned to child vertex No. of transacti on types in child vertex 2 4 1 57 2 4 1 54 2 4 1 55 2 4 1 50
Table 10 presents a sample of the results (i.e. 4 out of 30 alerts) when the transaction threshold value is set to 55. It shows the number of users and the transaction types in the parent and child vertex. The four transaction profiles or child vertices shown in Table 10 have the same transaction profile as their parent vertex. As this anomaly type depends on the number of users in each transaction profile, for Dataset 2, no alerts were generated as each of the 39 transaction profiles have one user assigned to them.
Anomaly Type 2 aims to detect transaction profiles which have a large number of transactions that are assigned to a very small number of users. Table 11 shows the number of alerts generated for the different transaction threshold values for a steady user threshold value. For Dat- Table 11: Results for different transaction threshold values
of Anomaly Type 2 in Dataset 1. Transaction threshold value User threshold value Number of alerts 100 2 2 120 2 2 140 2 2 160 2 1 180 2 1
aset 1, the user threshold value was set to a value of 2 or less as each transaction profile consists of one or two users. When the transaction threshold value was set to 100, 120 or 140, the processing generated the same two alerts, which include: (1) one user who has performed 194 transaction types and (2) a user who has performed 142 transaction types (shown in Table 11). When the transaction threshold value was set to a higher value, i.e. 160 or 180, the processing flagged the transaction profile with one user who has performed 194 transaction types.
Table 12: Results of Anomaly Type 2 in Dataset 2 with a fixed user threshold value.
Transaction threshold value User threshold value Number of alerts 20 1 4 30 1 1 40 1 1
In Dataset 2, the user threshold value was set to a steady value of 1 as all transaction profiles have one user each. As Dataset 2 (see Table 12 for results) has less users and transaction types when compared to Dataset 1, if the transaction threshold value was set to a value higher than 40, no alerts were generated. The query generated the same alert when the transaction threshold value was set to 30 or 40. This alert may represent an anomaly as no users have performed more than 27 transaction types, except one user who has performed 48 different transaction types.
Table 13: Results of Anomaly Type 3 in Datasets 1 and 2.
Dataset Number of isolated vertices Lowest number of transactions/ profile Highest number of transactions/ profile Dataset 1 5 2 37 Dataset 2 23 1 25
Anomaly Type 3 detects cases where the set of transaction types in the profile are not present in any other transaction profile. Table 13 shows the number of isolated vertices (i.e. the transaction profiles that do not have any edges connecting them) and the highest and lowest number of transaction types in a transaction profile, for both Datasets 1 and 2. It can be observed from Table 13 that in Dataset 1, the cardinality of transaction types for the 5 isolated vertices is between 2 and 37. Similarly, in Dataset 2 the highest number of transaction types in a profile is 25 and these are not performed by any other user in the system. For both datasets, the lowest number of transaction types in a profile is values of 1 or 2. It might be interesting for an
auditor to investigate these users as they have only executed one or two transaction types in the system during the period for which the data has been extracted.
4.4 Discussion
In this section we discuss the results of our processing, presented in Section 4.3. The inadequate segregation of duties framework was presented by Little and Best (2003), but was not implemented or tested. We implement the seven principles as scenarios to detect transaction profiles that contain incompatible transactions and thus find the users who are assigned these transaction profiles. Table 8 in Section 4.3.1, presents the results of detecting inadequate segregation of duties in Dataset 1.
It can be observed that most users performed incompatible transactions violating scenario 1(c). Scenario 1(c) detects users who can create and modify master records and also post transactions in AR. On analyzing the flagged transaction profiles, we found that the 15 users had created and/or changed AR master records and also performed either one or combinations of invoice, receipt data entry and credit management transactions. It might be interesting for an auditor to investigate these users as they could for example: create a fictitious vendor master record and post a fake invoice to that vendor and have the system pay into their our personal bank account. Most matches were found for scenario 7, for which 11 users in the dataset were flagged. These users had performed transactions in all three functions: GL, AR and AP. The separation of duties in this scenario is necessary to provide a check against AR and AP through GL control accounts and to properly authorize the offsetting transactions between AR and AP.
The scenarios focus on detecting potentially fraudulent activities within the financial module of the SAP system and therefore the transaction types included in the scenarios are all related to financial activities such as changing bank details, creating invoices and making payments. No transaction profiles were flagged for violating the principles of segregation of duties in Dataset 2. This has been verified by manually checking the types of transactions present in the dataset. Most users in Dataset 2 have conducted activities related to the sales and manufacturing module.
For the anomaly types, the user and transaction threshold values depend on a number of factors such as the size of the organization, the size of the dataset and the period for which the data has been extracted. For Anomaly Type 1, the queries generate different number of alerts based on the transaction threshold value. It can be observed that the higher the threshold value the higher the number of alerts. No further alerts are generated if the transaction threshold value is greater than 55 (shown in the last row of
Table 9). This implies that the maximum difference in number of transaction types between two transaction profiles is less than or equal to 55 (more details presented in Table 10). It might be interesting for an auditor to investigate why the users in the child vertices have performed many more transactions than the users in parent vertex. The 4 alerts presented in Table 10 are the extremes, the other 26 alerts generated from the processing are interesting too but the difference in the cardinality of the transaction profiles is less i.e. between 8 and 40 transaction types. Our results for Anomaly Type 1 are restricted as Dataset 1 has only one user in each transaction profile, except two transaction profiles which have two users each.
For Anomaly Type 2, the processing generated 2 alerts: a user who has performed 194 transaction types and another user who has performed 142 transaction types (shown in Table 11). These alerts indicate potentially fraudulent user behavior and have been successfully identified by the anomaly definition. After manual analysis of the dataset, we found that both these transaction profiles with 194 and 142 transaction types are assigned to an instructor and a system administrator at our university. For Dataset 2, Anomaly Type 2 generated an alert for a user who had performed 48 different transaction types. As this user has been flagged from the anonymized demonstration dataset, we were unable to manually verify the anomaly. Perhaps, this user might be an administrator or an instructor who may have tested all the training activities before the trainees performed them.
For Anomaly Type 3, the results are interesting for both datasets. For example: for an auditor, it is interesting to investigate a user who has performed 37 different transaction types which no other user in the system has performed (shown in Table 13). Also, users who have performed only 1 or 2 transactions for the entire period are interesting to investigate as these users might be valid users who have left the organization, been on leave or perhaps changed their user id in the system. Or they might be synthetic user ids created by valid users to perform fraudulent activities.
As our fraud detection approach has been tested on a university and demonstration dataset, any anomaly types or inadequate segregation of duties scenarios identified do not represent fraudulent behaviour, but demonstrate the effectiveness of the approach. The datasets do not consist of a real company’s operational data, but they consist of real users, who behave differently and perform various transaction types. The results and the contributions of our work can also be verified in practice with access to real-operational data from an organization. Generally, in fraud detection research, datasets are unavailable and results are often confidential, making them difficult to assess (Bolton and Hand 2002).