Volume 14 | Issue 1 Article 15
5-1-2015
Applying Penalized Binary Logistic Regression
with Correlation Based Elastic Net for Variables
Selection
Zakariya Yahya Algamal
Department of Mathematical Sciences, Universiti Teknologi Malaysia, [email protected]
Muhammad Hisyam Lee
Department of Mathematical Sciences, Universiti Teknologi Malaysia, [email protected]
Follow this and additional works at:http://digitalcommons.wayne.edu/jmasm
Part of theApplied Statistics Commons,Social and Behavioral Sciences Commons, and the
Statistical Theory Commons
Recommended Citation
Algamal, Zakariya Yahya and Lee, Muhammad Hisyam (2015) "Applying Penalized Binary Logistic Regression with Correlation Based Elastic Net for Variables Selection,"Journal of Modern Applied Statistical Methods: Vol. 14 : Iss. 1 , Article 15.
DOI: 10.22237/jmasm/1430453640
Zakariya Algamal is a Ph.D student in the Department of Mathematical Sciences at Universiti Teknologi Malaysia. Email him at [email protected]. Muhammad Lee is Professor of Statistics in the Department of Mathematical Sciences at Universiti
Teknologi Malaysia. Email him at: [email protected].
Applying Penalized Binary Logistic
Regression with Correlation Based Elastic
Net for Variables Selection
Zakariya Yahya Algamal
Universiti Teknologi Malaysia Skudai, Johor, Malaysia
Muhammad Hisyam Lee
Universiti Teknologi Malaysia Skudai,Johor, Malaysia
Reduction of the high dimensional classification using penalized logistic regression is one of the challenges in applying binary logistic regression. The applied penalized method, correlation based elastic penalty (CBEP), was used to overcome the limitation of LASSO and elastic net in variable selection when there are perfect correlation among explanatory variables. The performance of the CBEP was demonstrated through its application in analyzing two well-known high dimensional binary classification data sets. The CBEP provided superior classification performance and variable selection compared with other existing penalized methods. It is a reliable penalized method in binary logistic regression.
Keywords: high dimensional, penalization, binary classification, correlation based penalty, LASSO, elastic net, ridge
Introduction
With advances in technology, data are becoming larger, resulting in high dimensional problems. One of these problems facing researchers in application is the number of variables p, exceeding the number of sample size n. In classical statistical theory, it is assumed that the number of observations is much larger than the number of explanatory variables, so that large-sample asymptotic theory can be used to derive procedures and analyze their statistical accuracy and interpretability. For high-dimensional data, this assumption is violated.
To overcome this challenge, various penalized methods have been proposed beginning with ridge penalty (Hoerl & Kennard, 1970). It estimates the regression
coefficients through 2-norm penalty. It is well known that ridge regression shrinks the coefficients of correlated predictor variables toward each other, allowing them to borrow strength from each other (Friedman, Hastie, & Tibshirani, 2010). The least absolute shrinkage and selection operator (LASSO) was proposed by Tibshirani (1996) to estimate the regression coefficients through
1 -norm penalty. While demonstrating promising performance for many
problems, the LASSO estimator does have some shortcomings (Zou & Hastie, 2005). Firstly, the LASSO tends to have problems when explanatory variables are highly correlated. Secondly, it cannot select more explanatory variables than the sample size.
Zou and Hastie (2005) proposed the elastic net penalty which is based on a combined penalty of LASSO and ridge regression penalties in order to overcome the drawbacks of using the LASSO and ridge regression on their own. Tutz and Ulbricht (2009) proposed correlation based penalty to encourage a grouping effect by using correlation between explanatory variables as weights through making a group of highly correlated explanatory variables to either be selected together or to left out altogether. Although this penalty does well when there is high correlation among explanatory variables, it doesn’t do as well when the correlation is perfect (Tan, 2012). This study applies a new penalized penalty proposed by Tan (2012), namely Correlation Based Elastic Penalty (CBEP), in penalized logistic regression, and compares it with elastic net, LASSO, and ridge penalties. We apply these four methods and test the classification performance on two well-known data sets.
This paper is organized as follows. Methodology covers the penalized logistic regression methods. Data description is explained in the following section. The second to last section is devoted to results and discussions. Finally we end this paper with a conclusion. All implementations are done using elasticnet package in R.
Methodology
Penalized Logistic Regression Methods
Logistic regression is considered one of the most important methods in several fields such as medicine, social science, and financial banking. It is widely used in binary classification problems, where the response variable has two values coded as 0 and 1. One of the problems that researchers face in applying logistic regression is the high dimensionality of the data, where the number of variables p,
exceeds the number of sample size n, in fields such as genomics, biomedical imaging, and DNA micro-arrays. Selecting an optimal subset of explanatory variables in order to improve the classification accuracy and to make the model’s interpretation easier is the main objective of the variable selection in high dimensional data (Pourahmadi, 2013). A procedure called penalization, which is always used in variable selection in high dimensional data, attaches a penalty term Pλ (β) to the log-likelihood function to get a better estimate of the prediction error by avoiding overfitting. Recently, there is growing interest in applying the penalization method in logistic regression models. In order to extract the most important explanatory variables in classification problems, a series of penalized logistic regression methods have been proposed. For example, Shevade and Keerthi (2003) proposed the sparse logistic regression based on the LASSO penalty. Similar to sparse logistic regression with the LASSO penalty, Cawley and Talbot (2006) investigated sparse logistic regression with Bayesian penalty. Liang et al. (2013) did another investigation in the sparse logistic regression model using a 1
2 penalty. There are varieties of different forms of the penalty
term, depending on the application requirements.
In a high dimensional classification using logistic regression, our goal is to classify the response variable y, which is coded as 0 and 1, from high dimensional explanatory variables xp . In general, in logistic regression, the response variable y is a Bernoulli random variable, and the conditional probability that y is equal to 1 given x, which is denoted as π (x), is
1
, 1, 2, , 1 j j x i ij j x e p y x x j p e
(1)
1 1 i, 1, 2, , i y y i i i f y i n (2)The likelihood will be
1 1 1 , i 1 i. n n y y i i i i i i L y f y
(3)
1 , log 1 log 1 n i i i i i i y y x y x
(4)The penalized logistic regression (PLR) is defined as
1 log 1 log 1 n i i i i i PLR y x y x P
(5)where λ is defined as a tuning parameter (λ ≥ 0). It controls the strength of shrinkage in the explanatory variables: when λ takes larger value, more weight will be given to the penalty term. Because the value of λ depends on the data, it can be computed using cross-validation method (James, Witten, Hastie, & Tibshirani, 2013). Before solving the PLR, it is worth centering to the y and standardizating to xj, so that 1 0 n i i y
, 1 1 0 n ij i X n
, and 2 1 1 n ij i X
forj = 1,2,…, p, in order to make the intercept (β0) equal zero. Many different forms
of the penalty term have been introduced in the literature, including ridge penalty, LASSO, elastic net, and correlation based penalty.
Ridge Regression
One of the most popular penalties is ridge regression, which was introduced by Hoerl and Kennard (1970) as an alternative solution to ordinary least square when there is multicollinearity between explanatory variables. The ridge regression solves the logistic log-likelihood in Eq. (4) using 2-norm penalized logistic
log-likelihood (i.e.,
2 1 p j j P
)
2 1 1 log 1 log 1 p n i i i i j i j PLR y
x y
x
(6)In ridge regression, the tuning parameter λ controls the amount of shrinkage, but never sets explanatory variable coefficients to be exactly equal zero. So, in high dimensional data when p > n, the ridge regression will not provide the sparsity model. Although ridge regression doesn’t have the sparsity property, it is preferred in high dimensional data because we expect high correlation between explanatory variables. The maximum likelihood solution of Eq. (6) is
2 1 ˆ arg min , p Ridge i j j y
(7)Least Absolute Shrinkage and Selection Operator
Tibshirani (1996) proposed the least absolute shrinkage and selection operator (LASSO), as a penalty for variables selection by setting some variable coefficients’ to zero. It does both continuous shrinkage and automatic variable selection simultaneously. As with the ridge regression the LASSO estimates are obtained by maximizing the log-likelihood. Instead of using 2-norm, the LASSO uses the 1-norm on the logistic regression coefficients (i.e.,
1 p j j P
). The penalized logistic regression using LASSO is
1 1 log 1 log 1 p n i i i i j i j PLR y
x y
x
(8)Depending on the property of the LASSO penalty, some coefficients will be exactly equal zero. Hence, LASSO does the variable selection. Consequently, LASSO has sparsity property. Although LASSO is widely used in many applications, it has some drawbacks. One of these drawbacks is that it is not robust to high correlation among explanatory variables and will randomly choose one of these variables and ignore the rest. Another drawback of LASSO is that in high dimensional data when p>n, it chooses at most n explanatory variables, whereas there may be more explanatory variable coefficients than n with non-zero values in the final model (Zhou, 2013). Solving Eq. (8) will depend on optimization methods. So,
1 ˆ arg min , p LASSO i j j y
(9) Elastic NetElastic net is a penalized method for variable selection, which is introduced by Zou and Hastie (2005) to deal with the drawbacks of LASSO. Elastic net tries to
merge the 2-norm and the 1-norm penalties, by using ridge regression penalty to deal with high correlation problem while taking advantage of LASSO penalty in variable selection property. The elastic net logistic regression is defined by
2 1 2 1 1 1 log 1 log 1 . p p n i i i i j j i j j PLR y
x y
x
(10)As we observe from Eq. (10), elastic net is dependent on non-negative two tuning parameters λ1, λ2 and leads to penalized logistic regression solution
2 1 2 1 1 ˆ arg min , p p . Elastic i j j j j y
(11)According to lemma 1 in Zou and Hastie (2005), to find the estimates of βElastic in Eq. (11), the given data set ( , )y X is extended to an augmented data (y X, )and is defined by
1 2 2 , ,1 2 1 , 0 n p p n p X y X y (12)As a result of this augmentation the elastic net can be written as a LASSO penalty and solved. Hence, the elastic net can select all p explanatory variables in the high dimensional when p > n and not only n explanatory variables as in the LASSO, because X has rank p.
Correlation Based Penalty
Similar to elastic net, this penalty encourages a grouping effect by using correlation between explanatory variables as weights. This penalty is proposed by Tutz and Ulbricht (2009), their contribution is to make a group of highly correlated explanatory variables to be either selected together or to left out altogether. Tan (2012) reported that although the elastic net penalty does well when there is high correlation among explanatory variables, it doesn’t do well when there is perfect correlation. An extension of the correlation-based penalty to deal with this drawback was made in elastic net penalty. The penalty is defined as
1
2 2 1 2 , 1 1 1 1 p p j j j j j p j j P r
(13)where rj, j+1 is the correlation between xj and xj+1. The penalized logistic regression
using this penalty and the estimate of βCBEP be, respectively
1 1 2 2 1 2 , 1 1 1 1 log 1 log 1 n i i i i i p p j j j j j p j j PLR y x y x r
(14)
1
2 2 1 2 , 1 1 1 1 ˆ arg min , p p CBEP i j j j j j p j j y r
(15)CBEP is reduced to LASSO like elastic net after applying augmentation to the original data set for different values of λ2.
Data Set Description
To evaluate the four used methods, two binary classification microarray data sets are used: colon tumor data set and diffuse large B-cell lymphoma (DLBCL) data set. The colon tumor microarray data set describes the expression of 2000 genes in 40 tumor and 22 normal tissue samples, the aim being to construct a classifier capable of distinguishing between cancer and normal tissues. This set is described
in Alon et al. (1999), and publicly available at
http://genomics-pubs.princeton.edu/oncology/affydata/index.html. For the DLBCL data set, the gene expression values of 77 samples were measured by high-density oligonucleotide microarrays of the two most prevalent adult lymphoid malignancies which 58 samples of diffuse large B-cell lymphomas (DLBCL) and 19 samples of follicular lymphoma (FL). Each sample contains 7,129 gene expression values. More information on this data can be found in Shipp et al. (2002) and it is freely available at http://www.genome.wi.mit.edu/cgi-bin/cancer/datasets.cgi. To apply the binary classification using the four methods that we are considered, the type of the response variable for each data set is coded as a 0 and 1, where in colon data the normal equals 0 and tumor equals 1, while in
DLBCL data, FL is set to code 0 and DLBCL is set to code 1. The classification function is defined as I y
ˆ 0.5
.Results
To examine the performance of the correlation based elastic penalty we compare it with three well-known penalization methods; elastic net, LASSO, and ridge. We use a randomly drawn test data set. Each data set at hand was split into 10%, 20%, and 30% to form the test data set, respectively. This procedure is repeated 100 times. The required tuning parameters by the ridge, LASSO, elastic net, and CBEP methods were performed by 10-fold cross-validation on the training data set. Specifically, for ridge and LASSO, the tuning parameter was λRidge = 5.460, 3.197, 5.590) and λLasso= (0.055, 0.091, 0.068) for each training data set respectively. For the tuning parameters of elastic net and CBEP, the solution is different, because these two methods require prior value of λ2 to
transform the original training data set to the new augmented training data set. A sequence of values for λ2 is given, where 0 ≤ λ2 ≤ 100. For each value of λ2 a
10-fold cross-validation was performed to select the remaining tuning parameters. Here the best value for λ2 is 0.01 for colon data set and 0.025 for DLBCL data set.
Therefore, the tuning parameters for elastic net are (0.30, 0.15, 0.40) and (0.50, 0.40, 0.30) for colon and DLBCL data sets corresponding to each percentage of test data set, and for CBEP are (0.40, 0.30, 0.38) and (0.60, 0.50, 0.35) for colon and DLBCL data sets corresponding to each percentage of test data set.
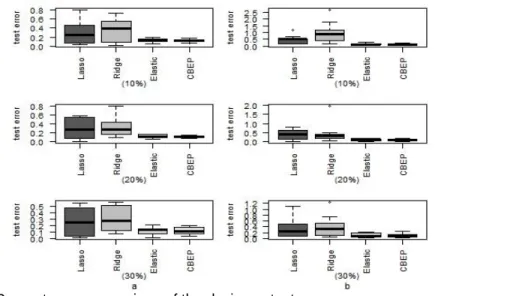
The deviance test error is computed as the criterion of evaluation. Figure 1
displays the corresponding boxplots of the deviance test error for the four used methods for both data sets, (a) colon tumor and (b) DLBCL. It is clear that CBEP has less variability among the three penalization methods. Also, it can be seen that LASSO and ridge are more variable than CBEP and elastic net. Table 1
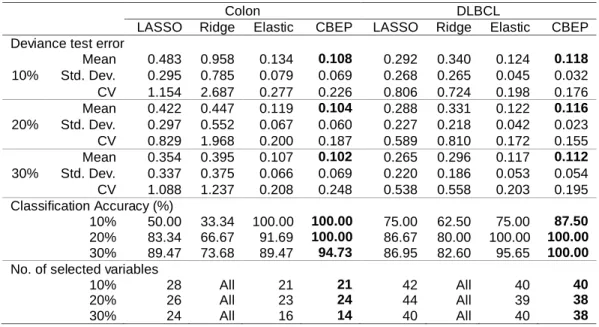
summarizes the averaged deviance test error (Mean) and the standard deviation (Std. Dev.) of the estimation of the response variable. Furthermore, coefficient of variation (CV), classification accuracy, and the numbers of selected variables are listed. When the sample size of the test set increases, the mean of the deviance test error decreases for the CBEP and the other three methods in both data sets. For example, in colon data the means for CBEP are 0.108, 0.104, and 0.102 with the sample size of the test set 10%, 20%, and 30% respectively.
Concerning the deviance test error, we observed that for colon and DLBCL data the CBEP method has mean with standard deviation smaller than the results
of the elastic net, LASSO, and ridge for all test set sizes. For example, in DLBCL data, when the test data size is 10%, the mean of the CBEP is 0.118 with standard deviation equal to 0.032, which is smaller than 0.124 (0.045), 0.340 (0.265), and 0.292 (0.268) for the elastic net, ridge, and LASSO methods respectively. With both data sets and test set sizes, the results of CV show that the CBEP method yields less variation than the other three methods. Furthermore, we see that the CBEP method outperforms the elastic net, LASSO, and ridge for both colon and DLBCL data sets in term of accuracy classification. It can even classify with accuracy of 100% for colon data set at percentage 10% and 20% of test set, and also for DLBCL data set at 20% and 30% percentages of test set.
In terms of the number of selected variables (model complexity), the penalized logistic regression using CBEP includes explanatory variables less than using elastic net, although in some cases CBEP includes variables same as elastic net. Moreover, LASSO selects more variables than CBEP and elastic, and of course penalized logistic regression using ridge includes the whole explanatory variables. Because of several correlation coefficients among explanatory variables above 0.5, we have seen that the CBEP and elastic net methods prevail against the LASSO.
It is obvious that the CBEP method performs better in term of averaged deviance test error by obtaining smaller values of deviance error, classification accuracy, and the number of selected variables followed by elastic net, LASSO, and ridge for various percentages of test data sets for both colon and DLBCL data sets.
Table 1: Deviance test error, classification accuracy, and no. of variables selected over 100 random split
Colon DLBCL
LASSO Ridge Elastic CBEP LASSO Ridge Elastic CBEP Deviance test error
10% Mean 0.483 0.958 0.134 0.108 0.292 0.340 0.124 0.118 Std. Dev. 0.295 0.785 0.079 0.069 0.268 0.265 0.045 0.032 CV 1.154 2.687 0.277 0.226 0.806 0.724 0.198 0.176 20% Mean 0.422 0.447 0.119 0.104 0.288 0.331 0.122 0.116 Std. Dev. 0.297 0.552 0.067 0.060 0.227 0.218 0.042 0.023 CV 0.829 1.968 0.200 0.187 0.589 0.810 0.172 0.155 30% Mean 0.354 0.395 0.107 0.102 0.265 0.296 0.117 0.112 Std. Dev. 0.337 0.375 0.066 0.069 0.220 0.186 0.053 0.054 CV 1.088 1.237 0.208 0.248 0.538 0.558 0.203 0.195 Classification Accuracy (%) 10% 50.00 33.34 100.00 100.00 75.00 62.50 75.00 87.50 20% 83.34 66.67 91.69 100.00 86.67 80.00 100.00 100.00 30% 89.47 73.68 89.47 94.73 86.95 82.60 95.65 100.00
No. of selected variables
10% 28 All 21 21 42 All 40 40
20% 26 All 23 24 44 All 39 38
30% 24 All 16 14 40 All 40 38
Finally, Figure 2 displays the path solution of the CBEP and elastic net for the colon tumor data set of 70% training data set in one run. The doted horizontal line represents the best value of elastic net (s = 0.40) and CBEP penalty (s = 0.38) that selected by cross-validation. The figure also shows, the elastic net path is very similar to CBEP path.
Conclusion
A study of a new penalization method based on CBEP was done by application to binary logistic regression. Three penalization methods in addition to CBEP, including elastic net, LASSO, and ridge, were compared by applying two high dimensional real data sets. The results show that the CBEP outperforms the other three methods in term of deviance test error, classification accuracy, and model complexity. Also, the different percentages of the test data size do not affect the performance of CBEP. It was concluded the CBEP is more reliable in applying penalized binary logistic regression.
References
Alon, U., Barkai, N., Notterman, D. A., Gish, K., Ybarra, S., Mack, D., & Levine, A. J. (1999). Broad patterns of gene expression revealed by clustering analysis of tumor and normal colon tissues probed by oligonucleotide arrays. Proceedings of the National Academy of Sciences, 96(12), 6745-6750. doi:10.1073/pnas.96.12.6745
Cawley, G. C., & Talbot, N. L. C. (2006). Gene selection in cancer classification using sparse logistic regression with Bayesian regularization. Bioinformatics, 22(19), 2348-2355. doi:10.1093/bioinformatics/btl386
Friedman, J., Hastie, T., & Tibshirani, R. (2010). Regularization paths for generalized linear models via coordinate descent. Journal of Statistical Software, 33(1), 1-22.
Hoerl, A. E., & Kennard, R. W. (1970). Ridge regression: Biased estimation for nonorthogonal problems. Technometrics, 12(1), 55-67.
doi:10.1080/00401706.1970.10488634
James, G., Witten, D., Hastie, T., & Tibshirani, R. (2013). An introduction to statistical learning. New York: Springer.
Liang, Y., Liu, C., Luan, X. Z., Leung, K. S., Chan, T. M., Xu, Z. B., & Zhang, H. (2013). Sparse logistic regression with a L-1/2 penalty for gene selection in cancer classification. Bmc Bioinformatics, 14, 1-12.
doi:10.1186/1471-2105-14-198
Pourahmadi, M. (2013). High-dimensional covariance estimation: with high-dimensional data. Hoboken, New Jersey: John Wiley & Sons.
Shevade, S. K., & Keerthi, S. S. (2003). A simple and efficient algorithm for gene selection using sparse logistic regression. Bioinformatics, 19(17), 2246-2253. doi:10.1093/bioinformatics/btg308
Shipp, M. A., Ross, K. N., Tamayo, P., Weng, A. P., Kutok, J. L., Aguiar, R. C., ...Golub, T. R. (2002). Diffuse large B-cell lymphoma outcome prediction by gene-expression profiling and supervised machine learning. Nature Medicine, 8(1), 68-74. doi:10.1038/nm0102-68
Tan, Q. E. A. (2012). Correlation adjusted penalization in regression analysis. PhD. dissertation, The University of Manitoba, Canada. Retrieved from
http://mspace.lib.umanitoba.ca/handle/1993/9147
Tibshirani, R. (1996). Regression shrinkage and selection via the lasso. Journal of the Royal Statistical Society. Series B (Methodological), 58(1), 267-288.
Tutz, G., & Ulbricht, J. (2009). Penalized regression with correlation-based penalty. Statistics and Computing, 19(3), 239-253.
doi:10.1007/s11222-008-9088-5
Zhou, D. X. (2013). On grouping effect of elastic net. Statistics & Probability Letters, 83(9), 2108-2112. doi:10.1016/j.spl.2013.05.014
Zou, H., & Hastie, T. (2005). Regularization and variable selection via the elastic net. Journal of the Royal Statistical Society: Series B (Statistical