2
Energy Agreements Programme
HVAC Special Working Group
Report
The Use of Energy Performance Indicators (EPIs)
in HVAC Systems
Prepared by - Donall O’Brien
Industrial Utilities Ltd.
3
E
XECUTIVES
UMMARYThe various spins of the HVAC SWG has highlighted the significance of the impact of HVAC systems to the overall energy intensity of the site. The HVAC SWG Spin II Report for 2009 has shown that HVAC can be responsible for up to 80% of some facilities energy bill. The importance of having metrics to compare and challenge energy consumption in HVAC systems is therefore of immense importance. The HVAC SWG Spin I report states that “It was found during the site audits that only 35% of the participating companies had overall EPIs to monitor the energy performance of their HVAC systems”. It is therefore of imense importance to assist companies in the development of EPI’s to effectively manage the energy consumption of this energy intensive service.
Various suggested energy performance indicators were explored in the report. There is a lot of potential information available on site to monitor performance but very rarely will one system of indicators provide the full picture of the energy efficiency of the HVAC system. Measurement of fan consumption on a HVAC system whether its specific fan consumption or a totalised figure will not give an indication of anything other than the efficiency of distributing air through the system. Likewise degree day analysis will only address thermal heating or cooling loads on a building/system. Unfortunately there is no “silver bullet” solution for EPI’s that will allow HVAC systems to be compared on a single indicator due to the huge variation in size and complexity of HVAC systems. For most HVAC energy end-users, it will be a case of selecting EPI’s that give as much information as possible on the efficiency of their HVAC system with the minimum effort in terms of the engineering/facilities team resource input. For most facilities this will undoubtedly mean the selection of a few key EPI’s which will address the major energy streams and back-up the EPI’s with an operational control check of the systems and equipment. The operational control check will not give a number which can be graphed periodically like a numerical EPI but will allow an operator to make an assessment of the energy performance of the system based on his/her knowledge of the systems and knowledge of where their optimum performance should be.
2
C
ONTENTS
EXECUTIVE SUMMARY ... 3! 1.0! INTRODUCTION... 3! 1.1! BACKGROUND... 3! 1.2! OBJECTIVE OF REPORT... 3! 1.3! METHODOLOGY... 3!2.0! ENERGY PERFORMANCE INDICATORS (EPIS) ... 4!
2.1! EPIDEFINITION... 4!
2.2! PROS AND CONS OF EPIS FOR HVAC ... 4!
3.0! HVAC SYSTEMS – ENERGY SERVICE REQUIREMENT & ENERGY FLOWS ... 5!
3.1! HVACENERGY SERVICE REQUIREMENT... 5!
3.2! ENERGY FLOWS IN HVACSYSTEMS... 6!
4.0! ENERGY PERFORMANCE INDICATORS – SUGGESTED ... 8!
4.1! SPECIFIC FAN CONSUMPTION... 8!
4.2! TOTALISED FAN CONSUMPTION... 8!
4.3! DEGREE DAY ANALYSIS... 8!
4.4! INDEPENDENT ASSESSMENT OF UTILITIES FEEDING A HVACSYSTEM... 9!
4.4.1! Consumption of Utilities by System... 9!
4.4.2! Efficiency or COP of Utility System ... 9!
4.5! SUMMARY OF COMPLEXITIES ASSOCIATED WITH HVACEPI’S... 11!
5.0! SELECTION OF A SUITE OF OPTIMUM EPIS ... 11!
5.1! STRATEGY FOR SELECTING APPROPRIATE EPI’S FOR HVACSYSTEMS... 11!
5.2! REASONS FOR NON-COMPLIANCES... 15!
5.3! CONTINUOUS IMPROVEMENT... 15!
3
1.0
I
NTRODUCTIONThe Energy Agreements Programme, launched in May 2006, is aimed at the largest energy users interested in taking a strong, strategic and systematic approach to energy management. Firms agree to implement the new Irish Energy Management Standard, IS 393, and to pursue an aggressive programme of energy efficiency action and investment. In return, SEAI offers relationship support, advice, networking and some financial supports.
As an initiative within the Energy Agreements Programme, SEAI have launched Special Working Groups which are formed by groups of member companies in conjunction with SEAI. A programme of work is determined by the Group which may consists of shared studies, self-assessments, identification of energy saving projects, grouped special investigations, published guidelines and recommendations to the wider group of Energy Agreements participants. The Special Working Groups focus on a particular area of technology or a special interest of energy management system implementation.
The HVAC Working Group Spin III was launched in August 2009. This report is one specific output from the HVAC SWG Spin III scope of work.
1.1
Background
The use of Energy Performance Indicators (EPI’s) to evaluate energy efficiency is a key requirement of EN 16001 and EPI’s are widely used to evaluate energy consumption at Macro levels in almost all industrial facilities. EPIs have proven quite easy to implement at macro level where for example units produced versus overall energy consumption may be trended over a specific time. EPI’s are also very successfully used for utility system performance but haven’t been used successfully for HVAC systems.
The HVAC SWG Spin II Report for 2009 has shown that HVAC can be responsible for up to 80% of some facilities energy bill when HVAC utilities are taken into consideration. The importance of having metrics to compare and challenge energy consumption in HVAC systems is therefore of immense importance. The HVAC SWG Spin I report states that “It was found during the site audits that only 35% of the participating companies had overall EPIs to monitor the energy performance of their HVAC systems”. It is therefore of imense importance to assist companies in the development of EPI’s to effectively manage the energy consumption of this energy intensive service.
1.2
Objective of Report
The objective of this report is to document the various approaches that could be employed to aid in the development of EPI’s to monitor the efficiency of HVAC systems. The report also aims to suggest a procedure whereby energy managers can conclude which EPIs are the best fit for their application.
1.3
Methodology
The methodology for generating this report was to brainstorm possibilities with members of the Special Working Group panel of consultants and review the existing information available on EPI’s before compiling a report on the findings.
4
2.0
E
NERGYP
ERFORMANCEI
NDICATORS(EPI
S)
2.1
EPI Definition
An Energy Performance Indicator (EPI) is a standard or point of reference against which comparisons can be made. It is a valuable tool, through the process of benchmarking, for assessing energy performance, allowing the comparison of the performance of similar facilities, systems or equipment to be carried out.
2.2
Pros and Cons of EPIs for HVAC
An EPI for a HVAC system will facilitate the comparison of the performance of the HVAC system against historical performance of that system or may even allow the benchmarking of the system against similar HVAC systems.
The most significant challenge associated with developing EPI’s for HVAC systems is the fact that HVAC systems vary considerably in design intent and in the delivery of the energy service requirements from system to system. Some HVAC systems may be as simple as unit heaters required to heat a large space or may be as complex as a system which controls air changes, fresh air, temperature, humidity and room pressure. In addition, the EPI may vary greatly within a single AHU system depending on ambient or space conditions. As a result it is rare that AHU systems can be compared globally in a similar fashion to for example Chilled water system COP.
5
3.0
HVAC
S
YSTEMS–
E
NERGYS
ERVICER
EQUIREMENT&
E
NERGYF
LOWS3.1
HVAC Energy Service Requirement
The energy service requirement is the term given to the core requirement for a HVAC system. This can vary depending on the nature of the space being conditioned or the requirements of the product being manufactured in the space. Different energy service requirements may include some or all of the following:
• Ventilation – The provision of fresh air to a space in order to satisfy a legislative, comfort, process or building fabric protection requirement. • Ventilation & Filtration – The provision of partial fresh air in a
re-circulated system which allows the supply air to be subjected to filtration. • Heating – Heat can be added to a space in many ways, radiators, direct
gas fired unit heaters or more commonly for industrial applications duct/AHU mounted heating coils using steam or low pressure hot water as a heating medium.
• Cooling- Space cooling is predominantly achieved with a duct/AHU mounted cooling coil using chilled water as the cooling medium however direct Expansion (DX) units are also used.
• Dehumidification- Dehumidification is often a processing requirement of some rooms where excessive moisture can affect quality. Dehumidification can be achieved by cooling air to below its dew-point in conventional cooling coils or by passing the air through a desiccant dehumidification wheel. Dehumidification is an energy intensive step in a HVAC system as the air often has to be pre-conditioned and post conditioned after the dehumidification step to bring the supply air back to the required temperature conditions.
• Humidification – Humidification may be required in rooms where a tolerance exists on the humidity in a space. Humidification is required in such spaces when cool ambient outdoor air is heated thereby reducing the RH of that air. Moisture is added in typically by injecting steam or a mist at the outlet of the supply AHU. Humidifiers can be direct steam injection, indirect steam, gas-fired or electrical.
• Pressure Profile – The setup of a Pressure profile is a method of safeguarding against the infiltration of unwanted particulate or vapours into a space which may have a specific cleanliness requirement or a hazardous area classification. The safeguarding is accomplished by maintaining the critical space at a higher air pressure to the surrounding spaces thereby guaranteeing the flow of air from the critical space outwards and reducing the risk of infiltration. A reverse profile could also be setup to ensure product containment in the conditioned space.
6
3.2
Energy Flows in HVAC Systems
The flows of energy in a HVAC system vary with the complexity of the HVAC energy service. The energy flows into HVAC systems can vary from electricity into a ventilation fan to a series of electrical, thermal heating and thermal cooling energy flows. The energy flows associated with the condition of the ambient air introduced into a system and the energy content of exhausted air must be considered.
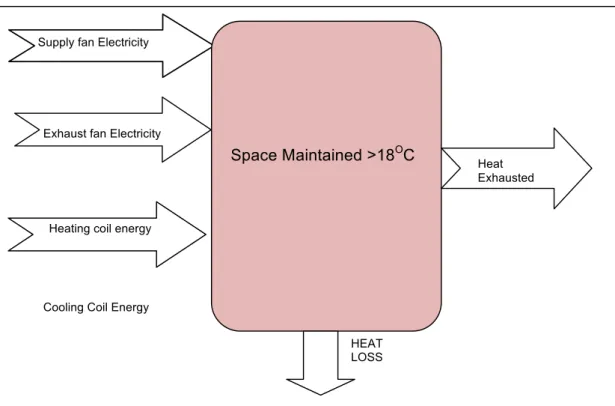
Example 1 – Simple HVAC system with supply fan, heating and exhaust Fan
Fig. 3.1 Energy Flows in a simple Heated and ventilated space
Example 1 above shows the energy inputs into a very simple heating and ventilation only HVAC system similar to what may be seen in any typical production space which has an air-change and fresh air requirement, a minimum temperature requirement but does not have an upper limit on temperature. The energy inputs are therefore electricity in to the fans and the heat input for space heating. There is also an energy source from the fresh air which may have a heating or cooling effect on the space depending on the ambient conditions.
Supply fan Electricity
Exhaust fan Electricity
Heating coil energy
Cooling Coil Energy
Space Maintained >18OC
HEAT LOSS
Heat Exhausted
7
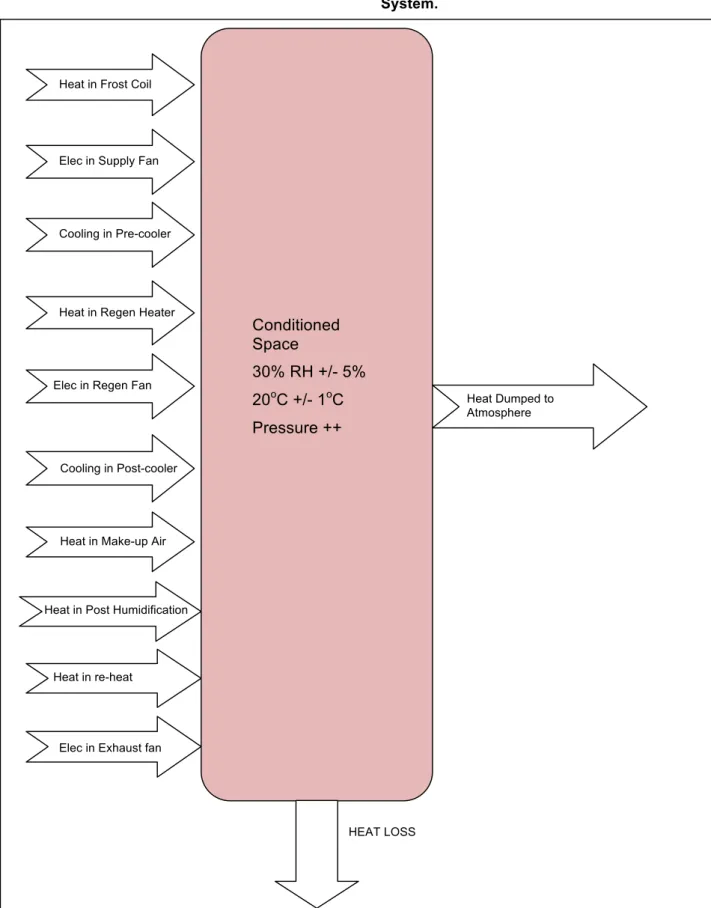
Example 2
Humidity Controlled, temperature controlled, Air Pressure Controlled Cleanroom HVAC System.
Fig. 3.2 – Complex Energy Inputs to Cleanroom HVAC System
Heat in Frost Coil
Elec in Supply Fan
Elec in Regen Fan Heat in Regen Heater Cooling in Pre-cooler
Cooling in Post-cooler
Heat in Make-up Air
Heat in re-heat
Heat in Post Humidification
Elec in Exhaust fan
Conditioned Space 30% RH +/- 5% 20oC +/- 1oC Pressure ++ Heat Dumped to Atmosphere HEAT LOSS
8
4.0
E
NERGYP
ERFORMANCE INDICATORS–
S
UGGESTEDThe diagrams shown in Fig 3.2 and 3.3 above show how the level of complexity can differ with HVAC systems which makes it difficult to have EPI’s which suit all HVAC applications. A sensible set of EPI’s for Example 1 may be to record kWh electrical energy per week and kWh heat input per week. Systems like that shown in Example 2 are however much more complex and would require multiple energy streams to be evaluated. There are however a number of indicators which can be applied to specific elements of HVAC systems which can help put more visibility on overall system performance.
4.1
Specific Fan Consumption
Specific Fan Consumption (SFC) is a measure of fan electrical input versus volume of air delivered to the HVAC space. Specific Fan Consumption for a fan on a HVAC system can be calculated from the measured power input over the measured air flow produced. This can be done on a continuous basis or on a totalized basis for daily or weekly intervals. A spot check of Specific fan consumption can be carried out if fixed instrumentation does not exist for example on annual revalidation.
Tracking Specific Fan Consumption can show how filters getting blocked over time affects power consumption and can be used as a tool to decide on the optimum time to replace filters.SFC can also show up anomalies for example if a filter became damaged or detached.
4.2
Totalised Fan Consumption
Totalised fan consumption is a simple indicator of the kWh consumption by fans in a HVAC system over a time period (generally weekly or monthly). The additional benefit of the totalised figure is of particular importance in systems that are not running 24/7. If HVAC systems are being shut down during non-production times (or in the case of administration buildings at nights and weekends), then the specific fan consumption will not highlight inefficiencies associated with poor timekeeping of the HVAC systems. This EPI is also useful in systems that may not have an air-flow meter but has electrical meters on the fans (possibly in the form of kWh totaliser on the supply fan).
4.3
Degree Day Analysis
Degree day analysis is a method of assessing the performance of a building or HVAC system in terms of the heat consumption relative to the ambient temperature. Heating degree days are a measure of the severity and duration of cold weather. The heating degree day analysis hinges on selecting the base external temperature above which the building or HVAC system does not require heating typically 15oC to 18oC depending on insulation and the rate of internal heat generation. Degree day data can be obtained from Met Eireann. The sum of the degree days over periods such as a month or an entire heating season is used in calculating the amount of heating required for a building or HVAC
9 system. Degree Days are also used to estimate air conditioning usage during the warm season.
4.4
Independent Assessment of Utilities feeding a HVAC System
After fan energy consumption, the next energy users which are required to be tracked are the utilities that feed a HVAC system to provide conditioning of the air which is circulated by the fans. When looking at utilities, evaluation must take place from two approaches. Firstly the consumption of utilities gives the amount of that utility which was used by the HVAC system (kWh), and secondly the efficiency of the generation of that utility (COP Boiler efficiency etc) will give the relative cost in terms of electricity or thermal fuel source input.
4.4.1 Consumption of Utilities by System
The ability of a site to track the consumption of utilities will be determined by the level of metering installed on the applicable systems. In many cases thermal utility metering can be more expensive to install than electrical meters due to the fact that many parameters have to be measured to capture energy or heat flow. For example, metering heat input to a HVAC system may require the metering of hot water flow, the temperature of that hot water at supply and the temperature that the hot water returned from that HVAC system. Hot water may be used in that HVAC system at multiple different points which may not be orientated in a manner that would allow all points to be captured with one metering device. Users may decide to take a more macro approach if metering is not sufficient to allow individual utility metering of a HVAC system - for example, if there is a dedicated hot water system feeding HVAC systems in general the energy into that Hot water system may be metered. The total thermal energy consumption for the HVAC systems can then be sub-divided across the individual systems empirically if required.
Examples of utility consumption EPIs that may be used for HVAC systems are as follows:
• Gas/Steam/Hot Water per week/month or heating degree day analysis • Chilled Fluid Consumption per week/month
• Chiller Energy v Cooling Degree Days
• Boiler Consumption versus Heating Degree Days
• Dehumidifier Electricity/Gas consumption per Week/Month • Humidifier Electricity/Steam/Gas consumption per Week/Month
4.4.2 Efficiency or COP of Utility System
Tracking energy efficiency of utility systems using EPIs is extremely important whether the utilities are for HVAC consumption or otherwise. In HVAC systems the majority of energy consumption associated with utilities is for heating and cooling. Steam, Hot Water and Chilled water systems are generally the utilities which require analysis.
10 generation of steam can be an important EPI. There are various losses or inefficiencies associated with Steam systems including:
o Combustion inefficiencies
o Standing losses
o Blowdown losses
o Steam distribution loss
o Condensate losses
o Flash steam losses
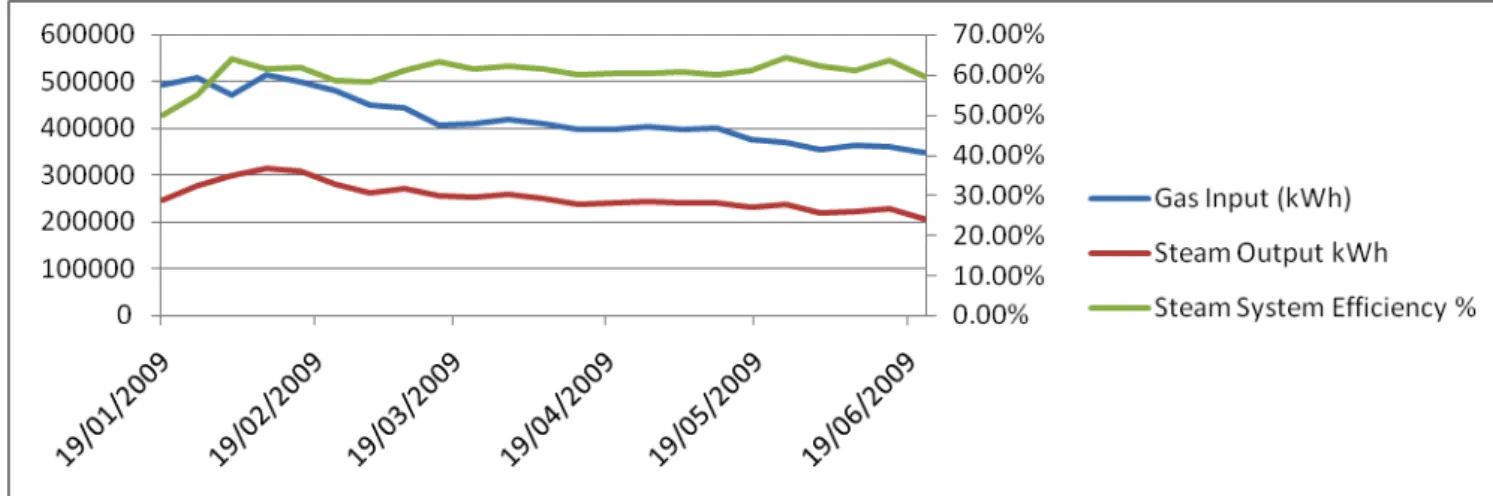
Very often the simplest way of getting an overall efficiency reading for steam is to meter the fuel input to the boiler and meter the steam usage (preferably by summing all end users). HVAC heating may be one or more of the major users. A weekly or monthly reading for totalised fuel consumption and totalised steam consumption can be used to calculate system efficiency. This EPI may highlight in particular losses during periods of low steam production when boilers may be cycling on and off. Other items that can show up would be steam traps passing or issues with condensate return.
Fig 4.1 Weekly logging of Steam System Efficiency as an EPI
Hot Water System Efficiency
In a similar fashion to steam system efficiency, overall hot water system efficiency can be monitored by metering fuel input and heat delivered to the users. The heat delivery will need to be calculated from flow, supply temperature and return temperature, either on the BMS or from a proprietary heat metering device.
Chilled Fluid System Efficiency (COSP)
The system coefficient of performance (COSP) for a chilled water loop gives a figure for the thermal energy usage over the energy input into generation and distribution of the chilled water. It is important to have the power consumption of the distribution pumps included if possible as recent SEI findings from the 2008 Refrigeration SWG report has shown that mismatches between cooling loads and distribution energy input was one of the biggest contributors to poor COSP’s
11 in industrial applications. In order to monitor COSP therefore the following energy readings will be required:
o Chiller/Refrigeration system electrical input
o Chilled Water distribution pumps electrical input
o Ancillary power users electrical input (Cooling tower water pumps dedicated to chillers, Cooling Tower Fans)
o Chilled water thermal usage – again this can be one heat metering point across the main supply & return headers or totalised heat meters across users.
Chilled water COSP’s have been shown to vary considerably across different systems for similar temperature fluids from values as low as 1.5 and up to 8. If COSP cannot be monitored due to a requirement for multiple metering points for electrical consumption in chilled water pumps then the base COP for the system should be monitored. COP can be calculated from thermal usage divided by electrical input to the chiller/refrigeration system.
4.5
Summary of Complexities associated with HVAC EPI’s
As can be seen from the various suggested indicators above there is a lot of potential information but very rarely will one system of indicators provide the full picture of the energy efficiency of the HVAC system. Measurement of fan consumption on a HVAC system whether its specific fan consumption or a totalised figure will not give an indication of anything other than the efficiency of distributing air through the system. Likewise degree day analysis will only address thermal heating or cooling loads on a building/system. Unfortunately there is no “silver bullet” solution for EPI’s that will allow HVAC systems to be compared on a single indicator due to the huge variation in size and complexity of HVAC systems. For most HVAC energy end-users, it will be a case of selecting EPI’s that give as much information as possible on the efficiency of their HVAC system with the minimum effort in terms of the engineering/facilities team resource input. For most facilities this will undoubtedly mean the selection of a few key EPI’s which will address the major energy streams and back-up the EPI’s with an operational control check of the systems and equipment. The operational control check will not give a number which can be graphed periodically like a numerical EPI but will allow an operator to make an assessment of the energy performance of the system based on his/her knowledge of the systems and knowledge of where their optimum performance should be.
5.0
S
ELECTION OF A SUITE OF OPTIMUMEPI
S5.1
Strategy for Selecting Appropriate EPI’s for HVAC Systems
A practical approach to selecting EPIs would be to firstly evaluate the existing meters and the information that they produce. The level of existing information in many cases is of a sufficient standard to allow meaningful EPI’s to be generated. The addition of strategic meters can increase the level of information available substantially for a relatively small investment. For example, the addition of a heat
12 in determining the performance of HVAC systems.
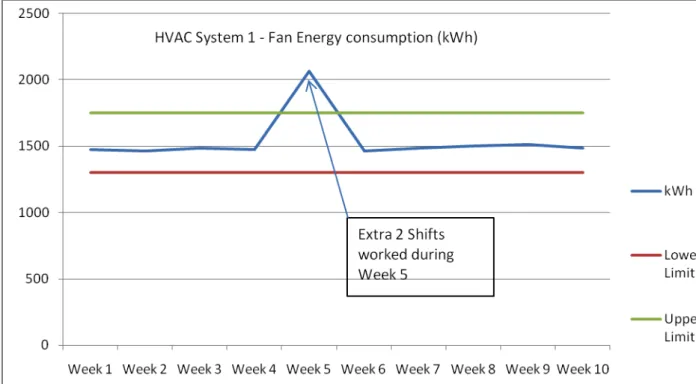
Once the level of existing metering available (or metering available following investment) the EPI’s possible can be selected. Consideration should be given at this point to the time and effort required to extract the EPI data. Only significant energy users should be pursued if the system is to be robust and user friendly. The last step in achieving a set of meaningful EPI’s is to set upper and lower limits to the EPI. For example for a simple EPI for kWh fan power consumption in a week the following may apply:
Fig. 5.1 Trending an EPI on a weekly basis with action limits.
The same would apply for any of the EPI’s set whether it is Chilled Water COSP, Hot Water System Efficiency, Specific Fan Consumption etc.
When action limits are in place they can be altered as the systems change. Higher efficiencies can be strived for for example to meet best practice for certain EPI’s.
13 Fig. 5.2 The flowchart above shows the process for generating sensible EPI’s for a HVAC system which starts with the review of existing metering.
14
15
5.2
Reasons for non-compliances
There are many reasons for non-compliances which would manifest themselves in the form of a breach of the upper or lower limit of the EPI which is not attributable to an explainable event. The most common reasons for non-compliances would be
• Incorrect operation
• Equipment Failures
• Poor Control
5.3
Continuous Improvement
Continuous improvement should be strived for with any system and therefore the system must be continuously challenged to ensure it is fit for purpose. As systems evolve with improvements the EPI limits can be changed to reflect the improvements made to the system – e.g. if air change reductions are made to a HVAC system, fan kWh consumption will reduce significantly and the limits will need to be changed. Likewise heating, and cooling consumption will drop. It is important that EPIs are flexible and that the control limits can be altered without too much sign off or approval. Changing the reporting system should be easy enough to encourage change and to allow operators of the HVAC systems to challenge the status quo, increasing performance even if a change to limits is required.
15
6.0
C
ONCLUSIONSIt has been shown that industrial HVAC systems are a very varied and are a complex system to monitor from an energy usage or energy performance point of view. This is due to the many different energy consumption steps which can exist and the different factors which affect energy consumption in a HVAC system. Having a single parameter which indicates energy performance is extremely difficult or impossible for most situations. In order to get an appreciation for the relative efficiency of different HVAC systems in a facility therefore requires multiple EPIs to be used in most cases. This should be backed up with an operational control check of the system. The EPIs most applicable to the specific HVAC system should be selected based on the energy consumption information that can be easily obtained from the system and which gives a good picture of the system performance for minimal operator/engineer time input.