2016
High-throughput phenotyping of above and below
ground elements of plants using feature detection,
extraction and image analysis techniques
Nigel Lee
Iowa State University
Follow this and additional works at:https://lib.dr.iastate.edu/etd
Part of theAgricultural Science Commons,Agriculture Commons,Agronomy and Crop Sciences Commons, and theComputer Sciences Commons
This Thesis is brought to you for free and open access by the Iowa State University Capstones, Theses and Dissertations at Iowa State University Digital Repository. It has been accepted for inclusion in Graduate Theses and Dissertations by an authorized administrator of Iowa State University Digital Repository. For more information, please [email protected].
Recommended Citation
Lee, Nigel, "High-throughput phenotyping of above and below ground elements of plants using feature detection, extraction and image analysis techniques" (2016).Graduate Theses and Dissertations. 15953.
by
Nigel Lee
A thesis submitted to the graduate faculty
in partial fulfillment of the requirements for the degree of MASTER OF SCIENCE
Major: Mechanical Engineering Program of Study Committee:
Baskar Ganapathysubramanian, Major Professor Soumik Sarkar
Patrick Schnable
Iowa State University Ames, Iowa
2016
DEDICATION
I would like to dedicate this thesis to
Dr. Baskar Ganapthysubramanian
For being my major professor and mentor since my first semester in Iowa State Uni-versity and for providing me with the opportunity to be work with him and be in his team. I
could not have made it this far without his support and guidance
My Parents and family
For supporting me to study overseas and to continue on with my Master’s
My Fourth Uncle
For providing me with the opportunity of studying in the United States and looking out for me while here
Jia Yin
TABLE OF CONTENTS
DEDICATION ... ii
ACKNOWLEDGEMENTS ... iv
ABSTRACT ... v
CHAPTER 1: BRIEF OVERVIEW OF PLANT PHENOTYPING METHODS ... 1
Introduction ... 1
References ... 3
CHAPTER 2: BELOW GROUND PHENOTYPING ... 4
Analysis of Maize (Zea mays L.) Seedling Roots with the High-Throughput Image Analysis Tool ARIA (Automatic Root Image Analysis) ... 4
Abstract ... 4
Introduction ... 5
Results ... 9
Discussion ... 13
Materials and Methods ... 17
Conclusion ... 19
References ... 20
CHAPTER 3: ABOVE GROUND PHENOTYPING ... 23
Fast, automated identification of tassels: Bag-of-features, graph algorithms and high throughput computing ... 23 Abstract ... 23 Introduction ... 24 Methods ... 28 Workflow Deployment ... 35 Conclusion ... 42 References ... 43
ACKNOWLEDGEMENTS
I would like to use this opportunity to express my heartfelt gratitude to those who had made this possible for me. The main person who had made all this possible would be Dr. Baskar Ganapathysubramanian who had been my major professor and mentor since my first semester at Iowa State University as an undergrad. He provided me the opportunity to work with him and to be part of his research group. His insights and his support since then has al-lowed me to learn far more than I was expecting.
I would also like to extend my thanks to my committee members for taking the time and making the effort to assist me with my work whenever possible even though they are busy with their own work.
I would like to acknowledge and thank all of my collaborators and colleagues in our journey to find intellectual answers together. I acknowledge the assistance and advice pro-vided by my colleagues and the extensive data collection performed by Jordon Pace from the Agronomy Department, and Dr. Patrick Schnable and his team over at the Plant Science In-stitute.
ABSTRACT
Plant phenotyping is now being widely used to study and increase the yield of row-crop plants. Phenotyping is defined as a set of observable characteristics of an individual that results from its interaction of its genome with the environment. Therefore, the collection of physical and observable traits is the primary task of any phenotyping study. While current phenotyping methods are painstakingly slow and tedious, advances in digital imagery and computer technology have unlocked new avenues for this arduous task. High-resolution im-ages can now easily be obtained with practically any camera whereas improvements in com-puter technology mean that images taken can be processed at a shorter time.
Phenotyping generally can be classified into two categories, below ground phenotyp-ing and above ground phenotypphenotyp-ing. Below ground phenotypphenotyp-ing typically pertains to roots or parasites that are in the soil. The study results from below-ground phenotyping are of the root system architecture of a plant or the cause and effect of below ground parasites. Above ground phenotyping encompasses more variety of traits which includes flowers, fruits, leaves and more. This thesis discusses a computational platform for rapid phenotyping of two prob-lems: root phenotyping and maize flower phenotyping. Both of these phenotyping studies involved collaborative works with a plant science group.
The first phenotyping platform was intended for a study of seedling root traits, which offer an opportunity to study Root System Architecture of a plant without having to wait for the plant to be fully grown. A framework was developed that would take root images and output traits of the plants using image segmentation and graph-based algorithms. The frame-work can also be extended easily to any another kind of roots. The input to the frameframe-work
would just be a picture of a root with great contrast to the background, and the program would output the traits out in a simple and easily understandable manner. The ease of use not only means that phenotyping can be done in a very time, cost and labor efficient manner, but also just about anyone could use the program.
The next phenotyping platform was intended to extract phenotyping traits of maize tassels. On field, time series images from two different plantings were provided by the Plant Science Institute for the development of the framework. The planting consisted of nearly four thousand different genotypes. The developed framework could identify the object of interest (the tassels) and analyzed it using image analysis techniques and deployed on the ISU super-computer, CyEnce. Utilizing feature detection and extraction along with segmentation meth-ods, the tassel location could be identified and separated from the background. Then, graph-based techniques and morphological operations were used to extract the various traits of the tassels. By plotting the extracted traits, the growth, and development of the maize tassel over time could be seen and further studied. This framework is also easily extendable to other types of above ground phenotyping. However, due to the nature of having feature detection, significantly more dataset is needed for training the detection algorithm.
This thesis will illustrate how the combination of high-performance computers, image analysis, and machine learning are ushering a revolution in the field of agriculture. The fact that computer processing speed are almost doubling every 18 months provides access to new methods that were not possible before. Just as the landscape of technology is constantly be-ing innovated, phenotypbe-ing studies will ensure that the field of agronomy not be left behind.
CHAPTER 1: BRIEF OVERVIEW OF PLANT PHENOTYPING
METHODS
Introduction
Plants are without a doubt an important part of the human life. Plants provide us with food, fuel, fibers, medicine and the most crucial, oxygen. Most plants typically have an above ground element as well as an underground element. Above ground elements are typically associated with fruits, leave and stems while below ground elements are associ-ated with root systems. Both elements are equally important in the growth and develop-ment of the plant. Therefore, to understand a plant, both eledevelop-ments has to be understood just as well, and the method of understanding could be achieved through plant phenotyp-ing.
Plant phenotyping is defined as a set of observable characteristics of an individual that results from its interaction of its genome with the environment. Examples of some direct measurement parameters include root system architecture and morphology, fruit and leaf characteristics as well as yield-related traits [1]. To obtain those traits, current methods involve hand-measurements. A good example would be using a ruler or thread to measure the length of a root. This is tedious, slow and very inefficient. This would also mean that any large-scale phenotype project would not be feasible regarding both cost and resource sense. However, due to recent improvements in image and computer tech-nology, high-resolution images are now easily accessible. These images can then be fed to a computer for analysis. Moreover, improvements in computer technology mean that phenotyping methods can easily be semi-automated if not automated completely. As an
example, feeding an image of a root through a program can almost immediately output the traits of that root.
In the field of plant phenotyping, it generally can be divided into two categories. The first being below ground phenotyping while the other is above ground phenotyping. Below ground phenotyping typically involves roots traits because there are potentially extensive genetic variations in root architecture. Root system architecture varies greatly not just between species but also within species depending on the genotype and environ-ment [2]. Due to the nature of root systems being below ground, research studies are more difficult if compared to above ground elements. Current research methods for be-low ground phenomics study involve a method called shovelomics, which is the act of digging a plant up from the ground and measuring its traits [3].
Shovelomics tend to be very destructive as there is no prior knowledge of how ex-tensive the root system prior to digging. Therefore, in this thesis, it is believed that grow-ing seedlgrow-ings root in hydroponics would be able to provide the similar if not same, genet-ic and phenotyping traits that would be seen in a grown plant. Using seedlings also means that there is no need to wait for the plant to be fully grown and the use of hydroponics would ensure that the roots would not be damaged upon extraction for imaging. Chapter 2 of this paper will elaborate the work done on below ground phenotyping.
On the other hand, above ground phenotyping includes more extensive categories. These categories differ greatly between plants. As an example, the flower of an apple tree is different from the flower from a tomato plant. Therefore, research into a certain plant cannot be directly applied to another. Nonetheless, studies on above ground elements are
significantly easier than studies on roots as above ground elements can be visually seen. Nonetheless, phenotyping with above ground images has its challenge. The color of soil as the background may not change much, but images taken with the sky as the back-ground has many variations not only depending on the time of day as well as the weather. Therefore, above ground phenotyping programs would have to involve training data for feature extraction if it were to be automated for trait extraction. Chapter 3 will go into detail about the methods for about ground phenotyping.
Chapter 4 will conclude the discussion made in this thesis. The conclusion will provide an overview of the contributions, implications and future avenues of the frame-work developed in this thesis.
References
[1] Plant phenotyping [(accessed on 10 October 2014)]. Available online: www.plantphenomics.com.
[2] Lynch J. 1995 Root architecture and plant productivity. Plant Physiol. 109, 7–13. doi:10.1104/pp.109.1.7
[3] Pace J., Lee N., Naik H. S., Ganapathysubramaniam B., Lübberstedt T. Analysis of Maize (Zea mays L.) Seedling Roots with the High-Throughput Image Analy-sis Tool ARIA (Automatic Root Image AnalyAnaly-sis). PloS ONE. doi: 10.1371/journal.pone.0108255.
CHAPTER 2: BELOW GROUND PHENOTYPING
Analysis of Maize (Zea mays L.) Seedling Roots with the
High-Throughput Image Analysis Tool ARIA (Automatic Root Image
Analysis)
Modified from a paper submitted to PLOS One
Jordon Pace, Nigel Lee, Hsiang Sing Naik, Baskar Ganapathysubramanian, Thomas Lübberstedt
Abstract
The maize root system is crucial for plant establishment as well as water and nutrient up-take. There is substantial genetic and phenotypic variation for root architecture, which gives opportunity for selection. Root traits, however, have not been used as selection cri-terion mainly due to the difficulty in measuring them, as well as their quantitative mode of inheritance. Seedling root traits offer an opportunity to study multiple individuals and to enable repeated measurements per year as compared to adult root phenotyping. We developed a new software framework to capture various traits from a single image of seedling roots. This framework is based on the mathematical notion of converting images of roots into an equivalent graph. This allows automated querying of multiple traits simp-ly as graph operations. This framework is furthermore extendable to 3D tomography
im-age data. In order to evaluate this tool, a subset of the 384 inbred lines from the Ames panel, for which extensive genotype by sequencing data are available, was investigated. A genome wide association study was applied to this panel for two traits, Total Root Length and Total Surface Area, captured from seedling root images from WinRhizo Pro 9.0 and the current framework (called ARIA) for comparison using 135,311 single nucle-otide polymorphism markers. The trait Total Root Length was found to have significant SNPs in similar regions of the genome when analyzed by both programs. This high-throughput trait capture software system allows for large phenotyping experiments and can help to establish relationships between developmental stages between seedling and adult traits in the future.
Introduction
The maize (Zea mays L.) root is designed to provide anchorage as well as to se-cure uptake of water and nutrients, including nitrogen (N), in an efficient manner [1], [2]. Maize roots are formed partly during embryonic and partly during post-embryonic devel-opment [3]. There are five main types of roots in maize: crown, seminal, primary, lateral, and brace roots [4]. The major portion of root biomass of mature plants is derived from postembryonic, shoot-borne roots. These postembryonic roots include crown roots, formed below soil surface, and brace roots, formed above soil surface [5]. Their function is important to plant performance as they are responsible for the majority of water and nutrient uptake in maize [5].
Two to three week old seedling root systems are made up of primary roots, lateral roots, seminal roots, and root hairs [4], [6]. Lateral roots branch outward from the
prima-ry root. These root types are called the axial roots and determine root architecture. Lateral roots increase the surface area of the root system and all root types contribute to water and nutrient uptake [2], [7], [8]. Moreover, lateral roots contain root initiation points, leading to secondary, tertiary, and higher order root structures, with major influence on the overall root architecture of the root stock [2].
There is extensive genetic variation in root architecture. However, root traits have not been considered by plant breeders to select for improved nutrient uptake efficiency or yield improvement due to the difficulty in measuring root traits and their quantitative mode of inheritance [9]. Studying adult roots using maize “shovelomics”, a high-throughput phenotyping technique that measures adult root traits, is time consuming and laborious. This method of phenotyping is also destructive because roots are dug out of the ground. This limits the number of experiments that can be completed in a season [10]. Changes in maize root architecture may strongly affect yield [11]. Seminal roots play a key role in the acquisition of immobile and mobile nutrients such as phosphorus and ni-trogen respectively and can determine spatial and temporal domains of its environment and inter-root competition [6]. The relationship between seminal root biomass in hydro-ponics and root lodging in a field study focusing on root strength and pulling resistance has been explored. Respective correlations were low, but statistically significant. Correla-tions found in hydroponic seedling root traits compared to adult field traits were r = 0.44* for shoot weight and adult plant height, and r = 0.22* for lateral root length with brace root development [12], [13].
Seedling phenotyping takes less time, is less laborious, and can be repeated many times during the year allowing for quicker turnover of results. Positive but low correla-tions were found between maize seedling and adult root traits, such as number of seminal roots and weight of seminal roots to root pulling resistance (r = 0.07 and r = 0.36*, respec-tively) [14]. Expanding the number of seedling root traits and improving respective phe-notyping procedures, may increase the chance of capturing strong relationships between different growth stages in maize.
Using digital imaging software to automate phenotypic analysis is an innovative and efficient way of accurately taking measurements of plant physiological traits [15]– [19]. Roots have been difficult to phenotype in a high throughput manner due to a lack of simple access and their highly plastic nature. With the development of custom root analy-sis systems, quantitative studies of root systems are now possible [20], [21]. There are several software frameworks that extract root morphology traits in two-dimensions in various hierarchies of automation. This ranges from manual root labeling like DART (Le Bot and Serra, 2009), to semi-automated software like WinRhizo (Pro, 2004), a commer-cial root analysis tool, and EzRhizo [22], a freely available software, all the way to full integrated imaging-analysis platforms like SmartRoot [23] for small root systems and re-cent platforms, allowing for automated measurements as well as invoking a ranking sys-tem for root traits [17].
These software frameworks have substantially enhanced the research communi-ty’s ability to efficiently analyze and accumulate massive amounts of data. They also pi-oneered the utilization of graphical user interface (GUI) that enables ease of use.
Howev-er, most of these software frameworks are either expensive, not expandable to increased (or decreased) dimensions, or cannot be fine-tuned to a specific setup. We developed an open-source, modular, easy-to-use and efficient root system architecture characterization software called ARIA (Automatic Root Image Analysis). This is based on a mathemati-cally rigorous approach of converting root images into graphs. We show how extracting a variety of traits becomes a simple process of utilizing various graph algorithms. There are several major advantages to such a graph based approach to extracting root system traits: (a) graph based methods are well-studied and have very fast and efficient algorithms (for example, used in Google, Facebook, most GPS devices etc.) that enable fast, real time data analysis, (b) graph based methods are easily scalable (having almost linear computa-tional complexity) and, hence, can be easily extended to larger problem sizes without compromising on time (with direct implication to large 3D tomography datasets), and (c) a graph-based approach is generic. That is, by making trivial modifications to the defini-tions of parameters like edges, weights, and labels, a huge variety of traits can be ac-cessed. This makes a graph based framework trivially extendable. Furthermore, graphs are dimension independent, and hence this framework is trivially extendable to 3D root image analysis.
In this study, the utility of ARIA has been tested by phenotyping 384 maize in-bred lines using scanned images of seedling roots. These data were then applied to a ge-nome wide association study (GWAS) to detect marker-trait associations. Measurements of the trait Total Root Length were analyzed for a comparative GWAS study, as this is the only trait shared between the current platform WinRhizo Pro 9.0 and ARIA. The
ob-jective of this study is to show that our new and freely accessible root phenotyping soft-ware ARIA is a fast and accurate platform for automated phenotyping, with the potential of adding additional features when compared to the established software WinRizo Pro 9.0. For both programs, significant marker trait associations were found using a general linear model. Also, phenotypic measurements with both programs were compared using a 74 maize inbred line panel [24] to further validate utility of ARIA. The results of this study show that ARIA is an accurate and dependable tool for completing large phenotyp-ing experiments, needed for many quantitative genetic studies. Its flexibility makes ARIA a very useful tool to breeders and biologists studying root architecture.
Results
Root Traits Captured by ARIA
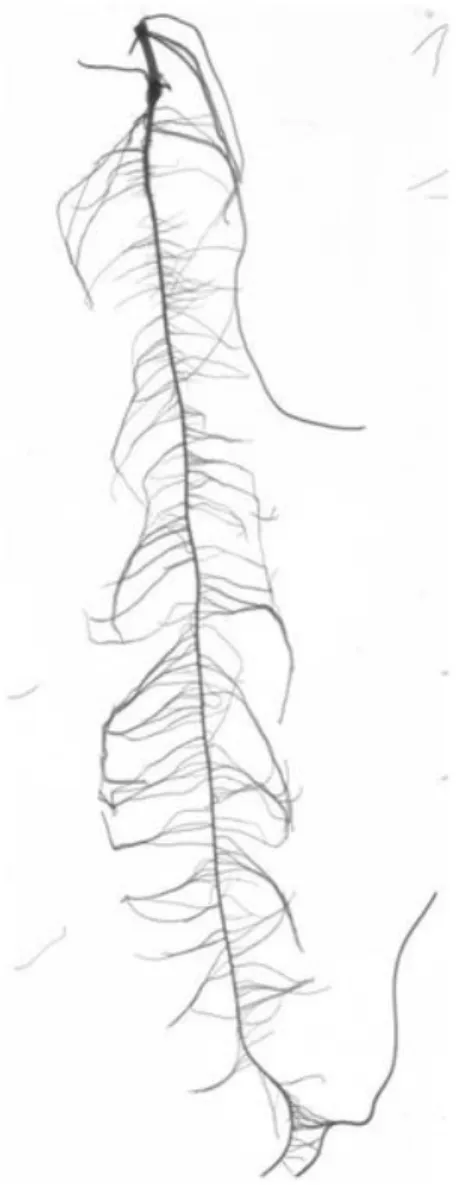
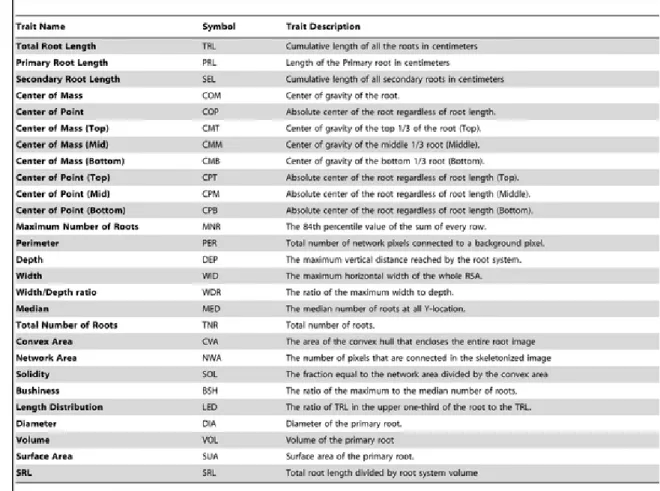
Using ARIA, 27 different root traits were extracted from each scanned image of seedling roots (Table 1). Some traits are more suitable for 3D root scan image analysis such as Depth, Width, and the Width/Depth ratio. All simple statistics as well as herita-bility estimates for all root traits are found in Table S2. ARIA captures more traits than existing programs such as WinRhizo Pro 9.0, which lists eight different traits that can be obtained from a single root scanned image when buying a standard package. ARIA is ful-ly automated with the ability to capture up to three separate seedling roots from a single image, and to conduct all analyses with limited user interference. Each image was a high resolution scan (around 4400×6200 pixels) of three seedling roots placed side-by-side (Figure 1). Within each image the bounding boxes were automatically identified for each root. Each of the three roots is then individually analyzed and its 27 traits extracted. Data
is then exported into an Excel file. This process takes approximately 20 seconds on a standard desktop (2.8 GHz machine). We used a total of 1059 images, each containing up to three roots per image. ARIA ran autonomously and extracted traits within 12 hours, allowing for fast turnaround of phenotypic data. Thus, trait capture is very fast and effi-cient when analyzing multiple roots of large experiments.
Table 1 Traits captured by ARIA
Validation of Measurements
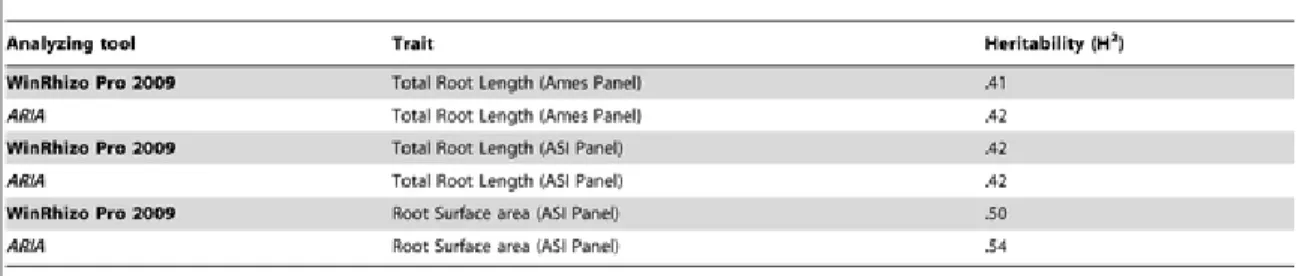
In order to validate measurements made by ARIA with those obtained by WinRhizo Pro 9.0 (Regent Instruments, Quebec, Canada), the same images of hydropon-ically grown maize seedling roots were analyzed by both programs and data compared. Total Root Length was found to be closely correlated with r = 0.97 (P = 0.0001) when ana-lyzing data within the Ames Panel. For the ASI panel, total root length was correlated between the two programs at r = 0.92 (P = 0.0001), and root surface area was closely corre-lated at r = 0.90 (P = 0.0001). Broad sense heritabilities (H2) were calcucorre-lated for both as-sociation mapping populations (Table 2). Heritability estimates were generally higher for
measurements extracted using ARIA at H2 = 0.42 compared to H2 = 0.41 for total root length measured in the Ames Panel, as well as root surface area in the ASI panel with H2 = 0.54 using ARIA compared to H2 = 0.50 using WinRhizo Pro 9.0.
Table 2 Comparison of repeatability estimates for WinRhizo Pro 9.0 and ARIA.
Genome Wide Association Study Using ARIA vs WinRhizo
A GWAS experiment was conducted in order to show the utility of this new pro-gram and its ability to analyze many root images in a high-throughput manner compared to WinRhizo, the current platform used. Further GWAS analyses will be documented in a future publication. TRL was extracted from a single scan of three roots from each inbred line. This process was repeated three times, once for each replication. Analysis of TRL measured with both ARIA and WinRhizo combined with genotypic information on 135,311 single nucleotide polymorphism markers across the entire genome identified significant associations at p<5.3×10⁻⁷. Markers found to be significant were located on chromosomes 1, 2, and 4 for ARIA (Figure 3) while WinRhizo analysis resulted in addi-tional SNPs on chromosomes 3, 5, 6, and 8 (Figure 4). Both programs identified signifi-cant markers in similar regions of the genome specifically on chromosome 2 and chro-mosome 4. Moreover, significant SNPs on Chrochro-mosome 4 were identical for both pro-grams.
Discussion
Quality of ARIA Trait Estimates, Limitations and Prospects
ARIA is a reliable program that results in accurate measurements comparable to established programs such as WinRhizo Pro 9.0. The close correlation and higher herita-bility estimates of TRL and TSA are encouraging for using ARIA to obtain accurate measurements in future quantitative studies. A limitation for using ARIA in the current study was that only three roots were analyzed at a time. ARIA can be extended to allow a larger number of roots to be analyzed within a single image, depending on the scanning or image capture device. Since ARIA can automatically crop pictures for the user, keep-ing roots separate is important for accurate measurements, as crossed over roots could cause uneven cropping or erroneous paths. When comparing the amount of time needed to extract root measurements with ARIA and extracting measurements with WinRhizo, ARIA simplifies the process and cuts the time taken measurements to less than half the amount of time needed for WinRhizo. This is in part due to the automatic cropping sys-tem as well as exporting measurement values into an Excel spreadsheet all at once within 20 seconds per seedling root. In WinRhizo, each root has to be cropped manually; data are extracted into a.txt file, which needs to be edited for data analysis.
Exporting data directly into a user friendly format ARIA by-passes all of these in-termediate steps. The current version of ARIA is automated for roots exhibiting a distin-guishable primary root. However, ARIA should work equally well with multiple equal order roots with minor changes due to the graph based formulation: ARIA finds all lengths of roots as distances from kernel to root tips and subsequently picks the single
longest root (this can be modified to account for multiple equal order roots, for example in rice). A potential limitation is when a secondary root curl ends exactly at the primary root. This creates circular loops in the graph that impair further analysis. However, none of the 3000 images analyzed exhibited this issue. A way to resolve this minor issue is to consider a quasi-temporal approach to ‘growing’ the graph vertex-by-vertex that will dis-tinguish these overlaps (work in progress).
The graph based formulation makes this framework easily extendable to multiple purposes [25], [26]. This same framework of trait extraction has been applied in other disciplines including chemistry [25] and materials science [26]. Examples of extensions include 3D phenotyping where magnetic resonance imaging (MRI), X-ray or optical to-mography data can be curated and traits extracted. Furthermore, ARIA can work with a variety of data formats including photographs, scanned images, microscopy images as well as X-ray based reconstructions.
Significance of ARIA
While current root analysis programs are available to make measurements of root traits, none currently offers the flexibility and functionality as ARIA. When comparing WinRhizo 9.0 to ARIA, the larger numbers of traits that can be captured, ability to cap-ture 3D image measurements, and shorter time spent to extract trait measurements from images, are key advantages of. ARIA, automatically crops root images, after a mouse click defines the starting point for measurements. Furthermore, ARIA has the ability to mark a batch of images enabling batch analysis. In ARIA, measurements are exported into an Excel spreadsheet, while WinRhizo gives a text file that must be converted.
ARIA’s ability to do this automatically makes this program high-throughput and decreas-es chancdecreas-es of human error. Another key advantage to this program is the fact that meas-urement capabilities can easily be added, as additional key architectural attributes of roots are determined.
Using ARIA, mapping studies for root traits can be implemented on a larger scale due to the reduced time needed for phenotyping. This software system aids plant scien-tists by relieving the phenotyping bottleneck for quantitative traits such as root architec-tural traits by adding to existing technologies in phenomics [27]. Not only is this program fast, its ability to analyze both 2D and 3D images also offers a unique opportunity to look at the same traits, with the same analysis program, but from two different perspectives. Previous programs such as RootReader2D [28] and RootReader3D [29] offer extensive trait collection, but are hindered by the fact that each program is restricted to analyze at either 2D or 3D. ARIA in comparison is able to not only analyze 2D flat plane images such as those presented here, but also 3D images of roots. To show this feature, a simple 3D image of a root was analyzed using ARIA (Figure 2). Here, we demonstrate that skel-etonization and outlining of the primary root can be completed as in 2D. The actual measurements of select traits have also been included in pixels (Figure 2). Based on mul-tiple points of view of the same root system, ARIA extracts 27 root traits in a single root analysis. Figure 3 shows how the mathematical foundation (graph based analysis) cou-pled with the open-source framework can be trivially extended to other trait extraction.
Figure 2 Demonstration of a 3D image analysis. A) Skeletonization of a 3D root im-age using ARIA. B) After skeletonization process is complete, the primary root is found and highlighted in black for accurate measurement of PRL measured at 1479 pixels, TRL measured at 582 pixels, and SEL with a measurement of 897 pixels.
Pix-el count can be converted to standard measurement notation with the inclusion of a baseline ruler to count pixels per cm or inch.
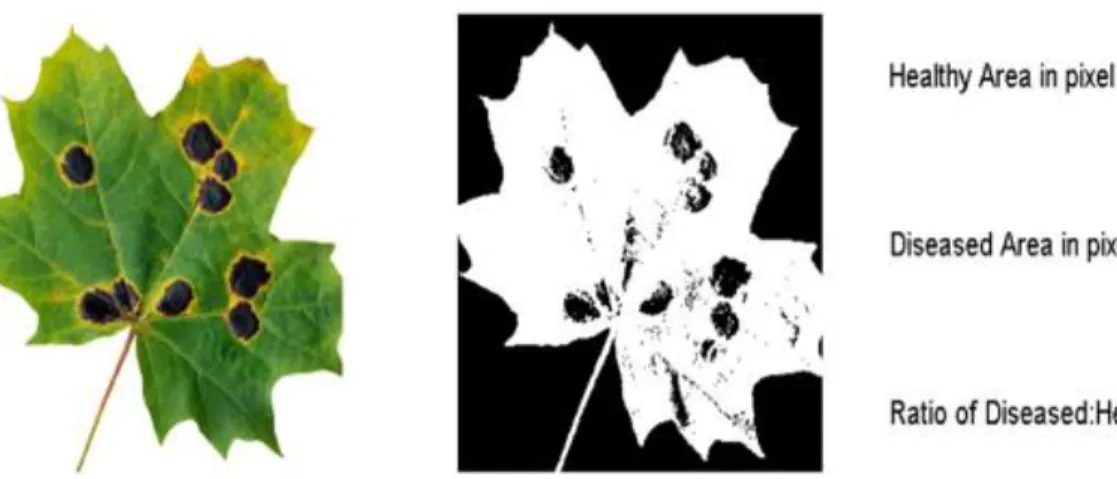
Figure 3 Analysis of a diseased maple leaf, ARIA’s flexible mainframe will allow multiple uses of the program beyond root phenotyping.
A similar program described by Pascuzzi [17] was used to analyze rice varieties within a gel medium. This program has the ability to capture many of the same traits as ARIA. The major advantage of ARIA is that it can directly analyze those same gel medi-um images in both 2D and 3D formats. This adds to the flexibility of this free access pro-gram. Existing phenotyping systems can utilize this analysis tool without changing their growth procedures, whereas the other program is not as dimensionally flexible. No changes need to be made in the GUI or procedures to analyze images. This allows for an expanded number of environmental conditions, whether controlled by humans or nature, in which root architecture could be studied and for connections between how root devel-op in a hydrdevel-oponic environment compared to soil or other growth medium.
Materials and Methods
ARIA (Automatic Root Image Analysis)
ARIA is custom software written in the programming framework, MATLAB (Na-tick, Massachusetts, United States). ARIA has a user friendly GUI interface to enable easy and rapid data extraction. The operational concept of the software is to convert the root image (after standard image pre-processing) into a graph. The software framework can read in most standard image formats. Each image is loaded (Figure 1), and after a sequence of pre-processing steps, converted into a graph. A graph is a mathematical con-struct consisting of a set of vertices that are connected by a set of edges. This is done by labeling each pixel of the root image into a vertex, and linking nearest neighbor pixels with edges. The key steps of the software are:
a) Thresholding.
The background is first identified (using morphological operations in Matlab) and renormalized to black. This effectively eliminates most of the background signal. Then the image threshold is calculated using Otsu’s method. The grey scale image is converted into a black and white image. This is done by comparing the intensity of each pixel with a threshold value. The pixel is marked as black (or white), if it’s grey scale value is smaller (or larger) than the threshold.
b) Connected components.
Since the root is one large connected system, everything else that is not connected to the root can be removed from the image. This idea is encoded in the graph concept of connected components, which enumerates all the distinct connected components in the image. The largest connected component is the root, all the other connect components are noise or other foreign artifacts. Note that if the image resolves finer root hairs (which our imaging process does not do) these will still be part of the largest connected component.
c) Skeletonization.
A ‘wire-frame’ skeleton of the binary image is constructed by thinning (or erod-ing). Skeletonization is a fundamental tool with many applications in image processing and visualization. Here, skeletonization is essential to identify and distinguish between the primary and secondary roots.
d) Primary and secondary root identification.
The primary root is identified as the graph path that has the longest path length. This is accomplished by Dijkstra’s algorithm to estimate shortest paths between two
points of the graph [32]. Dijkstra’s algorithm is used to compute the shortest paths from each free end of the root to every other free end. The longest “shortest path” is identified as the primary root. Secondary roots are identified easily by subtracting the primary root from the original image and enumerating the remaining distinct connected components.
e) Graph querying and post processing.
The graph is queried to construct several traits starting from simple traits like total root length, to more complex measures like bushiness. All data are exported into an Excel sheet for ease of analysis and use. This will allow one to place a series of images for analysis at a time and export it to Excel. The data are also displayed on the GUI. All traits are analyzed automatically and can be viewed when clicking display results.
Conclusion
A high-throughput framework, ARIA, was created that could easily extracts traits of a plant root with just a simple image input. From the traits extracted, it was found that Total Root Length has high correlation with single nucleotide polymorphism (SNP) in the similar region of the genomes. Moreover, it also shows that such framework can easily be extended to similar problems and would allow larger phenotyping experiments to be con-ducted.
References
[1] Smith, S., & De Smet, I. (2012). Root system architecture: insights from Ara-bidopsis and cereal crops. Philosophical Transactions of the Royal Society B:
Biological Sciences, 367(1595), 1441–1452.
http://doi.org/10.1098/rstb.2011.0234
[2] Aiken RM, Smucker AJM (1996) Root System Regulation Of Whole Plant Growth1. Annual Review of Phytopathology 34: 325–346. doi: 10.1146/annurev.phyto.34.1.325
[3] Lynch J (1995) Root Architecture and Plant Productivity. Plant Physiology 109: 7–13.
[4] Feldman L (1994) The Maize Root. In: Freeling M, Walbot V, editors. The Maize Handbook: Springer New York. 29–37.
[5] Hochholdinger F, editor (2009) Handbook of Maize: Its Biology. 145 p.
[6] Hoppe DC, McCully ME, Wenzel CL (1986) The nodal roots of Zea: their de-velopment in relation to structural features of the stem. Canadian Journal of Botany 64: 2524–2537. doi: 10.1139/b86-335
[7] Zhu J, Mickelson SM, Kaeppler SM, Lynch JP (2006) Detection of quantitative trait loci for seminal root traits in maize (Zea mays L.) seedlings grown under differential phosphorus levels. Theor Appl Genet 113: 1–10. doi: 10.1007/s00122-006-0260-z
[8] Liu J, Li J, Chen F, Zhang F, Ren T, et al. (2008) Mapping QTLs for root traits under different nitrate levels at the seedling stage in maize (Zea mays L.). Plant and Soil 305: 253–265. doi: 10.1007/s11104-008-9562-z
[9] Jordan WR, Douglas WA, Shouse PJ (1983) Strategies for Crop Improvement for Drought-Prone Regions. Agriculture Water Management 7: 281–299. doi: 10.1016/0378-3774(83)90090-2
[10] Trachsel S, Kaeppler SM, Brown KM, Lynch JP (2010) Shovelomics: high throughput phenotyping of maize (Zea mays L.) root architecture in the field. Plant and Soil 341: 75–87. doi: 10.1007/s11104-010-0623-8
[11] Hammer GL, Dong Z, McLean G, Doherty A, Messina C, et al. (2009) Can Changes in Canopy and/or Root System Architecture Explain Historical Maize Yield Trends in the U.S. Corn Belt? Crop Science 49: 299. doi: 10.2135/cropsci2008.03.0152
[12] Landi P (1998) Seedling characteristics in hydroponic culture and field perfor-mance of maize genotypes with different resistance to root lodging. Maydica 43: 111.
[13] Landi P, Giuliani M, Darrah L, Tuberosa R, Conti S, et al. (2001) Variability for root and shoot traits in a maize population grown in hydroponics and in the field and their relationships with vertical root pulling resistance. Maydica 46: 177– 182.
[14] Nass HG, Zuber MS (1971) Correlation of Corn (Zea mays L.) Roots Early in Development to Mature Root Development1. Crop Sci 11: 655–658. doi: 10.2135/cropsci1971.0011183x001100050015x
[15] Brewer MT, Lang L, Fujimura K, Dujmovic N, Gray S, et al. (2006) Develop-ment of a Controlled Vocabulary and Software Application to Analyze Fruit Shape Variation in Tomato and Other Plant Species. Plant Physiology 141: 15– 25. doi: 10.1104/pp.106.077867
[16] Chavarria-Krauser A, Nagel KA, Palme K, Schurr U, Walter A, et al. (2008) Spatio-temporal quantification of differential growth processes in root growth zones based on a novel combination of image sequence processing and refined concepts describing curvature production. New Phytol 177: 811–821. doi: 10.1111/j.1469-8137.2007.02299.x
[17] Iyer-Pascuzzi AS, Symonova O, Mileyko Y, Hao Y, Belcher H, et al. (2010) Im-aging and analysis platform for automatic phenotyping and trait ranking of plant root systems. Plant Physiol 152: 1148–1157. doi: 10.1104/pp.109.150748
[18] Nagel KA, Putz A, Gilmer F, Heinz K, Fischbach A, et al. (2012) GROWS-CREEN-Rhizo is a novel phenotyping robot enabling simultaneous measure-ments of root and shoot growth for plants grown in soil-filled rhizotrons. Func-tional Plant Biology 39: 891. doi: 10.1071/fp12023
[19] Wang L, Uilecan IV, Assadi AH, Kozmik CA, Spalding EP (2009) HYPOTrace: Image Analysis Software for Measuring Hypocotyl Growth and Shape Demon-strated on Arabidopsis Seedlings Undergoing Photomorphogenesis. Plant Physi-ology 149: 1632–1637. doi: 10.1104/pp.108.134072
[20] Le Bot J, Serra V, Fabre J, Draye X, Adamowicz S, et al. (2009) DART: a soft-ware to analyse root system architecture and development from captured images. Plant and Soil 326: 261–273. doi: 10.1007/s11104-009-0005-2
[21] Zeng G, Birchfield ST, Wells CE (2008) Automatic discrimination of fine roots in minirhizotron images. New Phytol 177: 549–557. doi: 10.1111/j.1469-8137.2007.02271.x
[22] Armengaud P, Zambaux K, Hills A, Sulpice R, Pattison RJ, et al. (2009) EZ-Rhizo: integrated software for the fast and accurate measurement of root system architecture. The Plant Journal 57: 945–956. doi: 10.1111/j.1365-313x.2008.03739.x
[23] Lobet G, Pagès L, Draye X (2011) A novel image-analysis toolbox enabling quantitative analysis of root system architecture. Plant physiology 157: 29–39. doi: 10.1104/pp.111.179895
[24] Abdel-Ghani AH, Kumar B, Reyes-Matamoros J, Gonzalez-Portilla PJ, Jansen C, et al. (2012) Genotypic variation and relationships between seedling and adult plant traits in maize (Zea mays L.) inbred lines grown under contrasting nitrogen levels. Euphytica 189: 123–133. doi: 10.1007/s10681-012-0759-0
[25] Wodo O, Roehling JD, Moulé AJ, Ganapathysubramanian B (2013) Quantifying organic solar cell morphology: a computational study of three-dimensional maps. Energy & Environmental Science 6: 3060. doi: 10.1039/c3ee41224e
[26] Samudrala S, Wodo O, Suram SK, Broderick S, Rajan K, et al. (2013) A graph-theoretic approach for characterization of precipitates from atom probe tomogra-phy data. Computational Materials Science 77: 335–342. doi: 10.1016/j.commatsci.2013.04.038
[27] Furbank RT, Tester M (2011) Phenomics–technologies to relieve the phenotyp-ing bottleneck. Trends Plant Sci 16: 635–644. doi: 10.1016/j.tplants.2011.09.005 [28] Clark RT, Famoso AN, Zhao K, Shaff JE, Craft EJ, et al. (2013) High-throughput two-dimensional root system phenotyping platform facilitates genetic analysis of root growth and development. Plant Cell Environ 36: 454–466. doi: 10.1111/j.1365-3040.2012.02587.x
[29] Clark RT, MacCurdy RB, Jung JK, Shaff JE, McCouch SR, et al. (2011) Three-dimensional root phenotyping with a novel imaging and software platform. Plant Physiol 156: 455–465. doi: 10.1104/pp.110.169102
[30] Meuwissen THE, Hayes BJ, Goddard ME (2001) Prediction of Total Genetic Value Using Genome-Wide Dense Maker Maps. Genetics 157: 1819–1829. [31] Gruber BD, Giehl RF, Friedel S, von Wiren N (2013) Plasticity of the
Arabidop-sis root system under nutrient deficiencies. Plant Physiol 163: 161–179. doi: 10.1104/pp.113.218453
[32] Knuth DE (1977) A generalization of Dijkstra’s algorithm. Information Pro-cessing Letters 6: 1–5. doi: 10.1016/0020-0190(77)90002-3
[33] Romay MC, Millard MJ, Glaubitz JC, Peiffer JA, Swarts KL, et al. (2013) Com-prehensive genotyping of the USA national maize inbred seed bank. Genome Biol 14: R55. doi: 10.1186/gb-2013-14-6-r55
CHAPTER 3: ABOVE GROUND PHENOTYPING
Fast, automated identification of tassels: Bag-of-features, graph
al-gorithms and high throughput computing
Modified from a paper submitted to KDD DSFEW
Nigel Lee, Yong Suk Chung, Srikant Srinivasan, Patrick Schnable, Baskar Ganapathysubramanian
Abstract
We present a high throughput computing workflow for the automated extraction of phenotypic traits from digital images of growing maize plants in a large scale field ex-periment. This framework enables automated data collection and curation towards an-swering a fundamental question in plant sciences – how do genotype and environment, separately and in combination, interact to affect tassel development, morphology and the progression of anthesis? While manual phenotyping of tassel morphologies has been per-formed previously in field settings [1] and smaller scale automated phenotypes may have been conducted in greenhouse or other controlled environment experiments [2], this ex-periment is the first of its kind to do so in a field setting involving imaging several thou-sands of maize plants, with each set of plants imaged thouthou-sands of times over a two week flowering period. Our high throughput phenotyping framework consists of three key
stages: (a) a bag-of-features based image classification method to isolate tassels from the rest of the cluttered image; (b) a graph-based image processing framework to extract fea-tures from the tassel images; and (c) a work distribution system that deploys the above framework to extract features from individual images in a massively parallel way. This work illustrates how the integration of sensor technology, machine learning and distribut-ed computing can dramatically enhance high throughput phenotyping even in a challeng-ing field environment.
Introduction
Field-based phenotyping is a bottleneck in the agricultural sciences, particularly in plant breeding. Manual phenotyping and the more recently deployed semi-automated phenotyping paradigms are usually not only low precision but also low throughput [3][4]. Thus, the cost of obtaining phenotypic data via traditional approaches is quite high. This translates to a lower rate of genetic gain because only a subset of available germplasm can be phenotyped due to resource constraints. In contrast, sustained research over the past two decades has greatly improved our ability to generate genotypic data with ad-vances in next-generation sequencing and genotyping technologies. To ensure that phe-notypic data are available to optimally utilize this rich gephe-notypic information, there been a recent concerted push towards developing engineered solutions to enable high-throughput phenomics – the ability to image and automatically extract features on a large scale. This is the data science and engineering motivation of the current work.
The overarching scientific driver for the work is to precisely understand the genet-ic drivers for tassel development, morphology and the progression of anthesis. The tassel
(figure 4, right) is a structure at the top of a maize plant that contains the male flowers. These flowers produce pollen that is essential for fertilization of female flowers borne on the ear. Prior to pollination, the tassel emerges from a whorl of leaves and starts shedding pollen. The tassel architecture critically affects pollen production, dispersal and fertiliza-tion. Successful fertilization is essential for grain producfertiliza-tion. [5]. As such, understanding the diversity of tassel architectures and its dynamics during the pollination stage is crucial to understanding (and potentially tuning) the genetic basis of pollen shedding. Previous studies on understanding variation in tassel architecture relied on manual observations at a single time point, or were small scale studies that employed manual image post-processing to extract architecture traits.
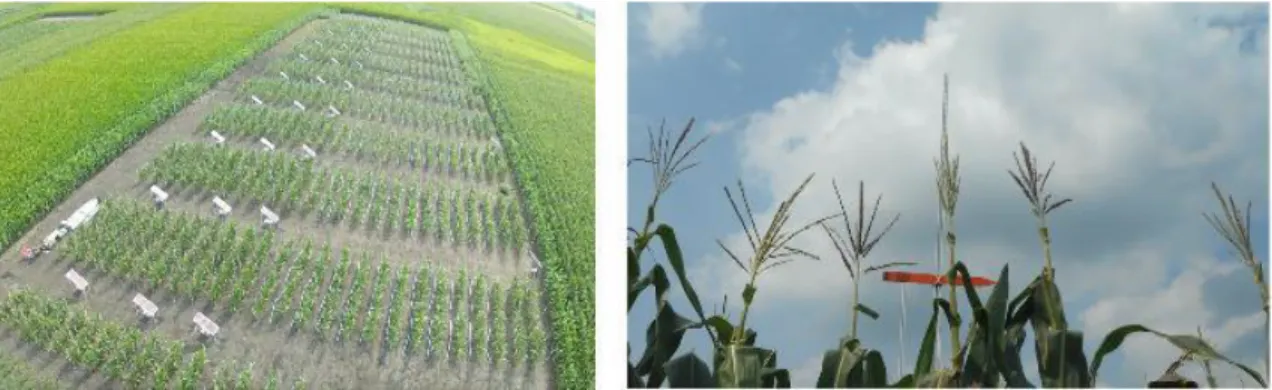
Figure 1 Left image shows an aerial view of the maize Nested Association Mapping (NAM) population planting. Right image shows a representative image taken by one
of the 456 cameras
Leveraging availability of inexpensive 20 mega-pixel cameras integrated with ad-vances in Internet of Things (IoT) that allows coordination of such cameras via cheap raspberry pi microprocessors, the Schnable group deployed a large scale plant image cap-ture experiment in the summer of 2015 (Figure 1, left). Field phenotyping of the maize Nested Association Mapping (NAM) [6] population was conducted using 456 cameras
simultaneously, each camera imaging a set of 6 plants. The cameras were powered by solar panels strategically placed between the rows of plants. Each camera took an image every 10 minutes during a two week growing period in August 2015. The population that was imaged consists of about 5,000 recombinant inbred lines (RILs) created by crossing 25 diverse inbred lines with a common parent, B73. This population has been extensively used to define the genetic architecture of a wide variety of agronomic traits [7][8][9]. The plants were organized in rows (or plots) of 15 plants each laid out in the East-West direc-tion. Each row contained two sets of six unique genotypes with an additional separator plant between the two sets and 1 border plant at each end of the row. The camera used for imaging each set of six plants was placed south of the row with the camera facing north, to prevent overexposure due to the direct incidence of the sun on the camera. The rows were spaced at 60” in the north-south direction and a set of 12 such rows forms a range. The experiment was thus laid out in 19 ranges going east-west. The genotypes were ar-ranged in the descending order of height from south to north. This was done to minimize interference from background tassels in the captured images. The genotypes within each row were typically of similar height and were therefore ordered randomly.
Over 300,000 images (~ 2.2 Terabytes of data) were collected, which precludes comprehensive manual exploration. We divided the analysis and feature extraction of this data set into two stages: (a) In the first stage, the digital images were segmented to isolate only the tassels. Because the tassels exhibit a diverse architecture and there was signifi-cant possibility of occlusion, (wind caused) movement and intensity changes (cloudy day, rain, mist etc.), we used a machine-learning approach for object classification.
Specifical-ly, we deployed a Bag-of-Features object identification model to recognize the tassel and obtain bounding boxes on the tassel; (b) In the second stage, we deployed consensus based thresholding and graph based algorithms to efficiently extract architecture traits from the segmented images of the tassels. Utilizing the fact that two stages have to be applied to every image, which is an embarrassingly parallel proposition, we leveraged a computing cluster to efficiently distribute the analysis of individual images in a massively parallel manner. Finally, a simple visualization module was created to help manually ex-plore correlations between train combinations. An overview of the entire process is given in Figure 2.
Methods
Dataset description
Around 22,000 images were collected daily. Each image was 5152 x 3864 pixels in dimension and required 20MB of memory space. The images were stored in JPEG format. Note that stage 1 of the workflow identifies bounding boxes of the tassel captured in each image and crops out the bounding box. This substantially reduces the effective size of each image (from 20 MB to 6 x 500KB).
Stage 1: Bag-of-Features for Tassel Detection and Segmentation
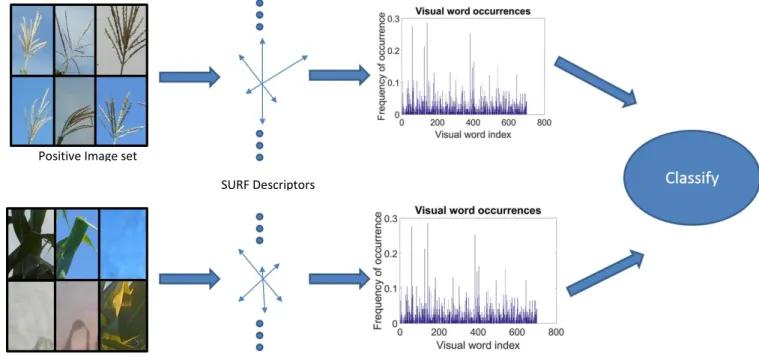
We deployed a Bag-of-Features based supervised learning approach to perform object identification of all tassels in the image. Bag of features (BoF) originated from the Bag of Words (BoW) classification technique. BoW classifies a document based on a
Positive Image set
Negative Image set
SURF Descriptors
normalized histogram of vocabulary occurrence without order. In other words, a BoW model is essentially an intersection between a dictionary and the document but with an additional variable that indicates the number of occurrence of a particular vocabulary. Basically, histograms identifying the number of times words (from the dictionary) appear are constructed. This set of histograms that a document exhibits is used as a feature to classify the document. The term “bag” is used because the order of words does not mat-ter. Bag of features (BoF) is based on the same concept except that BoF replaces the word vocabulary with features from the image, and replaces the word dictionary with a ‘visual dictionary’. The BoF method then works by constructing a histogram of (image) features exhibited in the image, and classifies the image based on characteristics of the feature histograms. Thus, the BoF has three main steps: feature detection, histogram crea-tion and training. For a detailed descripcrea-tion of the BoF method and its diverse applica-tions, we refer the interested reader to [10].
Feature detection using SURF
To construct a visual vocabulary that describes an image, it is necessary to auto-matically extract image features. Just as empty spaces in a document do not provide much information for classification, parts of images where there exist no contrast varia-tion would typically indicate lack of features [11]. Feature detecvaria-tion methods carefully identify parts/features of an image that convey substantial information. Feature detectors can also extract features that are scale, translation, rotation invariant as well as invariant to moderate perspective transformations and illumination variations. This was
particular-ly important for our problem because wind/sky conditions move and rotate the tassel, thus changing perspective and illumination.
Examples of appropriate feature detection methods include the SIFT (Scale Invar-iant Feature Transform) and the SURF (Speeded-Up Robust Feature) methods [12]. The output from the feature detection algorithm is an array of keypoints along with a localized intensity hessian around these keypoints. Based on the above mentioned requirements, we chose to utilize a SURF algorithm to identify features in this work.
Histogram creation
Note that different images can have different number of key points (just like dif-ferent documents can have difdif-ferent number of words from the dictionary). A ‘visual vo-cabulary’ is constructed by sampling a diverse set of images, vectorizing the key point descriptors, and clustering these descriptors to construct a normalized feature histogram. We used standard k-means clustering to construct the visual vocabulary.
Training the BoF
Training a BoF model consists of first creating a labeled set of images. Because our goal was to classify an image part as either ‘Tassel’ or ‘Not a Tassel’, we created a positive dataset consisting of images of tassels (from the original dataset) and a negative dataset of images consisting of images of the plant and sky (again sampled from the orig-inal dataset). Figure 6 shows a representative set of positive and negative images. The image features for these two sets of data were extracted and the visual vocabulary that describes the two data sets was constructed. A classifier was then trained that optimally distinguishes the images into the positive or negative dataset given the normalized feature
histogram of that image. Since we have a binary classification problem, we utilized a Support Vector machine (SVM) as the classifier.
Deploying the BoF
Once the BoF classifier was trained and validated, it could quickly classify a giv-en image part as either belonging to a tassel or not. We deployed the BoF classifier in the following way: Each image that required tassel identification was subsampled in 50x50 pixel chunks. Each chunk was passed to the classifier to decide if that chunk was part of a tassel. Contiguous chunks of the image that enveloped the tassel were identified and a bounding box of the tassel was obtained.
Parallel deployment of the BoF
Since each pixel chunk was classified individually and independently, we de-ployed a hierarchy of parallelism to accelerate this process. Each image was sent to a computing node; within each node each pixel chunk was independently classified within a processor/thread.
Post-processing to identify key tassels
Once all tassels in a particular image were identified, standard size/location argu-ments were used to pick the six tassels that were centered in the image and whose sizes were among the largest (since the camera was focused on a particular row, any back-ground tassels were a few rows back in the image and were therefore smaller). In cases, where a clear decision could not be made, the image was flagged for a human to verify and pick the six tassels. Less than 1% of the data had to be manually verified
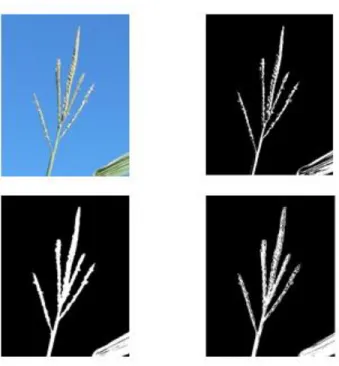
Figure 4 (a) Original image, (b) Otsu's thresholding, (c) Threshold on saturation of HSV, (d) Custom thresholding of blue spectrum
Stage 2: Thresholding and Graph algorithms for trait quantification
Since we were interested in the architectural traits of the tassel, we first threshold-ed and convertthreshold-ed the image to a binary image. We then convertthreshold-ed this binary image into an equivalent graph and utilized graph based algorithms to evaluate various architectural traits. Extracting a diverse set of traits becomes trivially simple by applying well known, fast and efficiently implemented graph algorithms. We carefully chose this approach to enable subsequent plans for in situ and in transit data processing in the future. Graph based methods naturally allow such strategies because they are scalable (having almost linear computational complexity) and have off-the-shelf implementations for a variety of processor architectures, thus enabling simple deployment.
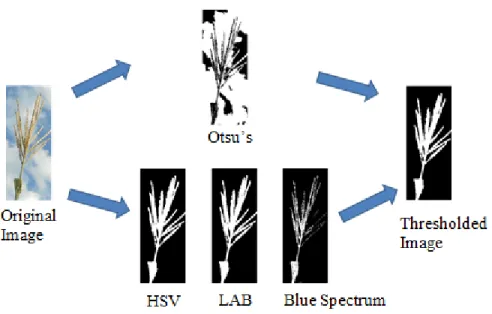
Figure 5 Consensus based thresholding
Consensus based thresholding
Thresholding was used to convert the RBG image of the bounding box containing the tassel into a binary image (Figure 4). It is important to note that images exhibited sub-stantial variation in lighting (caused by intensity variations in time of day, cloudiness of sky, mist, weather conditions). We found that using any single thresholding method failed to give consistently good results. We explored the following thresholding methods: (a) Otsu’s thresholding, which converts the RBG spectrum into a greyscale before thresholding; (b) Using only the blue channel (of the RBG image) to perform threshold-ing, as this naturally differentiated the blue sky from the foreground; (c) KNN based thresholding, which clustered the tassel pixels together; (d) conversion to other color spaces that could isolate hue/saturation (HSV) or make color changes perceptually linear (LAB) followed by thresholding. Several of these methods worked well on a majority of images, but no method worked well on all the images. To resolve this issue, we used a
consensus-based thresholding approach (Figure 5). Here, the five thresholding algorithms mentioned earlier were applied to each image.
The resultant binary images were compared to identify how correlated they were (using a matrix correlation). If three or more of the methods produced similar thresholded images, with a correlation coefficient > 0.95, the union of the three thresholded images was utilized for subsequent analysis. If fewer than three methods produce correlated re-sults, the image was marked for human intervention and stored in a separate folder. This approach substantially streamlined automating the workflow.
Tassel architectural trait extraction
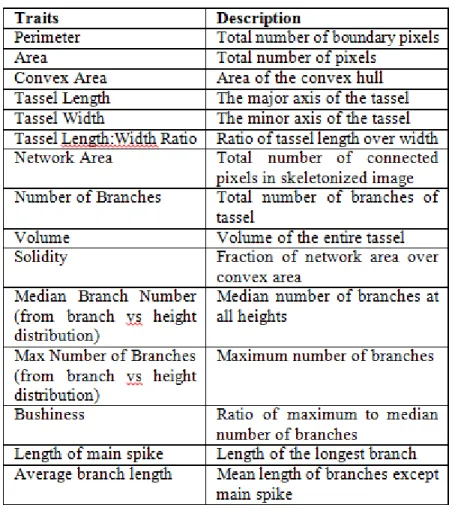
A comprehensive set of tassel architectural traits was identified and is enumerat-ed in the Table below. To efficiently evaluate these traits, the resultant binary image was considered in its equivalent graph based representation [13], and standard graph based operations were performed. These included simple morphological operations (such as connected components) to evaluate perimeter, area, and network area. Graph thin-ning/skeletonization was then used to identify the tassel skeleton. Skeletonization al-lowed thinning of the branches of the tassel and to represent them as a single line of pix-els. The endpoints and branchpoints of this skeletonized graph were then identified, which correspond to the location of the individual spikes in the tassel. The length of the spikes was then evaluated using a graph shortest path algorithm [14].
Table 1 List of traits extracted
Workflow Deployment
The complete workflow consisted of independent functions written in Matlab. We chose Matlab for its ease of deployment and for leveraging its in-built image processing and object recognition modules. The BoF classifier was trained offline using a set of positive and negative datasets. Once trained, the BoF classifier was ported as a separate function for deployment. Both Stage 1 (the BoF classifier) and Stage 2 (thresholding and trait ex-traction) were configured into executables that were stored into the workspace of our lo-cal computing cluster, Cyence. Cyence consists of 248 SuperMicro servers each with 16
cores, 128 GB of memory per node, GigE and QDR (40Gbit) Infiniband interconnects. Cyence has a Matlab environment with the required Matlab Compiler Runtime (MCR) to run MATLAB function using the terminal. A job distribution routine was written that re-quested nodes on the computing cluster and deployed individual folders containing imag-es. Each genotype had a unique folder, with each folder containing between 400 to 2000 images. Each folder was then dedicated to a node/server (consisting of 16 cores). When a
folder was dedicated to a node, the first 16 images were given to the 16 cores in that server. Whichever core completed its assigned image was given the next image in the list, until all the images were analyzed. With a total of approximately 2000 images, each fold-er took about 30 minutes to execute. The total runtime was about 3 days (while respecting
queue structure, and request size limitations on the computing cluster) to complete all the analysis. Data was then exported to both a .txt file and an excel file for better compatibil-ity. The entire process was fully automated, with the framework flagging specific images for human intervention after complete analysis.
BoF performance
The Bag of features classifier was very robust. Accuracy loss was primarily due to false-positive misclassifications. The frequency of false-false-positives was, however, greatly re-duced following the introduction of a larger training set. The model was able to achieve a precision rating of 98% and a recall rating of 99%. The precision rating is the fraction of true positives compared to (true positives + false positives), while recall is the fraction of true positive compared to (true positives + false negatives). The statistics of the best trained classifier is shown in Figure 7.
With a positive and negative training set size of only ~10 images, the false positive per-centage was 4% maximum. We find that the average accuracy flattens out at 98%, even when using a training set consisting of 10000 images. The time taken to train the classifi-er using 1000 images was about 2 hours while to train the classificlassifi-er using 10000 images
took about a day. A camera image had pixel dimensions of 5152 x 3864 while the aver-age size of a tassel in an imaver-age had pixel dimension of 800x800. Even with 6 tassels in an image, the total region of interest barely exceeded 20% of the entire image. This meant that 80% of the camera images are essentially either noise or uninteresting data. By using bag of features to isolate the tassel location, the reduction of data size was significant
Figure 8 Comparison of manually labeled binary morphology classification ('open' vs 'closed') with the convex area
enough to greatly improve processing time and data storage. We anticipate deploying this trained model in the future.
Diversity of tassels
The genotypes of the NAM population exhibited a very diverse variety of tassel architectures. We illustrate a representative set of this diversity in Figure 9. Figures 10 and 11 further show the diversity of traits exhibited. Figures 8 show the diversity across genotype by plotting the histogram of two traits [5]. These histograms were constructed from tassel data at a single time point (or rather, nearly the same time point within the 10 minute imaging window) using 285 images of distinct genotypes. Both figures show
in-sets with images of tassels from extremes of the trait distribution. Figure 8 plots this data in a rank ordered form, along with a manual binary identification of ‘open’ and ‘closed’ morphologies.
We additionally explore how traits evolve across the two week growing period. Figure 11 plot the distribution of two traits for a specific genotype. The histogram is con-structed using 538 images representing a progression of images at 10 minute intervals for a specific plant (genotype). Both figures also show insets with images showing the tassel states at two extrema of the distribution.
Figure 10 Histogram of Convex Area(left) and Tassel Width(right) over diversity
To enable easy visualization of the processed traits and to help visually explore time-series correlations between traits and weather data, we created a simple visualization toolkit in the form of a Matlab GUI. A snapshot of the GUI is shown in Figure 12. The GUI shows the time evolution of traits of an individual genotype, and allows comparison of two traits or other time-series data (specifically weather data like humidity, or tem-perature). This enabled the plant scientist to visually compare correlations and identi-fy/posit causation factors. The GUI also shows the output of a thresholded image as well
as the skeletonized image to visualize the analysis of the image. The user was able to se-lect any of the computed traits and compare with the weather data that is aligned with the dates.
Conclusion
We illustrate and discuss a high throughput computing framework to extract phe-notypic traits from digital images. The digital images were acquired as part of a large field experiment that deployed over 450 stationary cameras in a maize field (growing a diverse genotype panel) to take images of growing plants several hundred times over a two week period. The large amount of data (over 300,000 images) precluded comprehen-sive manual analysis. We utilize a staged approach to feature extraction. The first stage leveraged supervised learning concepts to identify and isolate small objects (tassels) from the image. The second stage performed sophisticated consensus thresholding and subse-quent feature extraction from the isolated images. Taking advantage of the fact that these tasks are independent for each image, a massively parallel approach was taken to ensure timely analysis.
We have showcased an exciting example of integration of widely deployed sen-sors, with machine learning, image processing and distributed computing towards a chal-lenging problem of high throughput phenotyping under field conditions.
Future work includes deploying this framework in geographically disparate loca-tions, extending the framework to extract other agronomically relevant traits, as well as investigating the possibility of in situ data analysis to reduce the data deluge problem. We are currently utilizing the computed traits to perform Genome Wide Association Studies (GWAS) to infer genetic basis for the traits.
References
[1] Westerbergh, A., & Doebley, J. (2002). Morphological traits defining species differences in wild relatives of maize are controlled by multiple quantitative trait loci. Evolution, 56(2), 273-283.
[2] Witt, S., Galicia, L., Lisec, J., Cairns, J., Tiessen, A., Araus, J. L., ... & Fernie, A. R. (2012). Metabolic and phenotypic responses of greenhouse-grown maize hybrids to experimentally controlled drought stress. Molecular plant, 5(2), 401-417.
[3] Houle B., Govindaraju D.R., and Omholt S. Phenomics: the next challenge. Nat Rev Genet, 2010. 11(12): p. 855-66.
[4] Furbank, R.T. and M. Tester, Phenomics--technologies to relieve the phenotyp-ing bottleneck. Trends Plant Sci, 2011. 16(12): p. 635-44.
[5] Upadyayula N.,da Silva H. S., Bohn M. O., Rocheford T. R., Genetic and QTL analysis of maize tassel and ear inflorescence architecture. Theoretical and Ap-plied Genetics, Springer 2006. 112(4):p. 592-606
[6] Yu J, Holland JB, McMullen MD, Buckler ES. Genetic design and statistical power of nested association mapping in maize. Genetics. 2008;178:539–51. doi:10.1534/genetics.107.074245
[7] Buckler ES, Holland JB, Bradbury PJ, Acharya CB, Brown PJ, Browne C, et al. The genetic architecture of maize flowering time. Science. 2009;325:714–8. doi:0.1126/science.1174276. [PubMed] [Cross Ref]
[8] Tian F, Bradbury PJ, Brown PJ, Hung H, Sun Q, Flint-Garcia S, et al. Genome-wide association study of leaf architecture in the maize nested association map-ping population. Nat Genet. 2011;43:159–62. doi: 10.1038/ng.746. [PubMed] [Cross Ref]
[9] Brown PJ, Upadyayula N, Mahone GS, Tian F, Bradbury PJ, Myles S, et al. Distinct genetic architectures for male and female inflorescence traits of maize. PLoS Genet. 2011;7:e1002383. doi: 10.1371/journal.pgen.1002383. [PMC free article] [PubMed] [Cross Ref]
[10] Herbert B., Tinne T., Luc V.G.. SURF: Speeded Up Robust Features. Computer Vision – ECCV 2006. Volume 3951 of the series Lecture Notes in Computer Science:p. 404-417
[11] O’hara S., Draper B. A. Introduction to the Bag of Features Paradigm for Image Classification and Retrieval. ” Computing Research Repository, vol. arXiv:1101.3354v1, 2011.
[12] Nowak E., Jurie F., Triggs B.. Sampling Strategies for Bag-of-Features Image Classification. Proc. ECCV, 2006.
[13] Pikaz, A., & Averbuch, A. (1996). Digital image thresholding, based on topo-logical stable-state. Pattern Recognition, 29(5), 829-843.
[14] Pace J., Lee N., Naik H. S., Ganapathysubramaniam B., Lübberstedt T. Analy-sis of Maize (Zea mays L.) Seedling Roots with the High-Throughput Image Analysis Tool ARIA (Automatic Root Image Analysis). PloS ONE. doi: 10.1371/journal.pone.0108255.