Volume 24
Number 278
An economic study of the dairy enterprise
in northeastern Iowa
Article 1
September 1940
An economic study of the dairy enterprise in
northeastern Iowa
R. K. Buck
Iowa State CollegeJ. A. Hopkins
Iowa State CollegeC. C. Malone
Iowa State CollegeFollow this and additional works at:
http://lib.dr.iastate.edu/researchbulletin
Part of the
Agricultural Economics Commons
, and the
Rural Sociology Commons
This Article is brought to you for free and open access by the Iowa Agricultural and Home Economics Experiment Station Publications at Iowa State University Digital Repository. It has been accepted for inclusion in Research Bulletin (Iowa Agriculture and Home Economics Experiment Station) by an authorized editor of Iowa State University Digital Repository. For more information, please [email protected].
Recommended Citation
Buck, R. K.; Hopkins, J. A.; and Malone, C. C. (1940) "An economic study of the dairy enterprise in northeastern Iowa,"Research Bulletin (Iowa Agriculture and Home Economics Experiment Station): Vol. 24 : No. 278 , Article 1.
An Economic Study of the Dairy
Enterprise in Northeastern Iowa
By R. K. BUCK, J. A. HOPKINS AND C. C. MALONE
AGRICULTURAL EXPERIMENT STATION IOWA STATE COLLEGE OF AGRICULTURE
AND MECHANIC ARTS
AGRICULTURAL ECONOMICS SUBSECTION
RURAL SOCIAL SCIENCE SECTION
In a study of 51 dairy and dual-purpose herds in 1935 and ] 936 it was found that the average value per head of the milk cows was $66 in the high producing dairy herds, compared to $49 in the low producing ones; while investment in buildings and fences was $120 per cow in the high as compared to $90 in the low producing herds. Investment per pound of butterfat pro-duced, however, was lower with the higher producing and more valuable cows.
The cows in the higher producing herds were fed more heavily [LIld received better balanced rations; the total amount of con-centrates amounting to approximately 2,300 pounds in the high and 1,200 in the low producing herds, while total value of all feeds plus pasture amounted to $72, compared to $50. '¥hen ex-pressed per pound of butterfat, however, the values of feed and pasture were but little different between the high and low pro-ducing herds. In fact, the advantage was slightly with the high producing herds.
There was a wide variation in amount of feed fed per cow, which was only partly related to the production per cow. The cows receiving the most feed generally produced more butterfat but not necessarily in proportion to the difference in amount of feed. Consequently, the cows receiving the most feed did not give the highest return per $100 of feed fed.
There appeared to be limits to the most profitable proportion of concentrates and roughages. Those herds which were fed the I!ighest proportion of roughage gave the lowest returns per $100 of feed as well as the lowest butterfat production pl?r cow. On 1 he other hand, those herds which were fed the highest propor-tion 01 grain were among the less profitable ones.
Detailed labor records were kept on 10 farms. An average of 131 hours of labor was used per mill\: cow per year-or 143 hours if work on the young stock is included.
Wilen herds were grouped with regard to butterfat production per cow, it was found that the value of feed and amount as well as the cost of labor and other factors rose with the production from group to group, though costs rose less rapidly than
pro-duction. .
After credits were made for all products from the herds, in-cluding skimmilk and manure, total income was sufficient to pay local market rates for feeds, cash expenses and interest on in-vestment and to allow about 21 cents per hour for labor in the high producing herds under 1935-36 price levels, with butterfat at about .34 cents per pound. The low producing dairy herds however, earned only 15 cents per hour and the dual-purpose ones only 8 cents per hour. Returns from beef produced in the dual-purpose herds were not sufficient to overcome the economic handicap from low butterfat production as compared to the herds of dairy-type cows.
An Economic Study of the D
a
iry
Enterprise in Northeastern lawa
i
By R. K. BUCK, J. A. HOPKINS AND C. C. MALONE.
What are the principal influences affecting the profit from dairying in northeastern Iowa 1 '\That amount of dairy income per cow may be expected and what capital investments, cash
ex-penditures, feed and other costs are involved in securing this income~
The purpose of this bulletin is to throw some light on these questions. It is the second publication based on farm records kept on farms in northeastern Iowa during 1935 and 1936. The first bulletin (Dairy and Hog Farming in Northeastern Iowa, Iowa Agricultural Experiment Station, Research Bulletin 275) was concerned with the farm as a whole and examined the dairy enterprise in its relationships to the rest of the farm busi-ness. This publication is concerned solely with the dairy
enter-prise.'
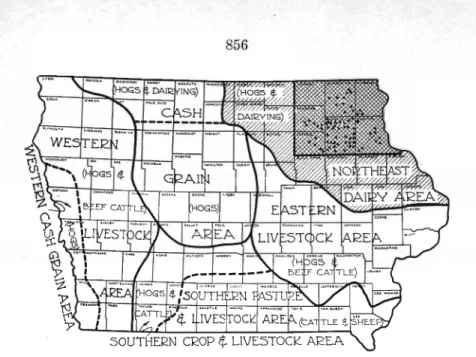
The farms included in this study are located in the northeast-ern Iowa dairy type of farming area and are about equally
divided between the Mississippi loess and the Iowa drift major soil areas. See fig. 1.
There were 15 dual-purpose herds, most of which were
com-posed of grade milking Shorthorn cows from which an average cf 162 pounds of butterfat and 711 pounds of beef were sold or used per cow.' In the strictly dairy herds, output averaged 229 pounds of butterfat and 493 pounds of beef per cow. In table 1,
these are divided into three groups, those with less than 200, 200 to 250 and those over 250 pounds butterfat per cow; these will be referred to as the low, medium and high producing herds, re-spectively.
1 Project 377 of the Iowa Agricultural Experiment Station.
2 Acknowledgement is made to the farmers who cooperated in keeping the original
records; credit is due Dr. C. Y. Cannon, head of the Dairy Husbandry Department,
and Floyd Johnston, head of the DairY Husbandry Section of the Extension Service of
Iowa State College. for valuable suggestions.
3 The dairy herds included in the study ranged in size from 6 to 34 milk cows and averaged 15.3. Holstein was the predominating breed, comprising 43 percent of the
herds, although there were Brown Swiss, Guernsey. Jersey, several herds of mixed
dairy 'breeds as w'€ll as milking Shorthorn herds. About half the herds were grade, one-tenth were entirely purebred and the remainder were mixed purebred and grade.
The purebred herds furnished some additional income from the sale of young stock for
breeding purposes. When the beef-and-milk farms and those with incomplete records
Fig. 1. Location of farms studied.
Eleven of the twelve high producing herds were enrolled in
cow testing associations. Usually in the strictly dairy herds, the
calves (except for replacement heifers) were vealed, while in some of the lower producing herds and in all dual-purpose herds, the calves were carried to heavier weights.
COSTS IN PRODUCING BUTTERFAT
Any farm production requires a certain capital investment,
and currently it is necessary to use various raw materials and to
incur certain operating expenses. The profit that a farmer makes
on an enterprise depends upon his ability to obtain a substantial
profit margin between his costs and selling price on the volumE'
of business done. Each enterprise has its own specific costs such
as feed fed to milk cows, but there are also certain joint cost:;
which two or more enterprises share. For instance, hogs and
cows are both involved in the interest and depreciation charges
on fences and buildings.
INVESTMENTS IN 'l'llE DAIRY ENTERPRISE AS RELATED TO THl<.: Ll<.:VEL OF BU'l'TERFAT PRODUCTION
What is the capital investment in the dairy enterprise and does
this vary with the level of butterfat production per cow ~
First, the value of the cows is significantly greater in the high
producing herds than in the low ones (table 1). The higher
in-TABLE 1. INVESTMENTS IN THE DAIRY ENTERPRISE, NORTHEASTERN
IOWA FARMS. AVERAGE PER FARM, 1935-36.*
Number offarms.. . ... .
Average number cows milked ... .
Butterfat per cow, lba ... .
Total investment: Cows ... .. BuJ1~ ... . Separator ... ' . Milking machine ... . Silo ... .
Fences (dairy share) ... .
Barn (dairy share) ... .
. Tota!.. ... .
r nvestment per cow
Cows§ ... .
BuJ1§ ... .
Special equipment ... .
Building and fences (d.iry share) ... .
Tot.!.. ... .
Tot.l investment per lb. butterf.t
pro-duced ... .
Production per $100 jnvested in the
enter-prise:
Butterfat, lba ... .
Beef,lba ... .
Dairy herds
High-produc- Medium
pro-ing herdst ducing herdst
12 9 17.6 16.6 292 232 $1162 S 882 104 85 49 33 78 30 396 241 221 168 1494 1209 53504 $2648 66.21 53.13 5.92 5.12 7.24 3.80 120.29 97.47 199.66 159.52 .68 .69 146 145 273 278
Low produc- Du.l-purpose
iog herdst herds
15 15 15.8 12.1t 178 162 $ 768 S 646 65 70 32 51 32 16 176 175 121 172 1129 1018 $2323 $2148 48.52 46.13 4.11 5.00 4.04 4.78 90.08 97.51 146.75 153.42 .82 .95 121 106 326 463 !feNo figures were available for investments in water system, windmill or milk house.
tClassified on the basis of number of pounds of butterfat sold or home-used per cow.
+Besides these 12.1 cows milked there was an average of two cows kept for strictly
beef production.
§The differences among the four groups are highly significant.
come justifies a higher valuation if they are raised. Part of the value of these COWS, however, especially those of the
dual-pur-pose type, consisted in their value for beef. As far as milk pro-duction alone is concerned, the low producing cows were prob-ably over-valued relative to the high producing ones.
If a farmer is to build up and maintain a high producing herd, he must secure a superior bull, and a superior bull ordinarily costs more than a poor one. Thus, in the high producing herds studied, the average value of the bull was $104, as compared to $65 in the low producing ones.
The farmers with the higher producing cows also had more capital invested in special dairy equipment and in dairy barn, silo and fences, although this investment varied widely within each group. Total investment in the dairy enterprise ranged from an average of $200 per cow in the high producing herds to $147 per cow in the low producing ones. When figured on the basis of amount of butterfat, sold or used, however, the total capital invested was only 68 cents per pound of butterfat in the high producing herds as compared to 82 cents in the low
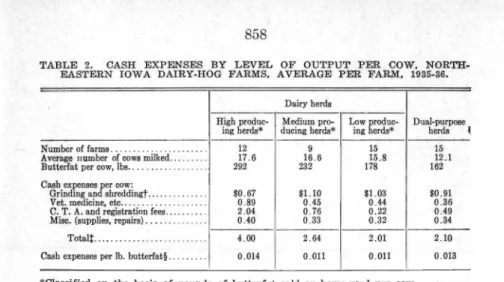
pro-TABLE 2. CASH EXPENSES BY LEVEL OF OUTPUT PER COW, NORTH-EASTERN IOWA DAIRY-HOG FARMS, AVERAGE PER FARM, 1935-36.
Dairy herds
High produc- Medium pro- Low produc- Dual-purpoee ing herds' ducing herds' ing herds' herd. ~
Number of farms ... 12 9 15 15 Average number of cows milked ........ 17.6 16.6 15.8 12.1 Butterfat per cow, lhe .... ..... ......... 292 232 178 162 Cash expenses per cow:
Grinding and shreddingt ... .. $0.67 $1.10 $1.03 $0.91
Vet. medicine, etc .. .. ... 0.89 0.45 0.44 0.36
C. T. A. and registration fe~~" ... .. 2.04 0.76 0.22 0.49 Misc. (supplies, repairs) ... ... ... 0.40 0.33 0.32 0.34 Tot.lt ... ... .. 4.00 2.64 2.01 2.10 Caah expenses per lb. butterfat§. ..... 0.014 0.011 0.011 0.013
*Classified on the basis of pounds of butterfat sold or home-used per cow.
tThis includes only cash outlays for grinding and shredding. Many of the farmers had their own feed grinders; the interest and depreciation on the grinders were in-cluded under equipment costs. The power costs in home feed grinding are probably greater than the cash expenses for grinding and shredding listed above.
tThe difference between the average of the high producing group and the average of the other three groups was highly significant, statistically.
§The differences among averages of the four groups are not statistically significant.
ducing ones. Or to express the same relationship in another way,
the higher producing herds yielded 21 percent more butterfat
than the lower ones per $100 of total investment in the
enter-prise. As between the high producing dairy herds and the
dual-purpose herds, however, it should be pointed out that the latter
produced nearly twice as many pounds of beef per $100 of
in-vestment as the high grade dairy herds, and further, the beef
produced in the dual-purpose herds sold for a higher price per
pound.
CASH EXPENSES
Does increased production bring a significant increase in cash
()utlay per unit of output ~
The veterinarian and medicine expenses are relatively small
when figured on a per cow basis as shown in table 2. However,
the farmers with the highest producing cows had over twice as
much veterinary expense per milk cow as the average in the other
three groups; farmers with higher producing, thus more
valu-able cows, are more inclined to call a veterinarian when a cow becomes sick.
In only one herd, however, did the veterinarian and medicine
charges amount to over $2 per cow.
The cow-testing and registration fees averaged $2.04 per cow
in the 12 high producing herds (all but one of which were
en-rolled in cow testing associations) but was a negligible item in
the other three groups. Expenses for cow testing are a negligible
859
producing herds, the $36 average cow testing association charges were equal to only 2.8 percent of the total feed and pasture value.
There was practically no difference in total cash expenses per cow, between the dual-purpose and the low or the medium pro-ducing groups, all of which averaged just over $2 per cow. The total cash expenses on the high producing herds, however, were nearly twice this amount. When expressed per pound of butter-fat, cash expenses differed but little among the four groups, averaging between 1.1 and 1.4 cents per pound.
PROBLEMS RELATED TO MILK COW RATIONS
Feed and pasture comprise the largest cost items in butterfat rroduction. There were wide variations among farms in feeding practices, both in the composition of the rations and in the amounts fed. The rations of milk cows for the four groups of farms are shown in table 3.
TABLE 3. FEED CONSUMED PER MILK cow BY LEVELS OF BUTTERFAT OUTPUT, NORTHEASTERN IOWA FARMS, AVERAGE 1935-36.
Dairy herds
High produc- Medium pro- Low produc- Dual purpose
ing herds* ducing herds* ing herds* herd, Number of farm' ... ... 12 9 15 15 N umber of cows milked ... 17.6 16.6 15.8 12.1 Butterfat per cow, lhe ... ... ... ... 292 232 178 162
Pounds feed fed per milk cow:
Concentrates.
Corn. ... ... . ... 753 982 668 440
Small grain ... 929 723 382 282 Protein feeds (under 25% protein) .. 360 168 113 59
Protein feed, (over 25% protein). 260 233 72 26
Total concentrates. .... ... . ... 2302 2106 1235 807
Roughages
Silage .... ... .. ... . .. 7236 5498 4079 2664 Alfalfa hay ... . ... .... 2344 1557 985 1192
Soybean and clover hay .. ..
.
... .. 999 1242 1443 1425Other hay ... ... .. 82 410 571 549
Corn stover ... ... . .... .. 160 534 864 1023
Nutritive ratio, concentrates .
...
1:5.4 1:6.1 1:6.4 1:6.9 Nutritive ratio, entire ration .. ... 1:5.8 1:6.3 1:7.2 1:7.5Value of feed per cow:
Concentrates ... .... ... $29.06 $25.72 $15.41 $10.52
Roughages ... ... ... 35.33 31.69 26.91 24.44 Pasture .... ... ... 7.12 6.87 7.58 7.35 Total feed and pastur~ .... 71.51 64.28 49.90 42.31 Value of feed per lb. ~. . .... 0.24 0.28 0.28 0.26
'Classified on basis of pounds of butterfat sold or home-used per cow. tFeed prices used, based on average farm prices for the area in 1935 and 1936.
1935 1936 1935 1936
Corn $0.70 0.75 per bu. Silage $ 4.50 4.50 per ton Oats 0.36 0.35 per bu. Alfalfa hay 14.00 11.00 per ton Barley 0.50 0.60 per bu. Mixed hay 11.00 7.00 per ton Soybeans 0.70 0.80 per bu. Soybean hay 12.00 9.00 per ton
Oi1meal 2.10 2.25 per cwt. Timothy hay 9.00 6.00 per ton
860
The high producing herds not only received much heavier ra-tions than the others (one-half more total digestible nutrients per cow than the dual-purpose group and one-third more than the low producing herds), but they also received a more balanced ration in regard to protein and non-protein nutrients. In the main, however, all these dairymen were feeding balanced rations. Only 5 of the 51 herds were fed rations with a nutritive ratio' wider than 1 to 8.0, while one-third received rations with nutri-tive ratios narrower than 1 to 6.0. These farmers balanced their rations by feeding liberal quantities of legume hay as well as pur-chased protein supplements; those with the higher producing cows fed greater proportions of oats relative to corn and larger quan-tities of high-protein supplements.
THE OPTIMUM LEVEL OF FEEDING
The amounts of feed fed generally varied with butterfat out-put per cow, at least within the range found in this study. There was, however, a wide variation in the pounds of butterfat pro-duced per cow with each particular amount of feed fed. For example, there were 10 herds in which each cow was fed about the same number of pounds of total digestible nutrients (from 3,500 to 4,000) ; the five most productive of these herds averaged 229 pounds of butterfat per cow, as compared to 171 pounds in the five least productive; and the extreme variation among the 10 herds was from 286 to 160 pounds. This wide variation in but-terfat per cow at each level of feeding suggests that some of the difference may have been caused by the variation in the nutritive ratios of the rations or the proportion between roughages and concentrates.
'When corrections were made for these factors, however, there
still remained a wide variation in output per cow between herds, which indicates that there must be considerable difference be-tween herds in other factors such as the natural productivity of the cows, the amount of disease or the quality of the management.
(See fig. 2.) Sales per cow rose most rapidly as feed was
in-creased from 2,500 to 4,000 pounds, but declined after a total of 5,500 pounds digestible nutrients per cow had been reached.
Although butterfat output rose as feed was increased, returns
per $] 00 feed fed averaged lower with the heavier fed herds, as
shown in table 4.
Although feed is the most important single item, it is but one of several costs in butterfat production. The total amount of in-come left to pay labor, after all other charges are allowed, repre-• The nutritive ratio is the ratio between the energy in the dig<>stible crude protein and the combined energy found in the digestible carbohydrates and fat; the weight of
the fat in the ration being multiplied, for this computation, by 2.25 in order to
861
TABLE 4. BUTTERFAT OUTPUT PER COW AND RETURNS ON FEED AND FOR LABOR, BY AMOUNTS OF FEED PER COW.
Totallbs. digestible nutrients Pounds Dairy products re- Returns
fed per cow Number butterfat . turn per $100 per cow
berds per cow feed fed for labor
2000 to 2999 ...•... 11 160 $148 $10.90
3000 to 3999 ...•... 16 192 138 9.62
4000 to 4999 ...•..•... 14 233 141 15.85
5000 to 5999 ...•... 9 276 129 12.99
sents a more complete measure of profit. Feeding from 4,000 to 5,000 pounds of total digestible nutrients per COW, to herds
cap-able of responding to this level of feeding, gave the largest net labor income per cow in the years of this study. In years of more favorable butterfat prices, this level of feeding would probably have been higher.
Some farmers were underfeeding their cows, but under the un-favorable butterfat-feed and butterfat-hog price relationships of 1935 and 1936, there is evidence that several were overfeeding. ]'or instance, among the 17 herds in cow testing associations, the six herds which were fed over 5,000 pounds total digestible nutri-ents per cow (average 5,400) returned an average of $135 for each $100 feed fed, or $12.50 labor income per cow; while the 11 herds that were fed less than 5,000 pounds total digestible nutrients per cow (average 4,300) returned $154 for each $100 feed fed, or $21.18 labor income per cow.
One measure of the level of feeding is found in the pounds of concentrates per unit of product '.
This figure varied from 5 pounds in the dual-purpose group to 7 in the lo,\,,, producing herds, 9 in the medium group and 8 in the high producing herds."
The 15 herds which were fed the least concentrates per pound of butterfat yielded higher returns for feed and labor than did the nine herds that were fed the most concentrates per pound but-terfat produced, as is shown in table 5. The nine herds which were fed at the highest level, using the most concentrates per pound butterfat, got back only $118 for each $100 of feed fed. Certainly, as far as profit was concerned, these nine herds were overfed.
• Johnston, Floyd, Porter, A. R. and Arnold, F. J. Feeding dairy cows. Iowa Agr. Ext. Ser., Cir., 253. 1939.
G It should be kept in mind that in this study the figures on butterfat per cow are
based on actual butterfat sales, plus an estimated amount used in the home or fed to livestock; to be comparable with butterfat production per cow as used in cow testing association work it should be increased approximately 12 percent. On this basis these herds would have averaged respectively 4.4, 6.2, 8.1 and 7.0 pounds concentrates per pound butterfat from the dual-purpose to the high producing dairy group. This
statement is based on an unpublished study made at this station cooperatively by the Dairy Husbandry and Agricultural Economics Sections, in which production records together with the butterfat sales records of 209 cow testing association members were
400 :
i
!
I
, 0 3~O II
I 0I
~ 0 0 0 10 0-I
---
---0 0 0 , I/
0 0,
I
/
o . 0 0/ -
0 0 0 0 0 / ' 0 150 0 100 2500 3000 3500 400(1 4500 5000 5500 <0000TOTAL POUND:' Dlc;E5T1BLE NUT12IE.NT5 PEQ COIN
Fig. 2. Relationship between pounds of digestible nutrients fed per cow and butter-fat production per cow among dairy-type herds. High butterfat production requires
heavy feeding, but heavier feeding is not necessarily accompanied by proportionately heavier production or increased profits.
The exact proportion of protein feeds and the amount of con-centrates that will give the greatest return depends on three principal factors: The inherent productivity of the cows, the ability of the operator and the price relationships between
dif-ferent types of feeds and between feeds and butterfat.' Forcing either dual-purpose or strictly dairy cows to highest possible
TABLE 5. CONCENTRATES FED PER UNIT OF OUTPUT AS RELATED TO BUTrERFAT OUTPUT AND RETURNS. THIRTY-SIX DAIRY HERDS,
NORTHEASTERN IOWA, 1935-36.
Average Dairy
pounds Pounds Feed producta Labor
Pounds concentrates Number concentrate butterfat value return income
per lb. butterfat herds per lb. per cow* per lb. per $100 per cowt butterfat butterf.tt feed fedt
Under 7 ... 15 5.4 217 .25 SI51 $20.93 7 to 9 ...•... 12 7.9 255 .27 143 16.16 Over 9 ... 9 11.3 217 .31 118 0.56
• The differences between the averages of the three groups are not great enough to be statistically significant.
863
physical output is not likely to yield highest net returns either
from the dairy cattle or from the whole farm.
SUBSTITU'l'ING ROUGHAGES FOR CONCENTRATES IN THE
MILK COW RATION
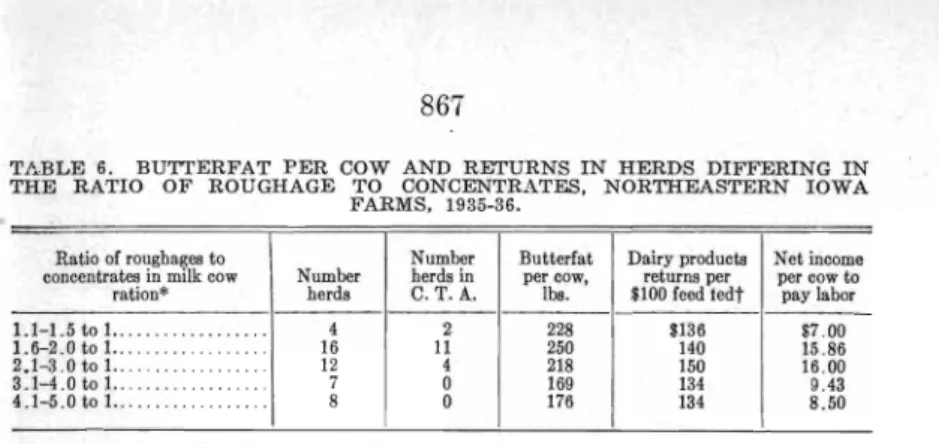
What is the range within which a farmer may shift the propor-tion of roughages to .grains in the milk cow ration without falling seriously below maximum profits on the dairy enterprise ~ In an effort to throw some light on this question, the strictly dairy herds were divided into five groups according to the proportion of digestible nutrients fed in these two forms. The results are shown in table 6. ·In these herds the combination of roughages
and concentrates which appeared to be most profitable was
be-tween 2.1 to 3.0 pounds of digestible nutrients of roughage fed
for each pound digestible nutrients in concentrates. Those
farm-ers feeding from three to five times as many digestible nutrients in the form of roughage as in concentrates averaged the least but-terfat per cow, the lowest returns for feed and the lowest wages for labor used. When the individual herds within each of these groups are examined, a great variation in performance is found. 'rhus, although the heavy rougkage herds as a group were the least profitable, the two top herds in this group were
consider-ably more profitable than some of the herds in the "medium
row,ghage group" or the "low roughage group," demonstrating
that it is not necessary to stick to a rigid proportion of roughage~
to concentrates in order to make satisfactory returns.
Of course the most profitable proportion of roughages to con-centrates for milk cows on any farm is an individual problem. These averages and ranges, however, may be useful as a guide.
Under average price relationships few dairymen would want to
go "heavy roughage" beyond the proportion of 4 pounds of
roughage digestible nutrients to 1 pound of grain and protein digestible nutrients. An example of this extra "heavy
rough-age" ration would be 800 pounds grain, 100 pounds protein sup·
plement, 3 tons silage, 2 tons hay and 1;4 ton corn stover per cow, or about $2.50 to $3 worth of roughages (including silage) to $1 worth of concentrates. This does not take into consideration
the pasture fed.
Only under exceptional circumstances would it pay an Iowa dairyman to go "heavy grain" much beyond the proportion of 1% pounds of digestible roughage nutrients to 1 pound of
con-1 Johnston. Floyd, Porter. A. R. and Arnold F. J. op. cit.. p. 18: "Another good
rule is to feed 7 pounds of grain daily for each pound of butterfat produced."
Page 9: "The feeder should strike the level of feeding where the cow is producing
at her economical maximum without injury to herself or without putting on fat."
Page 3: "The profits from a dairy herd depend mainly upon the cow herself and
upon the feeding, care and management which she receives. Her own ability is
864
centrate nutrients. An example of a ration with this combina-tion of roughages and concentrates is 1,600 pounds grain, 200 pounds protein supplement, 2 tons silage and 1% tons of hay per cow or less than $1 worth of roughages fed for each $1 of concentrates."
RELATIONSHIP OF QUANTITIES OF FEED PER COW TO
RETURNS PER $100 OF FEED FED
'rhe regression curves in fig. 3 throw interesting light on rela-tionships of quantities of feed fed per cow per year to output per cow and to the returns per $100 of feed fed-under the prices of
1935-36. In general, butterfat output increases as more feed is
consumed per cow. But there is a tendency for the rate of in-crease to become less as more of each individual type of feed is fed. As grain or protein supplements per cow were increased, the amount of butterfat per cow rose at first but later became prac-tically constant at high rates of feed input." In the case of the roughage feeds butterfat sales per cow were actually smaller where the cows were fed the greatest amounts of these feeds. Such a decline in output may be caused by these bulkier feeds displacing some of the grain or protein supplements. With the lowest grade (" other") roughages, chiefly straw and corn-stalks, there was a clear negative relationship to production throughout the whole range of quantities fed.
The strongest influence on production per cow is exerted by the
amount of grain fed. (See appendix B.) Second in importance
is the amount of silage, while the amount of "other roughage"
(straw and corn stover) exerts a strong negative influence.
The value of dairy products per $100 worth of feed is affected by the production per cow, by the amounts of each type of feed and by the skill with which the farmer selects those feedstuffs
with most favorable prices per unit of n~trients.
It was said above that as each individual feed is increased in quantity, the butterfat sold or home-used per cow increases with it up to some maximum and then either remains constant or in
some cases actually declines. The regression curves of returns
per $100 of feed, however, cannot remain at the maximum level
if feed is further increased; but after such a point is reached,
must actually decline. Further (as shown in fig. 3) the
down-"Among common feeding stuffs the totsl percentage of digestible nutrients is as follows:
Corn. dent. grade 3 ... _ .. _ .. ___ ._ ... 79 Alfalfa hay __ ... __ ... _ .... _ .... _ 50 Corn silage ... ___ .... ___ ... __ 21 Clover hay ... _ .. _._._ ... ___ 54 Oats ... _ .... ___ ... ____ . ___ 71 Cottonseed meal. 41% protein .. _ 74
"It should. of course. be borne in mind that the relationships shown in fig. 3 are
based on data from a sample of only 36 dairy enterprises. and that the variations
be-tween farms were quite wide with some of the factors. The data, however, represent
averages of the performance of these farms for the 2 years 193& and 1936. increas-ing stsbility of the data considerably over those of a single year.
For the general method used in determining these regression curves see Ezekiel.
t2ETUt2N5 PEI2
$100 FEED '20
POUNDS BUTTE.RFAT t?:ETUI2NS PEf2
PEE COW $100 FEED
POUNDS BUTTEl2FAT PEI2 COW rr~ +2 50 '10 1 - ---r-- ,_ ... -
--
---- Z5V
/
r---..
V
V/
"- Av';7
f - - Z5 10 25~
-...--
----
l
--~-"~ Av 10 25 -k ~ ~7'50 1000 IZ5t1 1590 I7~O eooo e250 2500 0 100 ZOO ~ 400 ':>00 1000 700
LB G12AIN PEE COW LB PQQTEIN SUPPLEMENT-UNDE~ 25'7. f.'l.'QTE1N-PEE CClVl
+20
.
.,--
f - - ---
5 +I 0 Z5/ '
I---- - f---1-- --Av ---r----r----r----
.
---
-
---
~f--t---
-... A,--
I'--10 25 -I 0 --+ eo -'"I
II
, ~ ~o ~ 100 ISO 200 250 300 3:,0 2000 3000 4000 Ij()()() ~ 700.:> tIOOO 400(1
LB P"OTEIN 5UPPLEMENT-OVEI2 e5% P120TEIN PEI2 COW LB SILAGE PEI2 COW '"'" +20 "0 2' ' I 0
-=--.:::-V--
""---v
v
""
---
Av ...,;::.=::::::-...
, ,-
~
-10 ~ 5 ,-I 0 25 -ro -50 -20 1500 2000 2500 3000 3500 4000 0 ~ 1000 1500 2.000 e500LB LEGUME HAY PE" COW LB. NON-LEGUME HA'i P[l2 CON
= 50+20 +10 2.5+10
~
'v
~ :::::::::-'10 -Av Av Z5 -10 -20 50 -'ZO o !)()() 1000 1500 2000 2500 I~ 17? 200 zes esc 275 300 ;25LB OTHEI? 120UGHAGE5 pEI2 COW LB BU'TEP.FAT OUTPUT PEl? COW LEGEND
- - - -e.LJTT r.eFA"J PE2 COIN
- - -I2[TUeN5 PEE' ~100 '"E.ED
Fig. 3. Relationship between amount of feed fed per cow and butterfat production
per cow.
High butterfat production requires heavy feeding, but heavier feeding is not always
accompanied by proportionately heavier production.
turn in returns per $100 of feed occurs even before the
produc-tion per cow reaches its highest point.· Each added pound of feed
means an extra cost. Therefore, in order to maintain returns per
$100 of feed it would be necessary not only for th~ butterfat per cow to increase but to increase as rapidly as the added cost. This
explains why returns decline before butterfat production has
866
In the case of the "other roughage" (straw and corn stover) there appeared to be definitely higher returns per $100 of feed where a small amount of such roughage was fed over the farms feeding none. The reason is not altogether clear, but it is thought that the greater return may have come from using these cheap roughages to replace small amounts of more valuable feeds in the rations of dry cows. Under these conditions it is pos':lible to sub-stitute lower grades of feed, at least to a limited extent, and not decrease the subsequent butterfat output as much as the saving in feed value.
Butterfat output and returns on feed may vary for reasons other than differences in amounts of feed. There are differences also in the way the cows are fed. Sometimes higher feed disap-pearance merely means a waste of feed. The way in which the cows are housed and cared for may result in variations in pro-duction, and finally there are likely to be differences in the ef-ficiency with which different cows convert feed into butterfat. Consequently, it was noted that the returns per $100 of feed dif-fered with the butterfat output, even after the variations in amounts of feed had been taken into account. The eurve of re-grcssion of this influence on returns is shown in fig. 3, and when this regression was used to correct the remaining variations in returns 10 there was a further appreciable reduction in size of the standard error of estimate, as shown in table B-l.
The relationship between butterfat output per cow and varying amounts of individual feeds tends to assume the form of a curve, as was shown in fig. 3. But the curvature of these regression lines may be caused, at least partly, by the varying proportions among feeds in the ration rather than by the varying total amount of feed. "When the butterfat output per cow was compared to varying amounts of total digestible nutrients 11 it was found that
this regression conformed more nearly to a straight line for the greater part of its range. There was, however, a tendency for the butterfat output to increase more rapidly with added feed at the lower end of the range (from approximately 2,800 pounds of digestible llutrients up to 3,500) than at higher feeding levels. There was also a well-defined flattening out of the regression line at about 5,000 pounds of digestible nutrients. The small number of cases, however, prevents us from considering this as conclusive evidence of diminishing physical output. The regres-sion curve of returns per $100 of feed resembled that of physical output on total digestible nutrients, except that economic returns tended generally to decline with heavier feeding (at existing feed and butterfat prices.) Here also, the negative slope became much
10 Remaining variations mean the errors of estimate (X~X), i.e., the differences be-tween the actual returns per $100 of feed and the corresponding returns estimated
from the regression curves (except the curve on output per cow) shown in fig. 3. 11 With correction for the variation in nutritive ratio as among herds.
867
TABLE 6. BUTTERFAT PER COW AND RETURNS IN HERDS DIFFERING IN
THE RATIO OF ROUGHAGE TO CONCENTRATES, NORTHEASTERN IOWA FARMS, 1935-36.
Ratio or roughages to Number Butterrat Dairy products Net income
concentrates in milk cow Number herds in per cow, returns per per cow to
ration* herds C.T.A. lba. $100 reed fedt pay lahar
1.1-1.5 to 1.. .. .......... 4 2 228 $136 $7.00
1.1>-2.0 to 1.. 16 11 250 140 15.86
2.1-3.0 to 1.. .......... 12 4 218 150 16.00
3.1-4.0 to 1.. 7 0 169 134 9.43
4.1-5.0 to 1. .... 8 0 176 134 8.50
'On basis of pounds of total digestible nutrients.
tThe variation within each of the five groups is so great that the differences between
averages are not statistically significant.
more pronounced as the feed input rose above 5,000 pounds of
di-gestible nutrients per cow.
The falling off in physical and economic returns among the
heavily fed herds was probably caused by a combination of
sev-eral influences. In the first place, there may have been wasteful
feeding among some of these herds, although, from observation,
this influence seems likely to be small. Second, there may have been some difficulty in keeping cows in good health and on full
feed with the heaviest rations. Third, in some of the heavily fed
herds some of the feed may have gone to produce added weight
on the cows rather than added butterfat. Finally, in some of the
heavily fed herds the cows may have been fed more than
neces-sary when they were dry.
LABOR REQUIREMENTS ON THE DAIRY
According to detailed labor records kept on 10 of these farms,
total man labor on the dairy enterprise averaged 143 hours per
cow per year. Milk cows used 131 of these hours, while 12 hours
per milk cow were used in taking care of the young stock. The
total chore labor on the milk cows averaged 22 minutes per day
for each cow, including milking, taking cows to pasture, cleaning
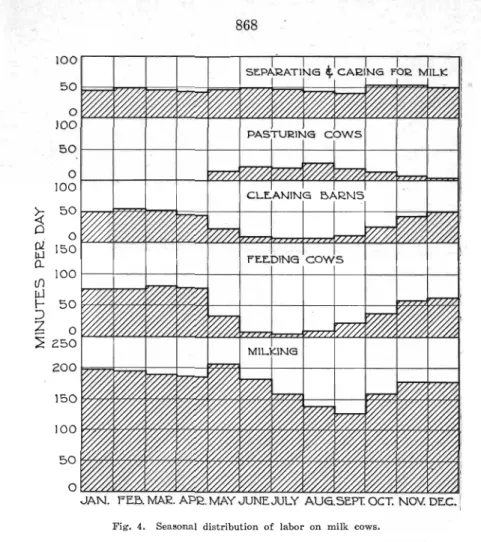
the barn and caring for the milk. Figure 4 shows the distribu-tion of chore labor on the milk cows by months.
Milking required approximately 13 minutes per cow per day or 0.5 minutes per milking. The total labor used for milking was relatively constant throughout the year except that several cows
were turned dry in the latter part of the summer on most farms, thereby reducing the labor from July to September. The average time required for milking 13.8 cows varied from over 3 hours per day in the winter and spring to about 2 hours and 20 minutes in the late summer.
Separating and caring for the milk required approximately
%
of an hour per day throughout the year. Feeding the cowsvaried from 5 minutes per day in the summer to 1% hours
868 100 50 0 100 50 0 100
~
50 C) 0 III 150 tL.J 0-if) 100 ILl I- 50 :Jb
0 ::?: 250 200 150 100 50Fig. 4. Seasonal distribution of labor on milk cows.
factor in the summer but amounted to
%
of an hour per day during late fall, winter and early spring. Getting the cows to and from pasture required 15 or 20 minutes per day from May to November. Total labor per cow varied from 19 to 25 minutes per day. When expressed per pound of butterfat, labor on the milk cows amounted to 36.6 minutes and labor on the youngcattle to 3.6 minutes, a total of 40.2 minutes per pound.
COSTS PER POUND BUTTERFAT
As between farms with varying amounts of production per cow, increased amounts of feed and other costs were associated with increased production of butterfat, but expenses other than labor increased almost as fast as production. Costs per pound
869
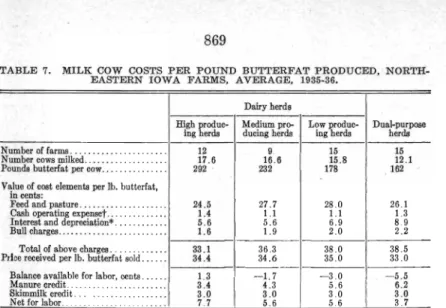
TABLE 7. MILK COW COSTS PER POUND BUTTERFAT PRODUCED, NORTH-EASTERN IOWA FARMS, AVERAGE, 1935-36.
High produc-ing herda Number offarma ... 12 Number cow. milked ... 17.6 Pound. butterfat per cow ... 292
Value of coot elements per lb. butterfat,
in cents:
Feed and paature ... 24.5 Caah operating expenset ... 1.4 Interest and depreciation" ... 5.6
Bull charges ... 1.6 Total of above charges ... 33.1 Price received per lb. butterfat .old ... 34.4 Balance available for labor, cents ... 1.3 Manure credit ... 3.4 Skimmilk credit. .. ... . . .
.
. 3.0Net for labor .. 7.7 'On breeding stock, buildings and equipment. tSee table 2.
Dairy herd.
Medium pro- Low produc- Dual-purpooe ducing herda ing herda herda
9 15 15 16.6 15.8 12.1 232 178 162 27.7 28.0 26.1 1.1 1.1 1.3 5.6 6.9 8.9 1.9 2.0 2.2 36.3 38.0 38.5 34.6 35.0 33.0 -1.7 -3.0 -5.5 4.3 5.6 6.2 3.0 3.0 3.0 5.6 5.6 3.7
herds are shown in table 7. Total cost per pound of butterfat for all major elements except labor was practically the same in the dual-purpose and the low producing dairy groups. 'fhe 12
high producing herds had from 3 to 5 cents lower costs per pound butterfat. Deduction of the charges given from the selling price per pound butterfat leaves the portion to pay for labor. Sub-traction of these charges, however, resulted in a deficit in all
groups except the 12' high producing herds, where the margin
available to pay for labor averaged 1.3 cents per pound butterfat." 12 The question is likely to be raised: What was the total cost per pound of butterfat in the herds studied, and what percentage of this total was composed of each type of expense. A little reflection will show that this is an unanswerable question. Thus, it has been said that (on the 10 farms keeping labor records) an average of 131 hour.
of labor were used per milk cow per year. Most of this consisted of work done by the farmer himself or by members of his family and did not represent any actual cash outlay. What was this labor worth? The only intelligent answer is that it was worth whatever the farmer could get out of it. A large fraction of this labor on the
cows was expe:nded during the winter season when there was little or nothing else
that could have been done to yield an income, and there were relatively few
oppor-tunities for employment off the farm. Hence, any rate of valuation per hour applied
to this labor could only be arbitrary, and since arbitrary, could not furnish guidance to the farmer in his business policy.
If, however, it is desired to get some rough idea of the relative importance of the
different production factors used by the milk cows, it may be stated that at 15 cents per hour the 131 hours of labor per year would amount to 8.4 cents per pound of but-terfat if applied to the average rate of output (232 pounds per cow per year) of the medium producing herds. (Iowa farm wage rates without board in 1936 were from $30 per month in January to $38 in July, or from 12 to 15 cents per hour.) Added
to the valuation of 36.3 cents per pound of butterfat for the cost factors shown in table 7, this would yield a total of 44.7 cents per pound. At these rates, labor would
comprise 19 percent of the total given, and feed and pasture valuations would amount
to 62 percent. If. however, the labor were valued at 10 cents per hour, it would appear
to be worth 5.6 cents per pound of butterfat and the sum of "costs" would amount to 41.9 cents per pound. At this rate labor would comprise 13 percent, and feed and pasture would amount to 66 percent. It should be pointed out that the figures in table
7 do not include valuations of all services other than labor used by the dairy enterprise, since some small items such as use of horse labor. light. power. etc .. are not included.
Also. it should be recognized that valuations of such items as interest and depreciation on buildings, etc., are in the same ambiguous position as the valuation of labor. A further obstacle in the way of computing costs per unit of butterfat is found in the fact that butterfat is not the sole product but is produced jointly with beef and veal.
TABLE 8. FEED REQUIREMENTS PER POUND BUTTERFAT BY LEVEL OF PRODUCTION, NORTHEASTERN IOWA FARM, AVERAGE PER
FARM, 1935-36.
Dairy herds
High produc- Medium pro- Low produc- Dual-purpose
ing herds ducing herds ing herds herds I I 1
Number of farms ... .... ... 12 9 15 15
Number cows milked ... .. ... 17.6 16.6 15.8 12.1
Butterfat per cow, lbs ... 292 232 178 162
Pounds feed to milk cows per lb.
butter-fat produced: Corn ... ... . .. ... 2.6 4.2 3.8 2.7 Small grain ... 3.2 3.1 2.1 1.7 Protein supplements" ... : : : : : .. 2.1 1.7 1.0 0.5 Total concentrates . . .. .... 7.9 9.0 6.9 4.9 Silage ... .. ... . .. ... 24.8 23.7 22.7 16.4 Legume hay.. .. ... ... 11.4 12.1 13.6 16.2
Other dry roughage .... ... .... 0.9 4.1 8.1 9.7
Total pounds ... 45.0 48.9 51.3 47.2
Total T. D. N.'s per lb. butterfat ... 17.0 19.4 20.5 20.0
Income from two important dairy products, however, has been omitted so far. Most dairymen in this area count strongly on the skimmilk produced for hog protein. 'When figured on the basis of protein prices during 1935 and 1936, the dairy should be credit-ed with about 3 cents worth of skimmilk for each pound of but-terfat produced. Further, manure produced by the dairy cattle i~ a valuable fertilizer when properly cared for and applied to the land."
When credits for skimmilk and manure are included, the mar-gin of production value over expenses and feed left to pay labor amounted to about 8 cents per pound of butterfat in the high producing group and to about 4 cents in the dual-purpose herds. It should be kept in mind that these figures are averages for groups of farms. There was about as much difference between individual herds within each group as there was between aver-ages of the four groups.
How much of the various kinds of feed is used per pound butterfat 1 These amounts vary with different levels of produc-tion. The average dual-purpose herd used about 5 pounds con-centrates, 16 pounds silage, 16 pounds hay and 10 pounds corn stover for each pound of butterfat sold or used, while the medium producing dairy cows used about 9 pounds concentrates, 24 pounds silage, 12 pounds hay and 4 pounds corn stover. The total pounds feed varied from 45 to 51.3 for each pound of but-terfat or from 17 to 20 pounds of total digestible nutrients.
1'3 See appendix (A) for an explanation of the method used in computing manure credits.
}.'eed requirements per unit of product were similar to those found in studies in other states."
HOURS WORK PER POUND BUTTERF'AT
On the 10 farms which kept detailed labor records, the man labor used on the milk cows averaged 36.6 minutes per pound butterfat. If the labor on the young dairy cattle were added, this would be increased to 40.2 minutes per pound butterfat.
If was not possible in this study to determine the labor costs
(in minutes per pound of butterfat) at different levels of pro-duction. It has been shown many times, however, that labor re-quirements per unit of product decrease at higher leveLs of pro-duction."
Total dairy rredits ranged from $101 per cow in the dual-pur-pose herds to $145 per cow in the high producing group as shown in table 9. After all expenses were deducted from the total
in-come from both the milk cows and the young stock, varying
amounts were left over to pay for labor. These amounts varied
from about $21 per cowan the high producing herds to $3 on
the dual-purpose herds before any credit was allowed for manure. After adding manure credit, margins for the same groups
amounted to $31 and $11, respectively. Basing the labor
require-ments on the detailed records kept in this study, wages earned
" (a) Mighell found the following pounds feed required per pound butterfat produced
on 239 farms in northeastern Iowa in 1923. Total concentrates 14.4 pounds;
silage, 21.8 and dry roughages, 19.8. Iowa Agr. Exp. Sta., Bul. 243: 88-97.
(b) Munger, in a study of 58 farms in Cerro Gordo County, Iowa, in 1921 found
the following feed requirements per pound butterfat: Concentrates, 9.8
pounds; silage, 29.3 pounds and dry roughages, 28.0 pounds. Iowa Agr. Exp. Sta., Bul. 197: 348-50.
(c) According to a summary of 123 Michigan dairy herds in 1936, the total feeds
required per pound butterfat were: Concentrates, 6.5 pounds; silage. 12.4
pounds and dry roughages, 11:5 pounds. Dairy costs. Mich. Agr. Exp, Sta.,
Mimeo F. M. 205. August, 1937.
(d) Grady and Bugby in a study of 33 Ohio dairy herds found the average feed
requirements per pound butterfat to be 6.0 pounds concentrates, 21.4 pounds silage and 9.9 pounds dry roughages. Grady, R. r., and Bugby, M. O. Dairy
production in Ohio. Ohio Agr. Exp. Sta., Bul. 334. 1919.
(e) According to a report prepared by Ranney and Pond on southeastern Minnesota
farms in 1936. the average feed requirements per pound butterfat were: Con-centrates, 6.6 pounds; silage, 29.1 pounds and dry roughages, 16.4 pounds or
18.05 T.D.N.'s per pound butterfat. Ranney, W. P. and Pond, G. A.
An-nual report. farm management service. southeastern Minn. Minn. Mirneo
Report 83, Minn. Div. of Ag. Econ. 1937.
,. (a) According to a summary of 126 Michigan dairy herds for 1936, labor costs
de-creased 4.6 cents per pound butterfat from the low to the high producing group
of herds.
Butterfat per cow, pounds ... 1 211 284 326
Number of herds .. _... . ... _ ... _ ... 1 8 21 30
Man labor per pounds b. f., minutes ... 1 32 27 29
Labor cost per pound b. f., cents ... 13.4 11.2 12.0
Dairy costs. Mich. Agr. Exp. Sta .. Mimeo. F.M. 205. August, 1937.
374 45 22 9.2 431 19 21 8.8
(b) Selby and others, in a summary of 73 published reports of dairy studies in the
United States, found that the value of Jabor per 100 pounds milk
de-creased from 90 cents in the low producing herds (below 5,000 pounds milk
per cow) to 86 cents in the 5,000 to 5,999-pound group, to 74 cents in the 6,000
to 6,999-pound group, to 63 cents in the group of over 7,000 pounds per cow.
Selby, H. E., Burrier, A. S. and Brandt, P. M. Costs and efficiency in
TABLE 9. INCOME AND EXPENSES ON THE DAIRY ENTERPRISE,
NORTH-EASTERN IOWA FARMS, AVERAGE PER FARM, 1935-36.
Dairy herd.
High ~roduc- Medium pro- Low produc- Dual-purpose
ing erda ducing herds ing herd. herd.
Number offarms ...••... 12 9 15 15
Number cows milked ... 17.6 16.6 15.8 14.1*
Butterfat per cow ...••...•• 292 232 178 162
Pounds beef per cow ...•. 546 443 478 711
Income per cow:
Dairy product sales ... $96.23 576.15 555.58 141.41
Dairy products used in home ... 3.47 4.04 3.78 4.33
Dairy products fed to livestock ... 9.23 6.87 6.50 5.74
Beef income and sale of breeding stock. 35.73 30.36 27.67 49.08
Tota!.. ... 144.66 117.42 93.53 100.56 Expenses per cow:
Feed and pasture, milk cows ...• 71.51 64.28 49.93 42.31
Feed and pasture, ot·her cattle ...• 25.28 19.99 14.20 35.56
Cash operating expenses . . . . . 4.00 2.64 2.01 1. 78
Bull charge ... 4.65 4.38 3.57 3.52
Interest and depreciationt ... 18.51 14.78 13.21 14 .64
Tota!. ... 123.95 106.07 82.92 97.81
Margin to pay labort ... 20.71 11.35 10.61 2.75
Returns per 5100 feed fed, milk cows§ .... 152 135 132 124 Re\urns per $100 feed fed, who!e
enter-prise§ ...•...••...•... 146 139 146 131
'Only an average of 12.1 cows per herd in this group were milk.d, two being kept
for nurse cows. The butterfat production per cow of 162 was figured on the hasis of 12.1 cows. All other items in this group were figured on the basis of 14.1 cows.
tInterest was figured at the rate of 5 percent on all capital invested in cows, bull,
dairy buildings and equipment. Depreciation was figured on the same items.
:j:The differences among the four groups have been tested statistically and found to be highly significant.
§The differences among the four groups have been tested statistically and found not
to be significant.
for labor varied from about 21 cents per hour in the high produc-ing herds, 15 cents pel' hour on the medium and low producing herds to about 8 cents per hour on the dual-purpose herds.
Since feed comprises the largest single cost in producing but-terfat, a dairyman is concerned with getting high returns for feeds fed. For each $100 feed fed to the milk cows alone on these northeastern Iowa farms, the total returns from the dairy prod-ucts varied from $152 to $124, respectively, from the high pro-ducing dairy group to the dual-purpose herds. ·When the income and expenses on the young stock are included in the enterprise, there is less spread between the foul' groups in feed returns, but the dual-purpose herds are still at the bottom of the list.
Since we have taken into consideration the returns on the young stock or the beef end of the enterprise, why have the dual-purpose herds shown so little profit ~ If the dual-purpose herds included in this study are at all typical, the loss in milk produc-tion that resulted from "beefy" cows as compared to cows of dairy type is not counterbalanced by the value of beef produced.
873
The majority of these operators with dual-purpose cows were not fattening the calves out to any very high degree of finish. Several carried the calves through to the stage of long yearlings mainly on roughage, then sold them as feeders or as medium butchers.'·
It is doubtful if calves without grain can make as profitable
use of roughage as can milk cows. Since these operators bought practically no grain, the grain produced on their own farms was not sufficient to fatten out the dual-purpose calves. If the farms included in this study are at all typical of northeastern Iowa con-ditions, then for the operator who has above average skill in dairying and who has a good market for butterfat- strictly dairy
cows, even medium producing ones, probably offer greater op-portunity than dURI-purpose cows.
,. Instead of being butterfat-beef producers these dual-purpose herds approximated more closely butterfat-feeder cattle producers.
APPENDIX A
DEFINITIONS AND METHODS OF COMPUTATION, CHARGES
AND CREDITS MADE IN THE DAIRY ENTERPRISE 1. Capital Investments:
a. Cows and b'<.ll: The average of the opening and closing inventory
values was used to represent investment in breeding stock
b. Special di1liTY equipment: This included separator, milking machine,
cans, buckets, strainers and other miscellaneous dairy equipment.
c. Btt·ildings and fences: The total value of the silo, the milk house,
and that part of the barn used by the dairy was charged to the dairy
enterprise. Ten percent of the fences were charged to the horses
and 45 percent each to the dairy and hog enterprises. No investments
were figured on the water system, electric system or bull pens.
2. Credits and Expenses:
a. Btttter/at sales: This iucluded only actual cash sales off the farm minus the hauling chargrs.
b. Dairy products used in the home: Included milk, cream and homemade butter. The amounts of these products were estimated and recorded
each month by the farmer.
c. Dairy products fed to livestock: Included skimmilk fed to calves, pigs
and poultry and in some cases whole milk fed to calves. The skim-milk was valued at the rate of 11h cents per gallon.
d. lIIamlll'e credit: It was assumed that 8 tons of manure per milk cow
were recovered and spread on the fields, and this was valued at the rate
of $1.25 per ton. See Morrison, F. B., Feeds and feeding. p. -417. The Morrison Pub. Co., Ithaca, N. Y., 1936; and Stephenson, W. H.,
Brown, P. E., Forman, L. W. and others. The economic value of
farm manure as a fertilizer on Iowa soils. Iowa Agr. Exp. Sta., Bu!.
236. 1926.
e. Bull charge: Interest was figured at 5 percent on the inventory value, and the replacement charge was figured at 5 percent per annum. The
only other charge made was for feed aud pasture which was figured at the same rate as that fed to the milk cows. In the higher producing herds the feed cost on the bull is less than that on the cows, but it was
assumed that the charges omitted, interest and depreciation on the bullpen, registration fees and labor charges would increase from the lower to the higher producing herds at about the same rate as the
in-crease in feed costs on the milk cows. Separate feed records were
not kept on the bull on these farms.
f. Depreciation on milk cows: Studies made by Dr. C. Y. Cannon, head
of the Dairy Husbandry Department at Iowa State College, show that in cow-testing association herds the average cow is kept in the herd 4 years. It was assumed that when the average cow is sold out of the herd her value as beef is 14 percent less than it was when she entered the herd 4 years before. This gives 3% percent of the inventory
875 APPENDIX B
TABLE B-l. CORRELATION OF QUANTITIES OF FEED TO BUTTERFAT OUT-PUT PER COW AND OF QUANTITIES OF FEED AND BUTTERFAT TO RETURNS PER $100 OF FEED TO MILK COWS. 36 NORTHEASTERN lOW A
FARMS, 1935-36.
A B e D E F G
lbs. lbs. lbs. lbs. lbs. lbs. lbs.
grain protein protein silage legume other other per supple- supple- per rough- hay rough-cow ment ment cow age age
under over 25% 25%
protein protein
- - - -- - - -
---correia tiOD coe IIicients
- - - -
--- ---
- - ----A ... . -.14 .34 -.14 .29 .19 .03 B ...•...•.. .57 .19 .51 -.35 -.27 C ... . .42 .46 -.22 - .28 D ... . .21 -.61 -.53 E ... . - .44 -.39 F ... . .62 G ... . H .... .
--- ---
- - ---- ---
- - - -1420 209 175 5480 2830 370 550 555 261 130 2949 775 547 512 Arithmetic averages . ... . Standard deviations ... .Standard partial regression
coefficients :
H on factors indicated .. . .517 .182 .104 .324 .026 -.003 - .300 X on factorS indicated .. . .149 .023 - .147 .029 -.454 -.239 - .423 Quantities of individual feeds as related to butterfat output per cow.
RH'ABCDEFG = .84, a H.ABCDEFG = 33.2
Curvilinear correlation.: tH'Ht = .90, (J H .}{ ~ 23.0
Quantities of individual feeds as related to returns per $100 of feed.
RX'AB( DEFG: = .56. (Tx 'ABCDEFG = 22.0
Curvilinear correlation*; rX'Xl == .78,Ux.x;. == 14.9
H X lbs. return butter- per fat $100 per of cow feed -- -- --
---.48 -.10 .33 -.11 .61 -.10 .49 .23 .50 - .19 -.38 -.20 -.54 -.37 .44 - - -- -. 230 142 55 24
After correction of residuals (x=i1 ) for curvilinear regres~ion (freehand) of these
residuals on butterfat output per cow; a second estimate of
x
when correlated with x yielded correlation coefficient and standard error of estimate as fol1ows:tx.~
=
.80, ax.X;=
14.2(*) See Fig. 3 for regression curve·s.
TABLE B-2. TOTAL DIGESTIBLE NUTRIENTS AS RELATED TO BUTTERFAT OUTPUT, AND TO RETURNS PER $100 OF FEED FED TO MILK COWS.
M Total digest.
nutrients Simple correlation coefficients
Total digestible nutrients per cow ... M ... Nutritive ratio of entire ration . ... N .. .. ... Arithmeti~ averages. .... ... ... 4293
Standard deviat-ions. ... 850
Multiple correlations
RH•MN = .76, a H.MN
=
37RX.MN = .47, a X.MN
=
22 Standard partial regression coefficientsIlHM.N = .42, IlHN.M
=
-.46 IlXM.N = -.47, IlXN.M=
-.44...
...
N H X
Nutritive Butterfat Return per ratio* per cow $100 feed
- .47 .64 - .27
. .... - .66
-
.22 6.49 230 142 0.94 55 24*The mean and standard deviation given for the nutritive ratio refer to the number of