Article
Potentiality and Limitations of Open Satellite Data
for Flood Mapping
Davide Notti1, Daniele Giordan1, Fabiana Caló2, Antonio Pepe2, Francesco Zucca3, Jorge P. Galve4 1 National Research Council of Italy, Research Institute for Geo-Hydrological Protection (CNR-IRPI), Torino,
Italy; [email protected], [email protected]
2 National Research Council (CNR) of Italy—Institute for the Electromagnetic Sensing of the Environment
(IREA), via Diocleziano 328, 80124 Napoli, Italy; [email protected], [email protected]
3 Università di Pavia, Italy; [email protected]
4 Departamento de Geodinámica, Universidad de Granada, Spain; [email protected]
* Correspondence: [email protected]
Abstract: Satellite remote sensing is a powerful tool to map flooded areas. In the last years, the availability of free satellite data sensibly increased in terms of type and frequency, allowing producing flood maps at low cost around the World. In this work, we propose a semi-automatic method for flood mapping, based only on free satellite images and open-source software. As case studies, we selected three flood events recently occurred in Spain and Italy. Multispectral satellite data acquired by MODIS, Proba-V, Landsat, Sentinel-2 and SAR data collected by Sentinel-1 were used to detect flooded areas using different methodologies (e.g., MNDWI; SAR backscattering variation; Supervised classification). Then, we improved and manually refined the automatic mapping using free ancillary data like DEM based water depth model and available ground truth data. For the areas affected by major floods, we also validated and compared the produced flood maps with official maps made by river authorities. We calculated flood detection performance (flood ratio) for the different datasets we used. The results show that it is necessary to take into account different factors for the choice of best satellite data, among these, the time of satellite pass with respect to the flood peak is the most important one. SAR data showed good results only for co-flood acquisitions, whereas multispectral images allowed detecting co-flooded areas also with the post-flood acquisition. With the support of ancillary data, it was possible to produce reliable geomorphological based flood maps in the study areas.
Keywords: flood mapping, Multispectral, SAR, free satellite data, Ebro basin, Po basin 1. Introduction
In the last years, the increased availability of free-of-charge satellite data allowed studying many natural or human-made processes at low-cost and boosted the research in many fields [1–4]. For instance, the Sentinel satellites constellation of the Copernicus program of European Union [5] provides Synthetic Aperture Radar (SAR) and multispectral data with global coverage, high-frequency pass, and high spatial resolution. Other examples of free remote sensing programs are Landsat, which has provided data since 1972 [6], and the MODIS daily satellites giving multispectral images [7]. These data are often available with the first level of atmospheric or radiometric calibration, allowing their use by different types of users and not only by the expert remote sensing processing community. Example of user-friendly data portal is the Worldview [8] service for the visualization of MODIS products or the G-Pod service of ESA, which allows the on-line processing of ENVISAT and Sentinel-1 SAR data [9,10]. Also, some plug-ins of free GIS allow to download and process free multispectral satellite images [11].
Every year, flood events cause great economic losses and victims [12]. For this reason, precise flood mapping and modeling are essential for the flood hazard assessment [13], damage estimation
[14] and sustainable urban planning to properly manage the flood risk [15]. In such a context, satellite remote sensing is currently a low-cost tool which can be profitably exploited for flood mapping [16–
18].
Extraction of flooded areas can be carried out by using multispectral satellite data and their derived indexes [19–24], SAR images [25–31], or a combination of these data [32]. Other types of satellite data can be useful to improve flood mapping. For instance, the digital elevation models (DEMs) derived from satellite data (e.g., SRTM, ASTER) were also used to estimate flood-prone areas or to improve a SAR/multispectral data based-mapping [33–36]. Also water storage data from GRACE satellite [37] or soil moisture data from ASCAT [38] were used to derive flood indicators. Each remote sensing technique for flood mapping presents advantages and drawbacks [39] that need to be evaluated on a case by case basis.
The frequent pass of satellites and the availability of rapid processing chains allowed the development of services providing automatic and quasi-real time flood mapping: e.g., the Copernicus Emergency Management Service (EMS) carried out by the European Union [40,41], the Global Flood Detection System [42,43] or the NASA Global Flood Mapping System [44]. However, these services provide rapid mapping products which may be affected by uncertainty and not always validated [45]. On the other hand, maps of flooded areas produced by official authorities and based on demand aerial photos and field surveys are more accurate although they are time-consuming and require higher costs to be generated. It is also essential to take into account that the flood mapping may be affected by uncertainty related for instance to hydraulic models or the resolution of DEMs [46].
In this work, we present a multi-sensor, low-cost and user-friendly approach for flood inundation mapping. In particular, we combined automatic and manual approaches for the flooded areas detection and created rapid and accurate maps by integrating satellite images with DEMs and ancillary data. For our study, we focused on flood events occurred in Spain in 2015 and 2017 and Italy in 2016. We also focused on the factors that limit, or help, the capability of flooded area detection. The produced flood maps were compared and validated with official maps and Copernicus EMS.
2. Description of the study areas
The study aims to test the capability of the satellite data for flood mapping. The first thing that we have considered is the main flood characteristics: the extension of the flooded areas, the length of the rivers segment examined and the temporal evolution of flood. This information drives the choice of the available satellite data and data processing to be used.
The three selected cases studies, located in the Ebro River Valley and Arahal in Spain and the Po River basin in Italy (Fig. 1), are representative of different situations regarding remote sensing images, ancillary data, geomorphology and land-use.
The cases of Ebro valley and Po basin floods are representative of rivers with a wide floodplain where the flood peak needs from many hours to several days to transit along the river length, and the inundated area can reach the width of some kilometers. This type of flood is more prone to be mapped by satellites because of its spatial and temporal scale. Also the availability of ancillary or field data is higher for the main river. The case of Arahal is representative of flash-flood processes usual in semi-arid and hilly environments that have rapid temporal evolution and limited flood area extension. In this case, the mapping with satellite data is less straightforward.
2.1. The February-March 2015 flood in Ebro valley (Spain)
river reached a maximum discharge of about 2600 m3/s in Zaragoza gauge (the flooding threshold is about 1500 m3/s, and the mean discharge of Ebro river for March is 400 m3/s). The flood severity was estimated about 10-years return interval [47–49]. Large cultivated areas, some small settlements and linear infrastructures were inundated, resulting in severe damages [50]. The activation of Copernicus EMS EMSR-120 [51] allowed the automatic mapping of the flooded areas (delineation maps) using RADARSAT-2 data. In our study, we used Landsat-8, MODIS-Aqua/Terra, Proba-V and Sentinel-1 data for the mapping of flooded areas with the support of a DEM water depth model. The flood maps derived from remote sensing data were validated by using inundation maps and river discharge data available on the geoportal of the Ebro River Basin Authority [52].
2.2. The November 2016 flood in western Po river basin (Italy).
In the late November 2016, a severe flood hit the western sector of Po river basin that corresponds to Piemonte region (NW of Italy). This area, periodically affected by floods [53], has been already investigated with remote sensing technologies [28,32,36]. In the period 21– 25 November 2016, a heavy rainfall up to 50 % of the mean annual precipitation occurred in the western basin of the Po river and its tributaries, in particular, the Tanaro River. The Po River near Turin reached a maximum discharge of 2000-2200 m3/s in the late evening of 25 November 2016 while the mean discharge of the monitoring station in November is 70 m3/s. Po river reached a discharge of 9900 m3/s (November average 680 m3/s) after the confluence with Tanaro. The Tanaro river grew up to an estimated discharge of 3800 m3/s of Montecastello station (average discharge of 220 m3/S) [54]). As a result, inundation of cultivated areas, linear infrastructures and some urban areas like the Moncalieri town [55] occurred, with estimated damages of 50 M€. Also in this case, the Copernicus EMS (EMSR-192 [56]) was activated, allowing to produce automatic flood maps based on using RADARSAT-2 and Pleiades images in the most critical areas. In our work, we used data from MODIS-Aqua, Proba-V, and Sentinel-1/2 satellites with the support of a DEM. In particular, we selected the two areas most heavily affected by the flood: 1) The plain located around the Alessandria town (Fig. 1 B), inundated by the Bormida river on 25 November and by the Tanaro on 25-26 November; 2) The plain located at south of Turin city (Fig. 1 C) that was flooded by the Po river and the other tributaries (i.e., Chisola and Oitana streams) on 25 November. To validate our results, we used the flooded area maps made available by the Regional Environmental Protection Agency (ARPA is its Italian acronym) of the Piemonte region.
2.3. The November 2017 small flash flood near Sevilla (Spain).
Figure 1. Location of the study areas. Ebro river valley near Zaragoza, Spain, affected by the Ebro River flood in March 2015 (A); Po river basin, Italy, affected by flood in November 2016 with focus on the plain around Alessandria town (B) and at the plain at south of Turin (C); area around Arahal village, Sevilla, Spain affected by a flash-flood in November 2017 (D).
3. Materials and methods
In order to map flooded areas, different remote sensing data and methodologies were used considering the following criteria: I) type of data (SAR, multispectral); II) cost (i.e., we used only free-of-charge data); III) availability of data in relation to the flood phase (pre-flood, co-flood and post-flood); IV) spatial resolution; V) availability of support data (DEM or other ancillary data).
We collected: a) pre-flood data acquired before the inundation, used as a reference for the change detection analysis; b) co-flood data collected around the time of maximum inundation, and used for mapping flooded areas only with limited post-processing; c) post-flood data taken after the flood event. In this phase, water is in withdrawal, and the detection of flooded areas is carried out through comparison with pre-flood data, and supported by ancillary data. It is important to remind that co-flood data is relative to the segment of river considered: downstream or upstream the time and magnitude of flood peak are different. For instance, the flood waves of Po or Ebro rivers need several days to transit from upper to lower course.
In the case of Ebro valley and Po basin floods, we used river stage data to select the satellite data most suitable for our analysis. Figure 2 shows the evolution of hydrometric level during and after the flood events for Po river at Caringano gauge [58], Tanaro river at Alessandria gauge [59] and Ebro river at Zaragoza gauge [52], versus the satellite passes. Table 1 resumes the available satellite data used in each case study in relation to the time of flooding.
It is possible to observe for the case of Po and Tanaro rivers that the number of useful images acquired during the co-flood phase (about 12 hours) is limited, and most of the analysis was carried out by using post-flood data. In the case of the Ebro river valley, the long co-flood phase of March 2015 (2-3 days) allowed us to collect more co-flood data.
Table 1. Satellite data used in our study. Pr = Pre-flood images; Co =Co-flood images; Cp = partial co-flood images; Po = Post-co-flood images
Area of study MODIS Aqua /Terra
Proba-v
Landsat-8 Sentinel-2 A/B
Sentinel-1 A/B
Ebro flood Pr, Co Co Pr, Co, Po Pr, Cp
Po basin flood Pr, Cp Pr, Co Pr, Po Pr, Po
Arahal flood Pr, Po Pr, Po Pr, Cp
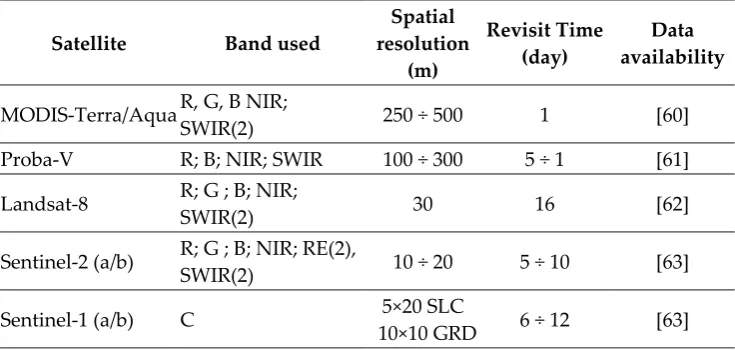
Table 2. Characteristics of the data used in our study
Satellite Band used
Spatial resolution (m) Revisit Time (day) Data availability
MODIS-Terra/Aqua R, G, B NIR;
SWIR(2) 250 ÷ 500 1 [60]
Proba-V R; B; NIR; SWIR 100 ÷ 300 5 ÷ 1 [61]
Landsat-8 R; G ; B; NIR;
SWIR(2) 30 16 [62]
Sentinel-2 (a/b) R; G ; B; NIR; RE(2),
SWIR(2) 10 ÷ 20 5 ÷ 10 [63]
Sentinel-1 (a/b) C 5×20 SLC
10×10 GRD 6 ÷ 12 [63]
Band name Wavelength interval
Blue (B) ~ 450-500 nm
Green (G) ~ 500-620 nm
Red (R ) ~ 620-700 nm
Red Edge (RE) ~ 700-750 nm Near Infrared (NIR) ~ 750-1400 nm Shortwave Infrared
(SWIR)
~1400-3000 nm
SAR- Band (C) ~ 5 cm
3.1. SAR data.
The main advantage of SAR satellites is given by their capability to acquire images also at night time and under all weather conditions, thus allowing filling the gap often resulting from cloudy-corrupted optical datasets.
Currently, Sentinel-1 constellation of Copernicus program is the only provider of SAR data, freely available through the Sentinel Scientific Data Hub [63]. The constellation is composed of two satellites, Sentinel-1A and Sentinel-1B, operating since 2014 and 2016 respectively. The twin satellites acquire C-band (central frequency of 5.404 GHz) SAR data all over the World, with a revisit time of 6 days. Such a short repeat cycle increases the chance to collect free co-flood data which allow mapping of the inundated areas accurately.
used two image formats: i) the Single Look Complex (SLC) are complex-valued images in the slant range by the azimuth imaging plane [65]; ii) the Level-1 Ground Range Detected (GRD) are images multi-looked and projected to ground range using an Earth ellipsoid model [66].
3.2. Multispectral data.
Compared to SAR sensors, the multispectral satellites are often limited by the presence of clouds, making more difficult to acquire co-flood data, as many times the maximum flood level is reached in cloudy conditions. On the other hand, the availability of many bands and the possibility to derive different spectral indexes (e.g., NDVI, NDWI) allow identifying flooded areas, also when the water is already withdrawn, by analyzing its effects on the soil. By the spatial resolution, it is possible to distinguish two classes of multispectral satellites: the medium-low resolution (100 m – 500 m) satellites like MODIS, Proba-V or Sentinel-3, and the medium-high resolution (10 – 30 m) satellites like Sentinel-2 or Landsat series.
3.2.1. Medium-Low resolution multispectral data.
Low-resolution data allow detecting floods that affect extensive areas. For our analysis, we used MODIS (Moderate Resolution Imaging Spectroradiometer) and PROBA-V (Project for On-Board Autonomy – Vegetation) data. MODIS is a system of two sun-synchronous, near-polar orbiting satellites called Aqua and Terra that daily acquire images all over the World [7], that can be visualized on NASA Worldview portal [67]. Terra collects images in the late morning while Aqua in the early afternoon; they also have a night-time pass when they acquire in thermal bands. We used the MYD09 (Aqua) and MOD09 (Terra) Atmospherically Corrected Surface Reflectance 5-Min L2 Swath 500m, [68] downloaded from the Level-1 and Atmosphere Archive & Distribution System (LAADS [60]). These products include seven bands (RGB; NIR and SWIR) with a spatial resolution of 500 m. We also downloaded 250 m spatial resolution Red and NIR bands MOD09/MYD09 through the SCP plug-in of QGIS [11] to calculate the NDVI.
MODIS images were used for the Po basin and Ebro areas, where co-flood data not affected by extensive cloud cover and post-flood data were available. In the Ebro valley, MODIS images were available for all the three flood events occurred in February-March 2015. The small area of Arahal is not suitable to be analyzed with the coarse spatial resolution of MODIS data.
For Ebro valley and Po basin floods, we also used data acquired by the ESA PROBA-V, mission launched in 2013 for vegetation monitoring [69]. The satellite has four bands (Blue, Red, NIR, and SWIR) with spatial resolution ranging from 100 m (revisit time of 5-6 days) to 300 m (daily revisit time). From the Proba-V portal of ESA [61], it is possible to download the NDVI and composite bands image. We used the Level 2A – Radiometrically corrected segments, projected in plate carrée, Top-Of-Atmosphere with 100 m of spatial resolution.
3.2.2 Medium-high resolution multispectral data.
The medium-high resolution satellites data allow accurate mapping of flooded areas although with a revisit time not shorter than five days. For our analysis, we used Landsat-8 and Sentinel-2 data.
Landsat-8, launched in 2012, acquires images with 11 spectral bands, a spatial resolution ranging from 15 to 100 m and a revisit time of 16 days. In particular, we used six bands (visible, NIR and SWIR) with 30 m spatial resolution. Level-1 data were downloaded from Earthexplorer portal of USGS [62] and used for the Arahal and Ebro case studies. For the Po and Tanaro flooded areas, no cloud-free images are available close to flood event, while we did not use Landsat-7 images because are affected by no-data strip.
on the RGB, NIR and SWIR bands (10 to 20 m spatial resolution; data were downloaded from the Sentinel scientific data hub [63]
3.3. Data processing, analysis and validation
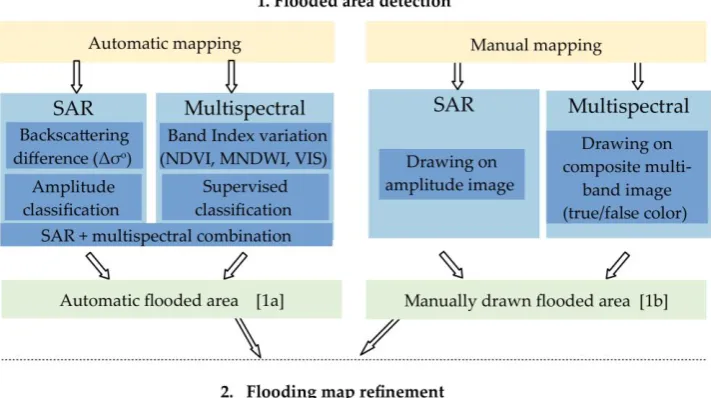
Figure 3 shows the methods and the procedures used for the flood mapping. The analysis is divided into three main steps:
• The first step is the detection of the flooded area that can be carried out using a manual or a semi-automatic mapping approach:
a) The manual mapping consists of the direct visual interpretation of the images (SAR amplitude or color combinations of multispectral bands). In this case, the flooded areas were directly manually drawn on the georeferenced satellite images in QGIS software.
b) With the automatic approach, we first produced an automatic flooded area map in raster format. The map is extracted from SAR or multispectral satellite data using different methodologies like band index, supervised classification or backscattering difference. • The second step is the map improvement and refinement. In this step, we use support data like:
a) water depth model derived from DEM, b) hillshade and aerial photo to detect the geomorphological features, c) ancillary data like georeferenced photos or document found on the web to have a ground truth of the flooded area extension. These data allow creating an improved version of flooded area maps both for the automatic or manual approach. The final version of the flooded area was manually drawn in QGIS software.
• The third step is the flood map validation. This step is carried out only when official flood maps or field survey maps are available. We use these maps to evaluate the quality of the flooded area maps and in particular the performance of automatic mapping (flood ratio and not flood ratio).
3.3.1 Manual mapping.
The manual mapping of flooded areas is made by drawing on a QGIS software the polygon of the flooded area directly on the georeferenced satellite image. The image is obtained with the composition of multispectral bands in true or false color. In the case of co-flood image, the identification is simple, while for post-flood data to create an enhanced color image was necessary to identify the traces of flooding. For the manual mapping of the flooded area, we try to use also the SAR amplitude images of the Sentinel-1 in GRD format, georeferenced with ESA SNAP software.
3.3.2 Automatic mapping based on SAR data processing.
• SAR Amplitude classification (SAR_AC). The calibrated SAR (amplitude) image was classified to identify the water covered area according to the criteria that soil covered by a quiet water table shows low amplitude and can be easily extracted from the image. We applied the classification to Sentinel-1 Ground Range Detected (GRD) product for the Zaragoza and Po basin areas. We also implemented a simple filter, available in the processing raster tool of QGIS software, to smooth local noise effects. Using empirical thresholds, we classified the available SAR amplitude image into three classes: a) low amplitude (< 50 / 70), i.e., water-covered areas (lakes or flooded areas) b) middle amplitude (50-150), i.e., cultivated land or natural vegetation; c) high amplitude (>150/200), i.e., dense urban areas or rocks. We used optical images to qualitative validate the accuracy of classification.
produced. For the classification of such map, we applied an empirical threshold to the Δσovalues allowing identifying as many flooded areas as possible and minimizing the false detection.
3.3.3 Automatic mapping based on multispectral images processing.
• Supervised classification (SC). We applied this technique to classify MODIS and Landsat-8 co-flood data. We first detected the most representative land cover types (i.e., water covered area, vegetation, cloud, snow, urban area/bare soil) in some training areas to create a spectral signature with the available bands. Then, we performed a supervised classification of the images using the SAGA-GIS. In particular, we tested different classification methods and selected the Maximum Likelihood and the Spectral Angle methods as the most appropriate for our study. Finally, using a raster query in QGIS, we extracted the “area covered by water or wetland”
category that mostly corresponds to the flooded area in our case.
• The Normalized Difference Vegetation Index variation (NDVIvar). We calculated the NDVI variation between the pre- and post-flood conditions (equation 1). The aim is to identify areas characterized by a decrease of NDVI values as a consequence of vegetation activity lowering (area covered by sediments) or presence of water covering the area [70,71]. We computed NDVI using the NIR and the red band of Sentinel-2 (10 m of spatial resolution), Landsat 8 (30 m of S.R.), Proba-V (100 m of S.R.) and MODIS data (250 m of S.R.):
𝑁𝐷𝑉𝐼𝑣𝑎𝑟 = 𝑁𝐷𝑉𝐼𝑝𝑜𝑠𝑡 − 𝑁𝐷𝑉𝐼𝑝𝑟𝑒 where 𝑁𝑁𝐷𝑉𝐼 =(𝑁𝐼𝑅−𝑅𝑒𝑑)
(𝑁𝐼𝑅+𝑅𝑒𝑑) (1)
• Modified Normalized Difference Water Index variation (MNDWIvar) and Normalized Difference Moisture Index variation (NDMIvar). These indexes allowing to detect water bodies or wetlands were widely used to map flooded areas [72]. In the literature, different combinations for calculating MNDWI are presented and discussed [73–75]. In our study, we used the Red Edge band - Short Wavelength Infrared bands (eq. 2a) for Sentinel-2 data (20 m of S.R.), and the Red and SWIR bands for Landsat-8 (30 m of S.R.), MODIS (500 m of S. R.) and Proba-V data. In case of co-flood data, the MNDWI is the index most suitable to detect water covered areas. The difference with a pre-flood situation allowed to better point out changes in soil moisture/water covered areas. The NDMI [76] is calculated by exploiting the NIR and SWIR bands and was used for the Arahal area (eq. 3).
𝑀𝑁𝐷𝑊𝐼𝑣𝑎𝑟 = 𝑀𝑁𝐷𝑊𝐼𝑝𝑜𝑠𝑡 − 𝑀𝑁𝐷𝑊𝐼𝑝𝑟𝑒 (2)
where 𝑀𝑁𝐷𝑊𝐼 =(𝑅𝑒𝑑𝐸𝑑𝑔𝑒1−𝑆𝑊𝐼𝑅)
(𝑅𝑒𝑑𝐸𝑑𝑔𝑒1+𝑆𝑊𝐼𝑅) or (2a) 𝑀𝑁𝐷𝑊𝐼 =
(𝑅𝑒𝑑 − 𝑆𝑊𝐼𝑅) (𝑅𝑒𝑑 +𝑆𝑊𝐼𝑅) (2b)
𝑁𝐷𝑀𝐼𝑣𝑎𝑟 = 𝑁𝐷𝑀𝐼𝑝𝑜𝑠𝑡 − 𝑁𝐷𝑀𝐼𝑝𝑟𝑒 where 𝑀𝑁𝐷𝑊𝐼 =(𝑁𝐼𝑅−𝑆𝑊𝐼𝑅)
(𝑁𝐼𝑅+𝑆𝑊𝐼𝑅) (3)
• Variation of averaged visible bands (VISvar). This index allows detecting the reflectance variation induced by the presence of silt deposits on crops field. The index is based on the averaging of the RGB bands (eq. 4). We derived this index from the Sentinel-2 data (S.R. 10 m) acquired over the Tanaro and Po area, allowing pointing out the sediment deposits.
VISvar = (𝑉𝐼𝑆𝑝𝑜𝑠𝑡−𝑉𝐼𝑆𝑝𝑟𝑒)(𝑉𝐼𝑆𝑝𝑜𝑠𝑡+𝑉𝐼𝑆𝑝𝑟𝑒) where 𝑉𝐼𝑆 =(𝑅+𝐺+𝐵)
3 (4)
3.4 Improvement and refinement of flood maps
The automatic or manually drawn flood maps based on remote sensing data were improved and refined by using DEM modeling and ancillary data. Also for such support data, we followed the criterion of using free-of-charge data. As a final step, flood maps manually drawn were produced using QGIS software.
3.4.1 DEM support: water depth model and shaded relief
We used 5 m and 25 m resolution DEM produced using LiDAR data and photogrammetry techniques, freely available for downloading from the geoportal service of Regione Piemonte [77], and the National Geographic Institute of Spain (IGN is the Spanish acronym) [78]. Exploitation of simulated flooded areas extracted from DTM modeling [55,79] allowed improving the delimitation of the flooded area. The model can also provide information about the water depth which is an essential parameter for damages assessment. We also used the shade relief model derived from DEMs, and aerial photos from WMS services of Regione Piemonte or IGN to detect geomorphological features like terraces or embankments that could constrain the inundation areas.
3.4.2 Ancillary ground truth data
We used ancillary data like field observation, civil protection reports, geolocated photos or news found on reliable websites. This type of data is nowadays an essential source of information for flood map assessment [80,81]. For the Po basin, we also accessed to volunteer geographic information that provided us photos that were georeferenced by using Google Streetview. These data provided spot information that allowed confirming the reliability of flooded maps.
3.5 Flood map validation and quality statistics
The final step of the work is the validation and quality assessment of all the produced flood area maps (automatic, semi-automatic, manual). To do this, we used the flooding maps made by official authorities and online published as a benchmark. These maps are based on aerial photos taken a few days after the floods, field surveys, and remote sensing data. For the 2016 Po river basin flood, we used a flood map available from ARPA (Regional Environment Protection Agency) Piemonte geoportal [82], while for the 2015 Ebro flood we used the maps of Ebro River Basin Authority [52]. We could not apply this step to the Arahal case of study as no official map are available.
The validation procedure is described in the following:
a) Both the produced flooded area maps and the official reference maps were converted in a boolean raster format (1 flooded or 0 - not flooded)
b) The two raster were crossed, and a raster map with four possible values was generated: true positive (TP), true negative (TN), false negative (FN), false positive (FP). TP corresponds to areas correctly classified as flooded, TN are the areas correctly classified as not flooded, FN indicates the undetected flooded areas, FP are the not flooded areas erroneously classified as inundated.
c) We evaluated the efficacy of used datasets and methods, by computing the flood mapping ratio (eq. 5) and the not flood ratio (eq. 6) represented as percentage format.
FR (%) = TP /(TP+FN) (5)
Figure 3: Flood mapping methodology used for this work
4. Results
In this section, we present the results achieved in the selected study areas by applying the abovementioned methodologies. In the following figures, we use the polygon of definitive flooded areas as a benchmark.
4.1 Manual mapping of the flooded area.
Figure 4 shows some examples, in our study areas, of visual interpretation using remote sensing data
• In the Ebro valley near Zaragoza (Fig. 4 A) by using a Landsat-8 co-flood image acquired on 2 March 2018; in this case, the false-color image allowed mapping the whole flooded area. • In the Po river basin, around Alessandria town (Fig. 4 C); by using the Proba-V image acquired
in the morning of 26 November 2016 in this case, it was possible to map most of the area flooded by Tanaro river, but the area flooded by Bormida river was not clearly detectable.
• In the Po river basin, at the South of Turin city (fig 4. B), the Sentinel-2 post-flood image shows only weak traces and the automatic classifications better identified the inundated area.
• In the Arahal area (Fig. 4 D), the Sentinel-2 post-flood image shows flood traces very hard to be detected, and the manual mapping fails. Here we need to use automatic extraction of the flooded area for more reliable results
In most of the considered cases, the polygon of flooded areas drowned manually needs a refinement made with the help of DEM and other ancillary data.
Figure 4. Examples of satellite images characterized by different degrees of difficulty for visual interpretation. A) Ebro valley, Landsat-8 false-color image (SWIR-NIR-BLUE) acquired on 2/03/2015; B) Alessandria area, Proba-V data false-color image (SWIR-NIR-BLUE) acquired on 26/11/2016; C) South Turin area, Sentinel-2 false-color image (SWIR-NIR-RE) acquired on 01/12/2016; D) Arahal area, Sentinel-2 acquired on 8/12/2017 (SWIR-NIR-RE)
4.2 Automatic mapping of the flooded area.
4.2.1 SAR data analysis.
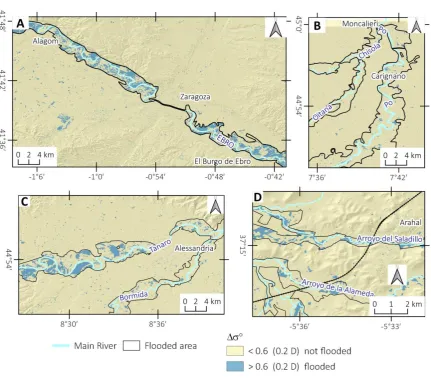
In this section, we show the results of the SAR data based-analysis carried out by using SAR amplitude classifications (SAR_AC) (Fig 5) and Δσo backscattering variation in Figure 6:
• SAR_AC. In the case of Ebro river flood, the classification of the Sentinel-1 image acquired on 5 March 2015, i.e., two-three days after the flood peak (when most of the areas are still inundated according to MODIS data), allowed well detecting the flooded areas (Fig. 5 A). It is possible to observe also some false positive, i.e., areas wrongly classified as flooded, probably related to topographic artifacts. Figure 5 B shows the SAR_AC based on Sentinel-1 image acquired on 28 November 2016 over the areas inundated by Tanaro and Bormida rivers near Alessandria. The flooded areas were detectable easier for the Tanaro river, where the soil was still submerged two days after the flood peak, than for the Bormida river. The analysis performed over the Po river and Arahal flood areas did not show significant results.
• Δσo backscattering variation-based analysis. Compared to the SAR_AR based-analysis, such an approach allows achieving more accurate results by exploiting calibrated Sentinel-1 data and image log ratioing between the post-and pre-flood images (i.e., Δσo= log σo post - log σo pre). For most of the cases, we used VH polarization and Δσo > 0.6 as a threshold. In the case of Zaragoza (Fig. 6 A), we used the post-flood image of 5 March 2015 (acquired three days after the discharge peak) and the pre-flood image of 9 February 2015. The flooded area was partially detected but it still possible to recognize its original extension. The results are also in agreement with MODIS data acquired at the same date. The comparison with a water depth model showed that the areas still classified as flooded on Sentinel-1 image approximately correspond to regions where the water depth during the flood peak was higher than 1.5 m. In the case of Alessandria and Turin, we used the post-flood image of 28 November 2016 and the pre-flood image of 22 November 2016. Results show residual inundated areas. In particular, as already mentioned, the flooding pattern is still visible in the case of Tanaro river but not for the Southern region of Turin where the remaining flooded areas are too small to be detected by Sentinel-1 data.
In the case of Arahal (Fig. 6 D), we used VV polarization that showed better performance concerning VH. We applied a threshold of 0.3. The Sentinel-1 image was acquired in the early morning of 29 November 2017, some hours before the flood peak and probably, the inundated areas are underestimated.
It is worth noting that in all our study areas the capability to map flooded areas by SAR data is also limited by the presence of dense arboreal vegetation or dense urban settlements mainly in the area of Moncalieri [55]. This limitation is already known in the literature [26,83].
Figure 6. Detection of flooded areas based on the difference of SAR backscattering (Δσo) with
Sentinel-1 data: A) 20Sentinel-15 Ebro flood; 20Sentinel-16 Po basin flood in South Turin area (B) and Alessandria area (C); 20Sentinel-17 Arahal flood (D).
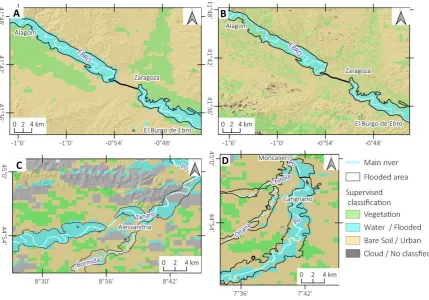
4.2.2 Multispectral data analysis.
Figure 7. Supervised classification based on: A) MODIS image acquired on 2 March 2015 and B) Landsat-8 Images acquired on 3 March 2015 over Ebro valley; MODIS-Aqua images acquired on 26 November 2016 over Alessandria (C) and Turin (D) areas.
Post-Pre flood images comparison. The comparison of co-flood or post-flood images with pre-flood images allowed mapping the pre-flooded areas using different band ratio variation.
The MNDWIvar shows different performances depending on the time of satellite pass and local area setting. It is possible to observe a decrease in the efficacy of this index with time elapsed from the flood event. In the area of Zaragoza (Fig. 8 A) the flooded area was almost entirely detected by the co-flood Landsat-8 image acquired on 3 March 2015. Some false positive variation at SW is related to cloud cover. The MNDWIvar computed with 2 March 2015 MODIS image gave same results.
In the case of the Po basin, only post-flood data are available at high resolution. By using Sentinel-2 image acquired over South Turin area (Fig. 8 B) five days after the water was withdrawn, we detected a clear pattern of positive MNDWIvar inside the inundated areas. Over Alessandria, the Sentinel-2 images (Fig. 8 C) acquired about ten days after the flood peak, only show residual patterns. It is also possible to observe that many pixels located out of flooded areas are classified as inundated, probably due to a general increase of soil moisture. The MNDWI based on 500 m spatial resolution Aqua-MODIS (Fig. 8 D) and 100 m spatial resolution Proba-V (Fig. 8 E) data acquired about 8-12 hours after the flood peak showed betters results especially for the area flooded by Tanaro.
Figure 8. Maps of inundated areas based on MNDWIvar. A) 2015 Ebro flood with Landsat-8 data. 2016
Po basin flood: B) Sentinel-2 data for Turin area C) Sentinel-2 data for Alessandria area (08-12-2016); D) Alessandria area based on MODIS-Aqua (26-11-2016). E) Proba-V data (26-11-2016) F) 2017 Arahal Flood with Sentinel-2.
In the case of the Po basin flood (Fig. 9), we also calculated the NDVIvar and theVISvar to extract the flooded area automatically. The high-resolution NDVIvar based on Sentinel-2 datashows a pattern of negative variation in most of the flooded areas (Fig. 9 A and Fig. 19 C) probably related to a decrease of vegetation activity for the deposition of silt layers especially in the area flooded by Tanaro. This effect is particularly evident in the wheat fields outside the flooded areas, showing an increase of NDVI. As regards the VISvar, it is interesting to note that it shows a clear pattern only for the area flooded by Tanaro river nearby Alessandria (Fig. 9 B) due to the widespread deposition of silt sediments still covering the area two weeks after the inundation. The areas flooded by Po and other rivers showed less trace of sediment, accordingly, the VISvar analysis is less performant.
Figure 9. 2016 Po basin flood, automatic detection of the inundated areas. NDVIvar based on
Sentinel-2 data for Alessandria (A) and South Turin (C); NDVIvar based on MODIS-Aqua (30-11-2016) data for
Alessandria (D) and South Turin (E); VISvar based on Sentinel-2 data for Alessandria area (B);
4.3 Flood, mapping refinement using DEM water depth model and ancillary data.
As already mentioned, the second step for the flood map creation is the refinement and improvement based on supporting data (i.e., DEM and ancillary data), which result to be particularly useful when we have flood maps based only on post-flood images. The final result was the production of flooded area polygons manually draw. Figure 10 shows an example of the integration of remote sensing data, DEM modeling and ancillary data for the mapping of the areas flooded by the Tanaro River near Alessandria. The map in figure 10 A represents the inundation area derived from the automatic classification of remote sensing images in this case based on VISvar of Sentinel-2 data
Figure 10 B shows the inundation maps based on water depth (WD) model, where the pixel is classified as inundated when WD > 0 m,
Figure 10 C represents the synthesis of the two presented maps, where a pixel is classified as inundated if flooded in both satellite data and WD model. It is possible to observe that the WD model allowed reducing pixels incorrectly classified as flooded (false positive). Furthermore, the geolocated photos (available on websites or from volunteers) allowed us to have some ground truth points.
Figure 10 D represents the final version of the flooded area that was manually drawn taking into account the remote sensing data, the WD model, and the ancillary data.
For the Arahal case study, where the flooded area was more difficult to detect, we made a more in-depth effort to combine satellite and support data. Figure 12 shows the steps used to create the refined flood map.
We first created an automatic map of the flooded area (Fig. 11 A) by crossing all the available remote sensing data (i.e., Landsat-8, Sentinel-2 and Sentinel-1). Then, we created a WD model map for the two small streams affected by the flood, around the intersection with the railway Seville-Malaga (Fig. 11 B). The combination of such a model with remote sensing data allowed us to produce the map of the estimated flooded area (Fig. 11C). To assess the reliability of the flood map, we exploited geolocated photos or news about the flood. Available images allowed to evaluate the reliability of the inundation map locally, e.g., it was possible to locate the effect of embankment erosion on a railway line (photo 3).
Figure 10. Example of automatic flooded area corrected with DEM and ancillary data. Alessandria area: A) flooded maps based on VISvar; B flooded area based on water depth model; C) WD-Corrected
Figure 11. Arahal flood November 2017. A) Automatic map of the flooded area based on a combination of NDMIvar made with Landsat-8, MDNWIvar made with Sentinel-2, and Sentinel-1
data; B) water depth model based on DEM; C) Automatic flooded area corrected with WD model and our manual interpretation. 1-5) Ground truth geolocated photos find on the web [84]. The photo 3 shows the railway affected by flood where a train derailed.
4.4 Flood map validation and statistics.
The last step of the presented methodology consists of validating the automatic flood maps. We applied the validation for the flood maps of Ebro valley and Po basin using the official flood maps of Ebro river authority (CHE) and ARPA Piemonte.
The validation process, as described before, is based on the definition of a raster validations map. In these raster maps, each pixel can assume four values: 0) true negative (TN) case represented in brown; 1) false positive (FP) case represented in cyan; 2) false negative (FN) case represented in yellow; 3) true positive (TP) case represented in blue color.
In figure 12 examples of validation maps for automatic flooded area maps are reported. For the area of Zaragoza (Fig. 12 A), the MNDWIvar derived from co-flood Landsat-8 images allowed to correctly classify both flooded and not-flooded area (>90%); also the Δσo Sentinel-1 based analysis (Fig. 13 B) shows satisfactory performance (FR 50 %; NFR > 90%).
For the area of Alessandria, the NDVIvar computed from the MODIS-Terra data shows better results (FR 70 % - Fig. 12 C) compared to the Δσo based analysis (FR of 30% - Fig. 12 D).
In the area at the south of Turin, the MNDWIvar (Fig. 13 E)made with post-flood image (01/12/2016) of Sentinel-2 data detected about 45% of the flooded area.
Figure 12. Example of flooded area validation raster. Ebro flood 2015: A) 3 March 2015, Landsat-8 MNDWIvar; B) 05 March 2015 Sentinel-1 (Δσo). Alessandria area: C) 30 November 2016 NDVIvar using
MODIS-Terra; D) 28 November 2016, Sentinel-1 (Δσo). Turin area: E) 1 December 2016, MNDWIvar
using Sentinel-2.
Figure 13 shows a correlation between the river level for Ebro (Fig. 13 A), Tanaro (Fig. 13 B) and Po (Fig. 13 C) with the flood ratio (FR) for automatic flood mapping based on different methodologies and satellites. The results give an idea of the various parameters that influence flooded area detection. In general, it is possible to appreciate that the quality of automatic detection of flooded area decreases with the time after the top of the flood for all the case considered. The SAR data show a much more rapid decrease in the capacity to detect flooded areas.
For each area, the primary results are:
• The area flooded by the Ebro River near Zaragoza in 2015 (fig 13 A). In this case, co-flood data at low resolution (MODIS-Terra/Aqua and Proba-V) and medium-high resolution (Landsat-8) allowed mapping about the whole flooded area (FR > 95 %) with few false positive values. It is possible to note also that spatial resolution, in this case, has little influence on the accuracy of flooded area detection. The Δσo map made with Sentinel-1 data acquired two days after the maximum flood shows that about 50% of the area is detectable with an NFR (≈98%). With the
map based on Sentinel-1 data, it was still possible to detect a clear pattern that identifies whole flooded areas.
• The area flooded by Tanaro near Alessandria in 2016 (fig. 13 B). Here it is possible to appreciate the high value of FR for near co-flood data of MNDWI based on MODIS-Aqua (FR ≈ 90%) and
Proba-V (FR ≈ 82 %). For post-flood image, it is interesting to note also that the relation “time of
flood peak Vs time of satellite pass” is more important than spatial resolution: 250 m NDVI based on MODIS data of 30 November 2016 show a better result (FR≈ 80 %) than 10 m NDVI based on
Sentinel-2 of 8 December 2016 (FR ≈ 60%). SAR data based on 28 November image of Sentinel-1
show low values of FR (≈20%), making more complicated to detect the whole flooded area.
of inundated area, for instance, two weeks after the flood the VISvar based on Sentinel-2 data showed a FR of 70 % and NFR ≈84%
• The area flooded by Po at the south of Turin, compared with Carignano gauge (Fig. 13 C). Here the flood detection presented similar results of Alessandria area. In particular, Sentinel-2 data acquired on 1st December 2016 show better results for MNDWIvar (≈50% FR) with respect to NDVIvar. (≈35% FR). It was not possible to map flooded area with Δσo of Sentinel-1 because three days after the flood peak only 4 % of the inundated area was detected. Also for this area, the accuracy in flood detection is not related to spatial resolution, and the best performance comes from MNDWI based on MODIS image of 26 November 2016 (FR ≈ 80%).
4.5 Compare flood mapping approaches: automatic emergency, traditional and combined approach
In figure 14 it is possible to observe, for the case of 2015 Ebro flood and 2016 NW Italy flood, a comparison between the flooded areas mapped by EMS-Copernicus [51,56], the flooded area made with manual interpretation for this work and the official flood maps produced by river authorities.
The EMS-Copernicus mapping is automatic mapping in quasi-real time that identifies critical area during the emergency but does not represent the real flood extension for further post-emergency analyses. For instance, the EMS flood mapping in the case of Alessandria area (Fig. 14 A) is based on Radarsat-2 data (acquired on 27/11/2016), and the map shows only the remaining flooded areas (dark blue), which are similar to the Sentinel-1 (Fig. 12D).
The area at South of Turin (Fig. 14 B) was only partially mapped by EMS only from Carignano downstream to Turin. The flood map for the area near Moncalieri, investigated with Pleiades satellite at 26/11/2016, detected most of the flooded areas and well fits with our map, while the sector near Carignano town, mapped with an image of 27/11/2016, shows only residual flooded areas.
In the case of Ebro valley, the EMS flood map was made with a Radarsat-2 image acquired on 02-03-2015 (Fig. 14 C). The map shows an almost complete fit with our flood mapping and the official flood mapping of CHE.
The comparison with official mapping showed good results. It is possible to observe that the flood maps made for this study based on remote sensing data well match with the official maps of Ebro basin authority (CHE) with a 95 % of overlap (Fig. 14 C). The area inundated by Tanaro (Fig. 14 A) proposed in this study also shows a good match, around 90%, with ARPA Piemonte flood maps. There are more differences in the area at the south of Turin (about 85 % of matching, Fig. 14 B): this sector is mapped mostly with post-flood data and the area affected by shallow water depth have fewer signs of the flood. The flood mapping based on satellite data presented more difficult in the urban areas where a more detailed survey is often required as shown in a previous work [47].
In the case of the Arahal flood, it is not possible to estimate the accuracy of flood mapping because official maps are not available. However, the combination of Sentinel-1, Landsat-8, and Sentinel-2 data implemented with water depth model allowed creating a reliable map that was locally validated.
5. Discussion
From the results of our study, it is possible to discuss the main topics emerged in this work. The choice of the satellite data or processing most appropriate to detect flooded areas is a complicated issue: it is necessary to take into account the complex relations between the flood and the satellite characteristics. Figure 15 shows the parameters that we evaluated as necessary for reliable flood mapping, some considerations are reported below:
• The time factor is the most critical parameter. If a co-flood image is available, the detection and the refinement of the inundated area are more straightforward and require short time. To know the time of maximum inundation, data from river gauge stations (e.g., for Ebro, Po, and Tanaro case studies) can be considered. If river gauge stations data are not available (e.g., Arahal case study), it is often possible to estimate the time of inundation from ancillary data found on the web like news, photos, or videos. Medium-low resolution multispectral satellite (MODIS, Proba-V, Sentinel-3), with their daily revisit time, more probably acquire co-flood images for many flood events, while it is less probable to have co-flood SAR images acquired by Sentinel-1 which are in 2018 the only SAR satellites providing free images.
The time elapsed from the flood peak also influences the band ratios to use: MNDWIvar shows better performance on short-term, while NDVIvar and VISvar have better performance on long-term. As regards the pre-flood images used as a benchmark, the one acquired as close as possible to the flood event should be selected to have similar conditions of land-use and sun illumination.
• The sky-condition is another relevant parameter, which limits the availability of co-flood images. Indeed, only SAR satellite can acquire images under cloudy conditions. In our cases, the area flooded around Zaragoza was cloud free during the 2015 flooding as the flood peak arrived several days after the meteorological event, while the cloudy conditions have limited the availability of images for the 2016 Po basin flood.
• The spatial features of the flooded area represent a constraint for the satellite spatial resolution. Small inundated areas (e.g., Arahal case study) cannot be mapped by low-resolution satellites. In addition, the area flooded by small stream has a very short co-flood time interval.
• The extension of the affected area. For the main river may be necessary more than one images to map the whole river section affected by the flood. Also, the time of maximum flood change along the stream and is not the same for tributary. For instance, the flood waves of Po and Ebro river transited in several days from upstream to downstream.
• The land-use and the morphology of the flooded area. These factors are important in the choice of the satellite image. Inundations occurring on cultivated crops in floodplains can be easily detected by most of the satellites. Also several days after the flood, with multi-spectral data, it is possible to recognize flooded areas especially if sediments cover crop fields easily. In urban or dense forested regions, the detection of the flooded area it is more complex [83]. In many cases, high-resolution data and field surveys are still necessary for a reliable mapping.
Only free data both for remote sensing and ancillary data that allowed to produce reliable flood maps of presented study areas. The most powerful feature of the used satellite data consists of their temporal sampling. Indeed, multispectral satellites provide daily images, and Sentinel-1 system continually provides SAR data with short revisit time and global coverage. On the other hand, commercial satellites usually acquire images only on demand with a partial spatial coverage (e.g., Cosmo-SkyMed constellation provide constant acquisitions just over Italy or some other specific areas).
As regards the spatial resolution, the used free datasets were suitable to map the flooded areas under investigation accurately.
of the urban area, it was necessary to use on-demand data and field survey as described in previous work [55].
Along with satellite data, we also exploited free ancillary data like DEM, river gauge data, or geolocated information for the refinement step. Our areas of study were covered by free and high-resolution DEMs provided by local authorities and, for the Ebro and Po basins, by gauge station networks providing river level data with a good density.
Figure 15. schematic approach for the choice of satellite data
6. Conclusions
Many services of automatic near real-time flood mapping already exist, they provide maps for emergency phase but, many times, these data are not sufficient for the assessment phase. In this study, we propose an operator-controlled methodology. This methodology is addressed to make flood hazard maps that can supported hydrological studies, urban planning or flood damages assessment. The flood map production requires some weeks of works after the flood event, the time necessary to collect satellite and ancillary data and to make an interpreted and reliable flooded area maps.
We proposed a flood mapping strategy composed by progressive steps: the first is the flooded area detection that can be carried out with an automatic extraction or by visual interpretation of satellite images; the second is the flooding map refinement manually made with the help of ancillary data like DEMs, water depth models or ground photos and web-based information. The final output is an accurate and morphological based flood map.
For the case of Ebro and Po basin flood, we also considered a performance assessment of the different automatic maps of the flooded area, by creating validation maps through a comparison with official flood maps provided by local river authorities. We calculate the flood ratio (FR) that is the percentage of the flooded area detected by satellites.
The results show that nowadays the availability of free-of-charge satellite data makes possible to map floods over most of the floodplain areas. The capability of spaceborne sensors to map a flood event depends on several factors; among these, the time of satellite pass with respect to the time of flood peak is the primary parameter to take into account.
SAR satellites provide day and night imagery, regardless of weather condition. However, SAR-based flood mapping results to be more efficient if co-flood acquisitions are available, allowing to extract information on areas fully covered by water. Nowadays the only operation SAR system providing free and open data is Sentinel-1. Thus the probability to obtain co-flood data is reduced. In our study, a co-flood Sentinel-1 image was available only for the 2015 Ebro valley flood, where the flooded area was satisfactorily detected (≈50 % FR). In the other study areas, only post-flood images were available; these data, although acquired few hours or days after the water withdrawal, were not suitable for flood mapping (e.g., < 5% FR for the area inundated by Po river).
Data from the multispectral satellite can also be useful in case of a post-flood acquisition, allowing detecting changes inside the flooded areas within a few weeks from the water withdrawn. The post-flood mapping, however, needs more processing: bands index variation (e.g., MNDWIvar, NDVIvar or VISvar) and functional integration of WD DEM model during the map refinement step. Also, FR showed a decrease with the time elapsed from the flood. The local condition, like the depositions of silt sediments, helped the mapping of the flooded area for a more extended period (e.g., FR≈ 70 % for in the area flooded by Tanaro using Sentinel-2 data, 15 days after floods).
The medium-low MODIS and Proba-V satellite sensors (with daily revisit time) increase the probability to acquire co-flood data. MODIS co- and post-flood data allowed map flooded areas for the whole plain in the case of Po basin flood. In the Zaragoza area, the MODIS co-flood image allowed an accurate mapping (FR >90%) despite the medium-low spatial resolution. Proba-V data permitted achieving excellent results especially for the area of Alessandria, where quasi co-flood data was available, with an FR near to 100% for the area flooded by Tanaro.
The medium-high resolution Landsat-8 and Sentinel-2 data showed the same flood ratio performance of the medium-low resolution satellites but with a spatial precision several times greater, and the capability to detect small flooded area (up to ≈500 m2). In the case of co-flood data for Ebro valley, direct visual interpretation provided a very accurate map.
The Arahal case study shows that also a small flash flood event can be satisfactorily mapped if we properly combine multi-sensor data with reliable ancillary data; in such case, the availability of high-resolution Sentinel-2 data acquired in the proximity of the flood event was fundamental. The high spatial resolution is indeed a key factor flood mapping in dense urban areas and is one of the limitations of the current free satellite data.
accurate, and the traditional flood mapping carried out with on-demand data, which provides very accurate information but it is more resource-intensive.
The outcomes of this study show the relevance of having a network of operational satellites providing free- and open access data with continuity, which represent a valuable resource for low-cost flood mapping and flood hazard assessment and management also in disadvantaged regions.
Acknowledgments: The authors wish to acknowledge the volunteers that provided ground photos of 2016 flood.
Author Contributions: D.N.is the main responsible of the study, develop the work methodology, processed multispectral data and write the manuscript; D.G. contribute to the writing and revision manuscript and coordinate the research project; F.C. and A.P. processed the Sentinel-1 data, wrote the InSAR processing chapter and revised the manuscript; F.Z. and J.P.G. contributed implementation and correction of the manuscript.
Conflicts of Interest: The authors declare no conflict of interest.
References