An Automated Data Logging System for Soil Moisture and
Temperature Determination
Caroline O. Ekejiuba, Michael O. Kolawole
1Department of Electrical/Electronic Engineering, Ekiti State University, Ado Ekiti, Federal Polytechnic, Ado-Ekiti, Nigeria
2
Department of Electrical and Electronics Engineering, Federal University of Technology, Akure, Nigeria
Abstract
The remote measurements of soil moisture and soil temperature, using the appropriate sensors, are not only important in environmental or weather monitoring processes but also crucial for many industrial developments. An electronic device capable of accurately measuring and monitoring these parameters has been developed. Measurements were calibrated against relevant standard devices. The developed device has performed extremely well against the standard. For analysis and archiving purposes, the data is transferred to a preferred remote electronic system or computer with a graphical user interface program through an RS 232 communication link. The interface program allows sampling parameters such as the date and time of the data-logging operation to be configured.
Keywords: data logger; microcontroller; remote sensors; soil moisture; soil temperature
I INTRODUCTION
The environment is the domain in which human’s activities take place over the years. In recent times, natural phenomena and developmental activities have begun to disrupt environmental process (by degradation) to its detriments. These natural phenomena and developmental factors include storm, drought, flood, erosion, earthquake and volcanic eruption, greenhouse gases from fuel combustion, deforestation, urbanization and industrialization. These result in variations in solar energy, temperature and precipitation Upreti, (1999), which pose a real threat to lives as they largely affect vital services such as water resources, agricultural outputs, coastal regions’ landscape, freshwater habitats, vegetation and forests, snow cover. The imbalance in these services could trigger snow melting and geological processes such as landslide, desertification and floods, which may have long-term effects on food security as well as in human health Malla, (2008). Man’s quest for checking these negative environmental consequences of developmental activities has led to continuous search for better understanding and control of his environment.
Weather information such as soil moisture and soil temperature is critical for successful agricultural activities. Unfortunately, present methods of monitoring such information utilize manual observation and recording data that may be error-prone. Automation of these monitoring methods cannot only increase the reliability, but also improve the timely availability of data, and hence contribute significantly to the betterment of agriculture in day-to-day activities as well as long-term planning Gunawardena et al., (2008). The measurements of the soil moisture and soil temperature, remotely using appropriate sensors is not only important in environmental or weather monitoring but also crucial for many industrial processes Kamarul et al., (2006).
Soil moisture and temperature are an important component in the atmospheric water cycle, both on a small agricultural scale and large-scale modeling of land/atmosphere interaction. Vegetation and crops always depend more on the moisture available at root level than on precipitation occurrence. Water budgeting for irrigation planning, as well as the actual scheduling of irrigation action, requires local soil moisture information. Knowledge of the degree of soil wetness helps to forecast the risk of flash floods, or the occurrence of fog. Nevertheless, soil moisture has been seldom observed routinely at meteorological stations. Documentation of soil wetness was usually restricted to the description of the “state of the ground” by means of WMO Code Tables 0901 and 0975, and its measurement was left to hydrologists, agriculturalists and other actively interested parties. Around 1990 the interest of meteorologists in soil moisture measurement increased. This was partly because, after the pioneering work of Deardorff (1978), numerical atmosphere models at various scales became more adept at handling fluxes of sensible and latent heat in soil surface layers. Moreover, newly developed soil moisture measurement techniques are more feasible for meteorological stations than most of the classic methods. To satisfy the increasing need for determining soil moisture status, a microcontroller-based device for soil moisture and soil temperature measurements is developed and discussed in this paper. The experimental test of the proposed system was carried out at Geographical Information Centre, Adekunle Ajasin University Akoko, Ondo State, Nigeria.
II MONITORING SYSTEM’S DESIGN AND DEVELOPMENT
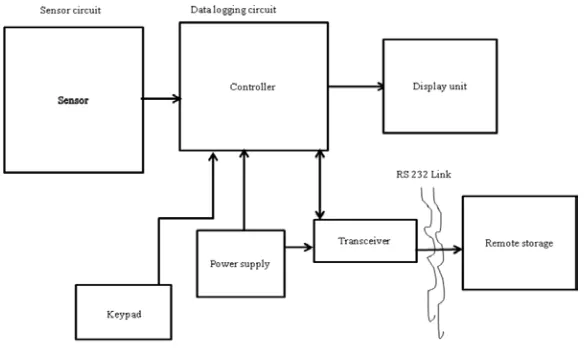
Figure 1 shows the block diagram of the developed microcontroller-based environmental data monitoring system comprising a microcontroller Interface Circuit (e.g. sensor circuit, transceiver, power system), Input Key (e.g. keypad) and Display Unit (e.g. liquid crystal display, LCD). The system uses sensors to detect two physical quantities: soil temperature and soil moisture. The detected physical quantities are converted into electrical signals by these sensors and passed as input to an analog-to-digital converter (ADC), which produces pure digital output. The control program of the microcontroller, therefore, examines the inputs from the ADC, input key and microcontroller counter before changing the controller output signals that feed the display unit. An external memory 24C32 is employed to ensure that the RAM content of the controller is not lost when power is switched off. The microcontroller, which is a C-stamp chip, was programmed in C language and the graphical user interface (GUI) software was developed in Visual Basic.
The Sensor Circuit
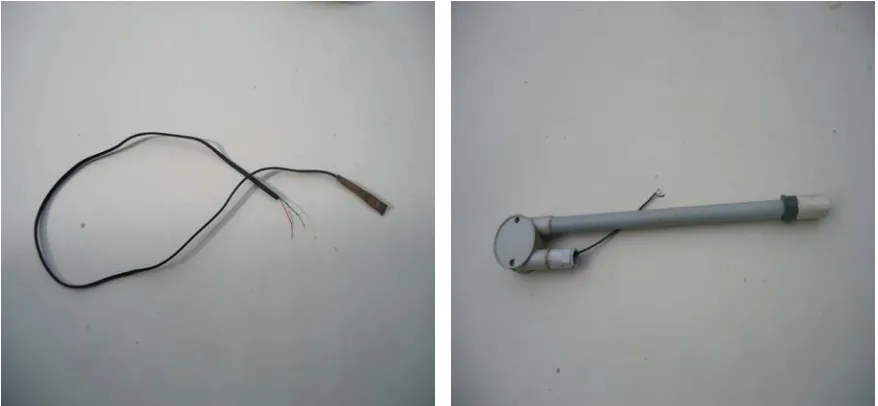
For temperature sensing, an integrated circuit temperature sensor thermistor is used, as seen in Fig. 2. Its characteristics include moderate temperature range of -60 o C to +150 o C giving an accuracy of 0.1%, relatively low cost, predictable linearity, and the need for signal conditioning. Currently, portable thermistor probes were made for periodic measurements whilst thermistor posts would be installed permanently for continuous monitoring.
Soil moisture measurement is performed by resistive soil moisture sensor shown in Fig. 3. The device consists of a porous block containing two electrodes connected to a wire lead. When the device is buried in the soil, water will move in or out of the block until the matric potential of the block and the soil are the same. The electrical conductivity of the block is then read with an alternating current bridge.
An ADC performs the conversion of all analogue outputs from the sensors into digital signals to be fed to the microcontroller. Amplification and offset adjustment (as in temperature sensor) of these signals are provided by the LM324 op-amp. Although amplification is necessary to suit the input range of the ADC, noise from sensors is also amplified. To alleviate this problem and to maintain consistency of the sensing system, a noise filtering circuit is added before the op-amp stage.
Fig. 2: Pictorial Diagram of a Thermistor Fig. 3: Pictorial Diagram of a Gypsum Block
The Data-Logging Circuit
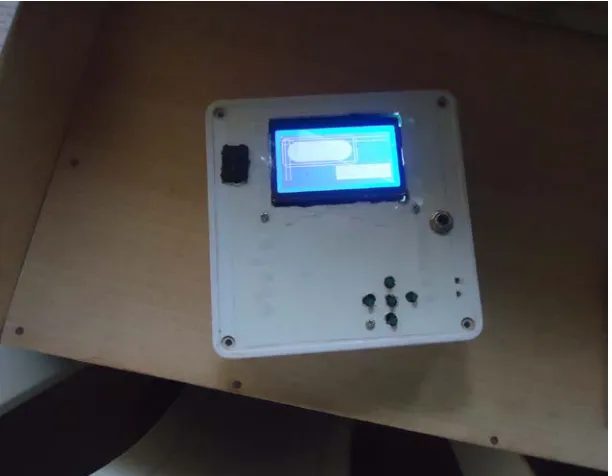
The main component of the data logging circuit is PIC16F877A microcontroller, which is equipped with a sizeable memory and 20 MHz of processing speed. This microcontroller not only controls the system but also synchronizes all the module operations. A 32-kbyte external memory (24C256) is connected to the microcontroller for storing the sensors’ readings up to 30 days (for 30-sec sampling interval, the average of which is stored at every 4 hours interval). The interface of the EEPROM and the microcontroller is based on the I2C bus providing a simple bi-directional 2-wire bus for efficient inter-IC control. A graphic LCD module is also connected to the microcontroller to display the measurement of the sensors and the current time. The data logger also allows the user to browse through the recorded data and change the sampling interval, monitoring sensors, the date and year. The acquired data can be exported to spreadsheet or database for analysis. Figure 4 shows the data logger.
Fig. 4: Assembled data logger
A real-time clock (RTC) chip is employed for time-keeping purpose. Communication between the chip and the microcontroller is achieved via a simple serial interface. The time is displayed on the LCD. A separate battery source supplies the power required by the chip, hence enabling its operation is kept undisturbed in the event of main power source failure.
Data stored in the EEPROM can be accessed directly with a personal computer (PC) through USB connection. This connection is established via a USB interface microcontroller (e.g. 16C745).
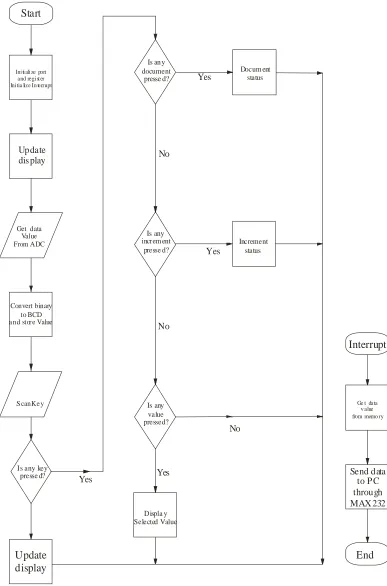
The graphical user interface (GUI) software was developed, using Mikro C. The software allows the user to download data from the EEPROM, completely or partially. It also enables the user to change the sampling parameters such as date, time, and sampling interval. The data can also be plotted with the built-in graph plotter or exported to preferred spreadsheet or database for further analysis. The acquired data can be transmitted via transceiver to a data viewer shown in Fig. 5. The flowchart for the system operation is shown in Fig. 6.
Fig. 5: Data Viewer
Start
Ini ti ali ze port and regi st er Ini tia lize In terrupt
Update dis play
Convert binary to BCD a nd stor e Value
S can Ke y
Update display
Is any key presse d?
Get data Value From ADC
Is an y document presse d? Docum ent status Increment status Is any increm ent presse d? Is any value pressed? Displa y Selected Value No Yes Yes No Yes No Yes Interrupt
Ge t data v alue from memo ry
Send data to P C through MAX 232
End
Fig. 6: Flow Chart of the Program
III SYSTEM TESTING, RESULTS, AND DISCUSSION
The accuracy of the proposed system was tested through calibration measurements against the standard equipment used by Meteorological Service Department, which contains a Preservature Equipment with sensitivity of 0.1oC for soil temperature measurement and Cambel Scientific Equipment Water Content Reflector meter Model CS616 with sensitivity of 0.01% for soil moisture measurement.
The proposed system was mounted 3-cm away from the standard weather monitoring system at Geographical Information Centre, Adekunle Ajasin University Akoko, Ondo State, Nigeria. The standard equipment is the property of, and monitored by, the National Agency for Space and Research Development.
The thermistor was rapped with copper tube to increase the thermal contact with the ground and to prevent the effect of the soil resistance on the actual reading. The thermistor and the gypsum block were buried 20cm deep.
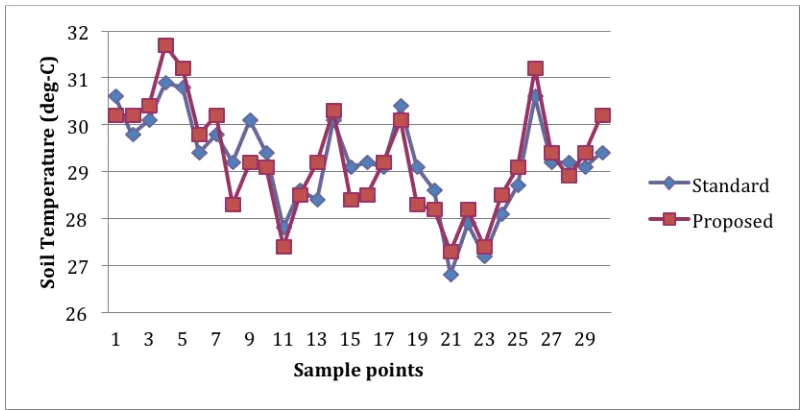
Data samples were corrected from 30 sample points at different timelines, 24-hour cycle at 4-hour intervals, simultaneously by standard instrument and developed (proposed) instrument. These enable effective comparison, measuring the accuracy and reliability of the proposed device. The representative comparisons are shown in Figs. 7 and 8.
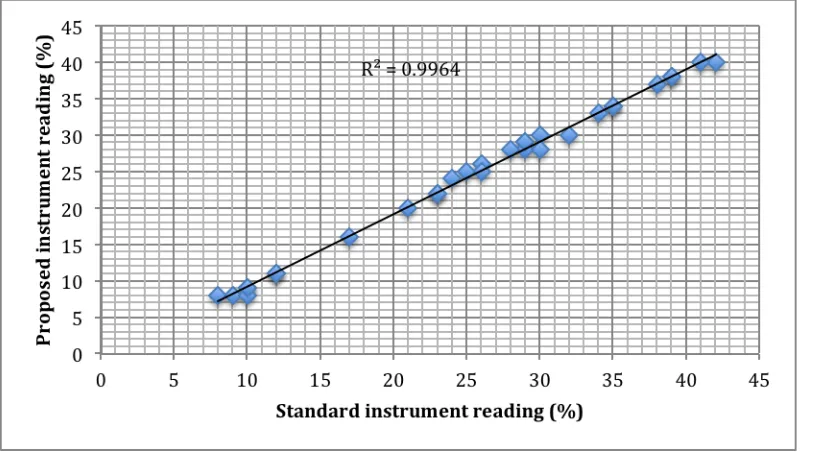
Figures 7(a) and 7(b) show the comparative graphs of data acquired from the Standard Equipment and the proposed system for Soil Temperature and Soil Moisture, respectively. While Figs. 8(a) and 8(b) depict the correlation of data acquired from Standard Equipment and the proposed system for Soil Temperature and Soil Moisture, respectively. As seen in Figs. 8(a) and 8(b), the strength of the relationship between the instruments (i.e., proposed system and standard system) was determined by the use of linear regression coefficient R2. The regression coefficients R2 of 0.885 and 0.996 were estimated for soil temperature and soil moisture measurements, respectively. This demonstrates high correlation between the proposed and standard instrument; thus demonstrating a fit-for-purpose of the proposed instrument. Further testing indicates the proposed system has soil moisture and soil temperature sensors’ sensitivity of 0.01% and 0.1, respectively.
Fig. 7(a): Soil temperature comparison of proposed versus standard instrument for different sample points
Fig. 7(b): Soil moisture comparison of proposed versus standard instrument for different sample points
Fig. 8(a): Soil temperature correlation comparison of proposed versus standard instrument for different sample points
IV CONCLUSION:
An automated soil moisture and soil temperature monitoring system has been developed. This system incorporates the use of sensors, ADC, graphical user interface, radio transceiver and a data logger to achieve an accurate weather monitoring system capable of storing data for 40 days and the same can be transferred to any database for further analysis. The data transfer mode is fast and accurate. The proposed system gives room for modification without affecting the initial cost as the software can only be altered, and offers a high degree of accuracy and cost effective. The soil moisture and soil temperature sensors’ sensitivity of the proposed system is 0.01% and 0.1, respectively.
The soil monitoring system is being modularised for research and agricultural use.
REFERENCES
Deardorff, J.W., (1978). Efficient prediction of ground surface temperature and moisture, with inclusion of a layer of vegetation. Journal of Geophysical Research, 83(4), 1889–1903.
Guanawardena, S.P-KA.; Rangana, B.M.D.; Siriwardena M.M.; Dias, D.; Peries, A., (2003). An Automated Rainfall Monitoring System. Department of Electronic and Telecommunication Engineering University of Moratuwa.
Kamarul, N.A.; Chow, C.O.; Mohamad F.I., (2006). A Low-Cost Microcontroller-based Weather
Monitoring CMU Journal, 5(1), 33.
Malla, G., (2008). Climate change and its impact on Nepalese Agriculture. Journal of Agriculture and
Environment 9, 62-71.
Upreti, D.C., (1999). Rising Atmospheric CO and Crop response. SASCOM Scientific Report, 1-8
Fig. 8(b): Soil moisture correlation comparison of proposed versus standard instrument for different sample points
List of Figures
Fig.1: Block Diagram of Weather Monitoring and Logging System
Fig. 2: Pictorial Diagram of a Thermistor
Fig. 3: Pictorial Diagram of a Gypsum Block
Fig. 4: Assembled data logger
Fig. 5: Data Viewer
Fig. 6: Flow Chart of the Program
Fig. 7(a): Soil temperature comparison of proposed versus standard instrument for different sample points
Fig. 7(b): Soil moisture comparison of proposed versus standard instrument for different sample points
Fig. 8(a): Soil temperature correlation comparison of proposed versus standard instrument for different
sample points
Fig. 8(b): Soil moisture correlation comparison of proposed versus standard instrument for different
sample points