Can Tweets Predict TV Ratings?
Bridget Sommerdijk, Eric Sanders and Antal van den Bosch
Centre for Language Studies / Centre for Language and Speech Technology,Radboud University, the Netherlands {e.sanders, a.vandenbosch}@let.ru.nl
Abstract
We set out to investigate whether TV ratings and mentions of TV programmes on the Twitter social media platform are correlated. If such a correlation exists, Twitter may be used as an alternative source for estimating viewer popularity. Moreover, the Twitter-based rating estimates may be generated during the programme, or even before. We count the occurrences of programme-specific hashtags in an archive of Dutch tweets of eleven popular TV shows broadcast in the Netherlands in one season, and perform correlation tests. Overall we find a strong correlation of0.82; the correlation remains strong,0.79, if tweets are counted a half hour before broadcast time. However, the two most popular TV shows account for most of the positive effect; if we leave out the single and second most popular TV shows, the correlation drops to being moderate to weak. Also, within a TV show, correlations between ratings and tweet counts are mostly weak, while correlations between TV ratings of the previous and next shows are strong. In absence of information on previous shows, Twitter-based counts may be a viable alternative to classic estimation methods for TV ratings. Estimates are more reliable with more popular TV shows.
Keywords:Twitter, TV ratings
1.
Introduction
The social media platform Twitter1 harbors enormous amounts of information, much of which refers to the per-sonal realm. By referring to what one is doing, people pro-vide information that can be used as a basis for research in sociology, demographics, and statistics. In this paper, we focus on TV ratings: how many people watch a certain TV program. Delleret al. (Deller, 2011) explore the rea-sons why it has become popular to use social media, such as Twitter, before and during the watching of TV programs: to suggest others to watch too, from a desire to talk about what they do, and from a desire to be part of a live conver-sation.
Our main research question is: can we use Twitter to predict TV ratings? We present a case study focusing on Dutch TV. Similar research questions are discussed by Wakamiya et al.(Wakamiya et al., 2011) who use Twitter to estimate TV ratings based on textual, spatial, and temporal relevance. Ohet al. (Oh et al., 2015) conclude from their study that there is a positive relationship between social media activi-ties and TV ratings.
In their study, Sanders and Van den Bosch (Sanders and Van den Bosch, 2013) used a simple method to try to predict the outcome of the political parliamentary elections in the Netherlands in 2012, which worked surprisingly well. By counting the names of political parties and comparing them to polls and actual election results, they achieved a high correlation. Encouraged by this result we set out to apply a similar method to the prediction of TV ratings.
In the remainder of this paper we first explain how we gath-ered the data we used in Section 2. In Section 3 we describe the experiments we conducted. In Section 4 we show the re-sults from our experiments and in Section 5 we draw con-clusions and discuss them. In the last section we provide some directions for future research.
1http://www.twitter.com
2.
Data
For our research we focus on Dutch TV programmes asso-ciated with a relatively high number of tweets, as these pro-grams have the highest impact both in terms of economic relevance (e.g. for advertisement placement) and in total viewer time. The TV programmes were selected from the top-25 of programmes that are most tweeted about as listed on the website spot.nl. Spot is a foundation for the promo-tion and optimizapromo-tion of TV commercials oriented at the Dutch TV market. We only selected programmes broad-cast once a week; the programmes are new shows, not re-plays. Generally speaking, these weekly programmes are also the type of programmes that are tweeted about most, in contrast to daily news broadcasts, one-off documentaries, children’s shows, etc. and with these we minimize the risk that a tweet is about the previous or next episode of a pro-gramme (Cheng et al., 2013). For our study we selected the top eleven most tweeted about programmes falling into the category of weekly shows. All programmes were broadcast between December 2013 and March 2014. Table 1 lists the eleven programmes.
The TV ratings for all episodes of the eleven shows were obtained from the SKO, Stichting Kijk Onderzoek (En-glish: foundation for TV-ratings).2 The ratings are deter-mined by acquiring information from devices installed in 1,235 randomly selected Dutch households that together monitor the TV watching behavior of 2,800 people. Ev-ery year the viewer panel is refreshed by moving a quarter of the devices to another household.3
The numbers of tweets referring to a particular show in a particular week are obtained from the webservice Twiqs.nl4. Twiqs archives about 40% of all Dutch Tweets
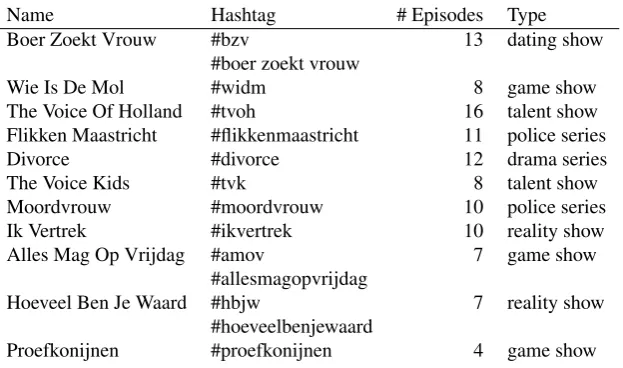
Name Hashtag # Episodes Type Boer Zoekt Vrouw #bzv 13 dating show
#boer zoekt vrouw
Wie Is De Mol #widm 8 game show
The Voice Of Holland #tvoh 16 talent show Flikken Maastricht #flikkenmaastricht 11 police series
Divorce #divorce 12 drama series
The Voice Kids #tvk 8 talent show
Moordvrouw #moordvrouw 10 police series Ik Vertrek #ikvertrek 10 reality show Alles Mag Op Vrijdag #amov 7 game show
#allesmagopvrijdag
Hoeveel Ben Je Waard #hbjw 7 reality show #hoeveelbenjewaard
Proefkonijnen #proefkonijnen 4 game show
Table 1: Names and hashtags of the eleven Dutch TV shows for which data was gathered in the period December 2013 – March 2014.
(Tjong Kim Sang and Van den Bosch, 2013) and has ex-tensive search options. For our tweet collection we used simple time-specific search with the most commonly used hashtags for the TV programmes. Some programmes had two popular hashtags. Tables 1 and 2 list the hashtags used, the number of episodes, the type of show, the mean TV rat-ings per weekly show or episode, and the mean number of tweets. For reference, the daily number of tweets posted in the Netherlands is in the order of two million tweets; with a population of 17 million inhabitants, the Netherlands has a relatively active Twitter user base with about one million active users. The numbers in Table 2 suggest that only one in several hundreds of viewers is posting about the show during the show’s broadcast.
3.
Method
To investigate whether there is a relation between the num-ber of tweets and TV-ratings, the correlation (Pearsonsr) was computed for tweets and ratings in various conditions. In (Deller, 2011) the authors state that tweets about TV programmes are mostly posted when people are watching that particular programme. The best correlation is therefore probably the one between the TV ratings and the tweets that were posted during the broadcast.5 Additionally we counted the tweets posted half an hour before the broad-cast and half an hour after the broadbroad-cast. These appeared to be typical time slots within which there is already or still tweeted about the programmes. Table 2 compares the num-bers of tweets posted during the half hours before and af-ter the show with the numbers of tweets posted during the show, confirming the observation of (Deller, 2011). Correlations were computed in two ways:
1. Per show, by taking the number of a tweets and ratings of all episodes together and computing the correlation over all data pairs. This yields one result.
5
To gather tweets posted exactly during programme broad-casts, we checked the actual starting and end times of the pro-grammes via the websitehttp://www.hebikietsgemist. nl/.
2. Per programme / episode, by computing the correla-tion over the data pairs of the indiviual episodes of one programme. This yields 11 results.
4.
Results
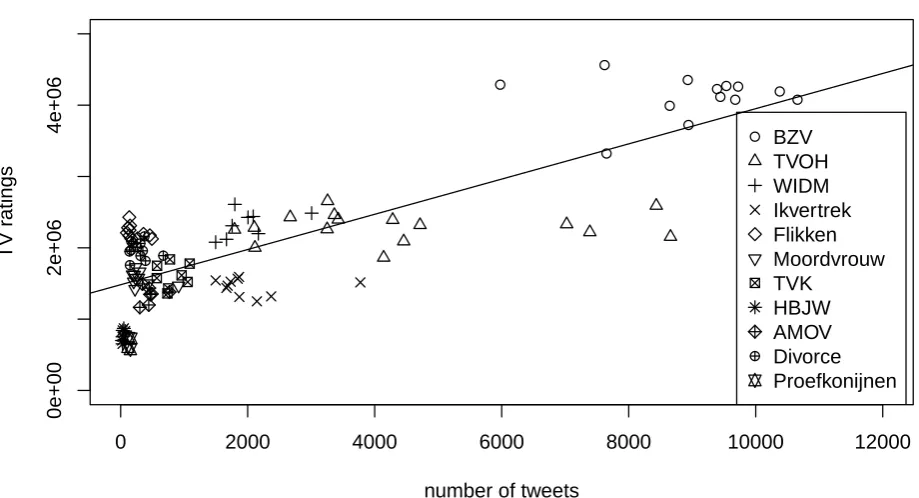
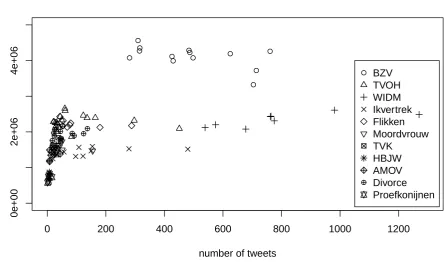
Figure 1 displays a scatter plot of the TV ratings against the number of tweets posted during all episodes of all pro-grammes, as well as the best-fitting linear regression line. Pearson’srof this relation is0.82(p <0.01), which is re-markably high. Closer analysis tells that this is for a large part due to the 21 episodes of the two programmes that are viewed by most people, and that are much tweeted about: BZV and TVOH. If we leave out BZV the correlation drops to0.44(p <0.01)and if we leave out both BZV and TVOH the correlation reduces to0.23(p <0.01). Figure 2 zooms in on the next seven programmes of the top-11 that are viewed by fewer people than the top-4 programmes, i.e. the graph excludes all episodes of the four best watched programmes. From this figure we observe that there is at best a weak relation between the number of tweets and the TV ratings for these programmes.
Figures 3 and 4 display scatter plots of ratings and tweets for tweets that were posted half an hour before the TV programme started, and half an hour after the programme has finished, respectively. The Pearson’s r correlations are 0.79(p < 0.01) and 0.57(p < 0.01), respectively, indicating a better correlation between tweets posted be-fore a show than posted after. If we leave out the num-bers for BZV the correlations drop to0.29(p <0.01)and 0.41(p <0.01), respectively.
Table 3 provides the correlations between TV ratings and number of tweets averaged over all episodes of only that particular show.
●
● ● ●
● ● ●
●
● ●● ● ●
0 2000 4000 6000 8000 10000 12000
0e+00
2e+06
4e+06
Tweets during broadcast versus TV ratings, all programmes
number of tweets
TV r
atings
● ● ● ● ● ● ●●● ● ●●
●
● BZV TVOH WIDM Ikvertrek Flikken Moordvrouw TVK
HBJW AMOV Divorce Proefkonijnen
Figure 1: Number of tweets during the TV programme related to number of viewers .
0 200 400 600 800 1000 1200
0
500000
1500000
2500000
Tweets during broadcast versus TV ratings, excluding top 4
number of tweets
TV r
atings
● ●
● ●
● ●
● ● ●
● ●
●
●
Flikken Moordvrouw TVK
HBJW AMOV Divorce Proefkonijnen
●
● ●
●
●
● ●
●
●
● ●
● ●
0 500 1000 1500
0e+00
2e+06
4e+06
Tweets half an hour before broadcast versus TV ratings
number of tweets
TV r
atings
● ● ● ● ● ● ● ● ●
● ●●
●
● BZV TVOH WIDM Ikvertrek Flikken Moordvrouw TVK
HBJW AMOV Divorce Proefkonijnen
Figure 3: Number of tweets half an hour before the TV programme related to number of watchers.
● ●
● ●
● ●
● ●
● ● ●
● ●
0 200 400 600 800 1000 1200
0e+00
2e+06
4e+06
Tweets half an hour after broadcast versus TV ratings
number of tweets
TV r
atings
●
● ●
● ●● ● ●● ●
●●
●
● BZV TVOH WIDM Ikvertrek Flikken Moordvrouw TVK
HBJW AMOV Divorce Proefkonijnen
Number of tweets
Name TV ratings 30 min before during 30 min after Boer Zoekt Vrouw 4,111,692 1,011 8,967 489
Wie Is De Mol 2,333,250 380 1,998 793
The Voice Of Holland 2,294,125 64 4,442 102 Flikken Maastricht 2,218,455 79 229 85
Divorce 1,967,500 24 290 58
The Voice Kids 1,608,125 11 813 34
Moordvrouw 1,570,500 162 323 44
Ik Vertrek 1,452,700 21 2,044 149
Alles Mag Op Vrijdag 1,338,857 13 465 16
Hoeveel Ben Je Waard 773,143 2 39 7
Proefkonijnen 662,750 12 138 6
Table 2: Average TV ratings per show, and average number of tweets 30 minutes before, during, and 30 minutes after a show episode.
Name Correlation
Boer Zoekt Vrouw 0.05 Wie Is De Mol 0.47 The Voice Of Holland 0.07 Flikken Maastricht -0.50
Divorce -0.11
The Voice Kids 0.10
Moordvrouw -0.42
Ik Vertrek -0.07
Alles Mag Op Vrijdag 0.22 Hoeveel Ben Je Waard 0.63 Proefkonijnen 0.11
Table 3: Correlations (Pearson’sr) per show between TV ratings and numbers of tweets posted during shows.
5.
Conclusions and Discussion
We investigated how well TV ratings can be predicted from Twitter by counting hashtags referring to TV programmes. We observed the correlation between the number of Twit-ter mentions and the ratings of the 11 most popular weekly TV programmes in the Netherlands broadcast between De-cember 2013 and March 2014. For the tweets that were posted during the broadcast of the programme, the corre-lation (Pearson’sr) is 0.82, which can be considered very high. This is, however, for a large part due to the two most popular programmes. If we leave these out, the correlation drops to 0.23. The correlations with the tweets that were posted half an hour before of half an hour after the broad-cast are show the same pattern, although their numbers are smaller. The interestingly high correlation of 0.79 for all shows for tweets posted a half hour before the shows start, indicates that anticipatory tweets of people posting mes-sages about the fact that they are about to tune into a show correlate about as well with TV ratings as the larger num-ber of tweets posted during a show. These results can be interpreted as implying that estimated TV ratings could al-ready be publicized at the start of the show. However, the high correlation drops to medium or low correlation when the single or two most watched shows are left out.
If we zoom in on Figures 1 and 2, we see that for most TV programmes, the different episodes of one programme have similar TV ratings in general. In other words, the number of watchers for a programme are constant during the sea-son. The correlation between the ratings of two following episodes is 0.98. Thus the ratings of a programme are pre-dictable from the ratings of the previous episode to a high degree. The number of tweets about programme differs a lot between the different episodes. Therefore the correla-tion of the episodes of a single programme is low in general (table 3), or even negative for two drama (police) series – the latter may be due to special episodes such as cliffhanger episodes or season finales, which draw roughly the same viewers as other episodes, but trigger more reactions on Twitter.
From these results, we conclude that predicting TV ratings from tweets is not as promising with this simple method as was the prediction of election results with a similar method based on hashtags and counts. The most popular shows stand out with the most tweets as well as the highest rat-ings, leading to a high correlation for the 11 most popular programmes overall. The larger shows bias this result, since for the other programmes a higher number of tweets does not always go together with higher ratings. Programmes that are less popular than these 11 are not expected to show a more positive result.
6.
Future Work
We adopted a simple method to count the number of tweets relevant for a show; we just counted hashtags. Some im-provements over this method are possible. A first step would be to take into account the other contents of the tweets. We may want to filter tweets based on their con-tents, in order, for instance, to only take those tweets into account that have a positive sentiment, as negative tweets may indicate the dislike of a show and may be indicative of the poster not watching the show.
se-ries, documentase-ries, etc. This was ignored in these ex-periments; our relatively small selection featured weekly shows only, with a majority of game and talent shows but also drama (and police) series. We expect that some types of programmes generate a larger amount of tweets from the audience than others. Game shows in which candi-dates are voted off are known to be much tweeted about (see (Christopher Buschow, 2014)). In future experiments we would need to enlarge our data set with more TV pro-grammes and conduct per-genre analyses. We may look at non-weekly programmes as well, both of the daily type (such as the daily news) and the irregular type (such as sports events), as some of these tend to attract massive viewing numbers as well – also for these events we may prove to be predictive of viewer ratings ahead of the broad-cast.
Finally, we may want to use other types of social media and crowd-generated content, such as internet fora, to comple-ment the Twitter stream as a basis for computing statistics. Not only is the Twitter stream quite sparse when it comes to numbers of tweets per episode of a show (cf. Table 2), the Twitter user demography may also be biased towards age groups, and other social media may offer complementary perspectives on TV from differently composed user groups.
7.
Bibliographical References
Cheng, Y.-H., Wu, C.-M., Ku, T., and Chen, G.-D. (2013). A predicting model of tv audience rating based on the facebook. In Social Computing (SocialCom), 2013 In-ternational Conference on, pages 1034–1037, Sept. Christopher Buschow, Beate Schneider, S. U. (2014).
Tweeting television: Exploring communication activi-ties on twitter while watching tv. Communications, 39 (2):129–149.
Deller, R. (2011). Twittering on: Audience research and participation using twitter. Participations, 8 (1):216– 245.
Oh, C., Yergeau, S., Woo, Y., Wurtsmith, B., and Vaughn, S. (2015). Is twitter psychic? social media analytics and television ratings. InThe Second International Confer-ence on Computing Technology and Information Man-agement.
Sanders, E. and Van den Bosch, A. (2013). Relating po-litical party mentions on twitter with polls and election results. InProceedings of DIR-2013, pages 68–71. Tjong Kim Sang, E. and Van den Bosch, A. (2013).
Dealing with big data: The case of twitter. Compu-tational Linguistics in the Netherlands Journal, 3:121– 134, 12/2013.