Open Access
Proceedings
Controlling for false positive findings of trans-hubs in expression
quantitative trait loci mapping
Jie Peng*
†1, Pei Wang
†2and Hua Tang
3Address: 1Department of Statistics, University of California, Davis, California 95616, USA, 2Public Health Science, Fred Hutchinson Cancer Research Center, 1100 Fairview Avenue North, Seattle 98109 Washington, USA and 3Department of Genetics, Stanford University, Stanford, California 94305, USA
Email: Jie Peng* - [email protected]; Pei Wang - [email protected]; Hua Tang - [email protected] * Corresponding author †Equal contributors
Abstract
In the fast-developing field of expression quantitative traits loci (eQTL) studies, much interest has been concentrated on detecting genomic regions containing transcriptional regulators that influence multiple expression phenotypes (trans-hubs). In this paper, we develop statistical methods for eQTL mapping and propose a new procedure for investigating candidate trans-hubs. We use data from the Genetic Analysis Workshop 15 to illustrate our methods. After correlations among expressions were accounted for, the previously detected trans-hubs are no longer significant. Our results suggest that conclusions regarding regulation hot spots should be treated with great caution.
Background
The emerging microarray-based gene expression technol-ogy enables quantitative geneticists to conduct systematic, genome-wide linkage analysis to detect genomic loci that control gene-expression variations. One of the common features of expression quantitative trait loci (eQTL) stud-ies is the detection of trans-hubs, "chromosomal regions that affect the expression of a much larger number of genes than expected by chance" [1]. However, a major concern in trans-hub detection is the high false-positive rate due to the complex correlation structure of gene expressions [1]. If a group of genes are highly correlated and a QTL is detected for one of them, then there is a large chance that other expression phenotypes in this group are also mapped to the same QTL, regardless of whether the reason for co-expression is indeed co-regulation at this QTL.
In this paper, we first describe a robust score statistic method designed for three-generation pedigrees for link-age detection. We then introduce a new method for inves-tigating candidate trans-hubs. To account for correlations among gene expressions, we treat the expression of addi-tional genes as covariates in the variance-component model of a target gene, and employ sparse regression tech-niques to remove the covariates' components before test-ing linkage. The effects of accounttest-ing for expression correlations in linkage analysis are illustrated in the Results.
We apply the proposed methods on Genetic Analysis Workshop 15 (GAW15) Problem 1 data [2-4]. This data set consists of 14 three-generation Centre d'Etude du Pol-ymorphisme Humain pedigrees. Genotypes of 2882 auto-somal and X-linked SNPs are provided for each from Genetic Analysis Workshop 15
St. Pete Beach, Florida, USA. 11–15 November 2006
Published: 18 December 2007
BMC Proceedings 2007, 1(Suppl 1):S157
<supplement> <title> <p>Genetic Analysis Workshop 15: Gene Expression Analysis and Approaches to Detecting Multiple Functional Loci</p> </title> <editor>Heather J Cordell, Mariza de Andrade, Marie-Claude Babron, Christopher W Bartlett, Joseph Beyene, Heike Bickeböller, Robert Culverhouse, Adrienne Cupples, E Warwick Daw, Josée Dupuis, Catherine T Falk, Saurabh Ghosh, Katrina A Goddard, Ellen L Goode, Elizabeth R Hauser, Lisa J Martin, Maria Martinez, Kari E North, Nancy L Saccone, Silke Schmidt, William Tapper, Duncan Thomas, David Tritchler, Veronica J Vieland, Ellen M Wijsman, Marsha A Wilcox, John S Witte, Qiong Yang, Andreas Ziegler, Laura Almasy and Jean W MacCluer</editor> <note>Proceedings</note> <url>http://www.biomedcentral.com/content/pdf/1753-6561-1-S1-info.pdf</url> </supplement>
This article is available from: http://www.biomedcentral.com/1753-6561/1/S1/S157
© 2007 Peng et al; licensee BioMed Central Ltd.
individual. Expression levels of ~8500 genes in lymphob-lastoid cells were obtained using the Affymetrix Human Focus Arrays [4].
Methods
Variance-component model and score statistics
In this section, we derive robust score statistics under the variance-component model [5] to map QTLs. We assumed Hardy-Weinberg equilibrium and linkage equi-librium throughout. The single-locus additive model for a phenotype Y having a mean value μis given by
Y = μ+ αm + αf + e, (1)
where αi = αi(τ) denotes the additive genetic effect of allele
x at locus τ(the subscript m or f denotes the parental ori-gin of the allele). We assume that E(αm) = E(αf) = 0, that αm and αf are uncorrelated, and that the residual term e is uncorrelated with the explicitly modeled genetic effects. It is straightforward to compute the conditional covariances given the identity-by-decent (IBD) sharing numbers under Eq. (1). For example, for two siblings i, j,
, where νij(τ) is
the IBD sharing number between the two siblings at the trait locus τ, ρs is the phenotypic correlation among
sib-lings and is the linkage parameter.
For each phenotype Y, the null hypothesis of no linkage can be written as H0: α0 = 0. The working assumption for the variance-component model is that the conditional distribution of the phenotypes in a pedigree given the pair-wise IBD sharing information at a QTL is multivariate normal. At marker t (a putative trait locus), the score
sta-tistic for testing α0 = 0 is then , where n
is the number of pedigrees and
Here, Yi denotes the vector of phenotypes in the ith pedi-gree; Ai(t) is the IBD sharing matrix for the ith pedigree at marker t:
where is the estimated IBD sharing number between
the jth and κth member at marker t; μ, σ
Y, Σ are the pheno-typic mean, variance, and correlation matrix, respectively. We consider three different types of phenotypic tions for the three-generation pedigree: sibship correla-tion (ρs); grandparent-grandchild correlation (ρg); and
parent-offspring correlation (ρo). All of these nuisance parameters are estimated by their corresponding sample estimators. We then standardize the above score by its conditional variance given the phenotypes:
. Let
ai,t(j, κ) = Ai(t)(j, κ), then the calculation of the above
quantity involves estimation of E[ai,t(j, κ)ai,t(j'k')]. We identify 11 different types of cross products for two pairs (j, κ) and (j'k') which have a nonzero expectation (e.g., (j, κ) and (j'k') are two sib pairs with one sibling in com-mon). We pool the same type of cross products across all pedigrees and estimate the above expectation by sample mean.
We then define the robust score statistic at marker t as
, which is asymptotically normally
distributed with mean zero and variance one, no matter what the actual phenotypic distribution is. Because we do not know the location of the QTL τ, we scan the whole genome with the test statistic: Zmax = maxtZ(t), where the maximum is taken over all marker loci t throughout the genome.
Investigation of trans-hubs
When linkage exists between a genome region and an expression phenotype, the regulation can be "indirect" and act through one or more intermediate genes (that is, this region regulates some intermediate genes and their expression in turn regulate the phenotype). Such indirect regulations are usually less interesting. To detect biologi-cally interesting trans-hubs, only direct linkage would be meaningful. In this section, we propose a method to dis-tinguish direct and indirect regulations/linkages.
We will illustrate the idea through a simple example. Con-sider a system of three components: one candidate QTL (X) and two expression phenotypes: Y1, Y2. It can be shown that if both Y1 and Y2 are linked to X and if the link-age strength (defined as the proportion of variation explained by X) of Y2 is no greater than that of Y1, then the system will match to one of the two models: a) X regulates
Y1 and X regulates Y2 (connection between Y1 and Y2 is
limitation of space, detailed models and proofs are omit-ted.) We need to distinguish these two models in order to decide whether the linkage between X and Y2 is direct (Model (a)) or indirect (Model (b)). This can be revealed through investigating the residual R21 of the regression model Y2 ~ Y1: under Model (a), R21 links to X; while under Model (b), R21 does not link to X. On the other hand, if we consider the regression model Y1 ~ Y2, the residual R12 will link to X under both models. However, the linkage might be weak. Therefore, in order to avoid performing unnecessary linkage tests on residuals, which decreases the power, we propose to first order the expres-sion phenotypes with respect to their linkage strength at the candidate hub; and then for each expression trait, only those phenotypes with stronger linkage evidence are used as covariates to derive the corresponding residual in the model below. As a result, for any pair of expression traits, there is only one model having the two traits on the oppo-site sides of the equation.
According to the above discussion, we introduce the vari-ance-component model
Yi = μ+ Y-iβ+ αm + αf + e, (2)
where a set of expression phenotypes other than Yi are treated as covariates (Y-i). Define Ri = Yi - Y-iβ. Model (2) becomes Ri = μ+ αm + αf + e, for which the score statistics described previously can be applied to test linkage. Thus, the remaining task is to properly derive Ri: the residual of the regression model Yi ~ {Y-i}. Because of the high dimensionality of the expression phenotypes ({Y-i}), it is crucial to maintain sparsity in the regression models to avoid over-fitting. For this purpose, we apply a sparse regression technique called elastic net [6] to derive Ri. Elastic net aims to minimize the loss function L(λ1, λ2, β) = ||Y - Xβ||22 + λ
2||β||22 + λ1||β||1. The ridge penalty term encourages a grouping effect: strongly correlated predic-tors tend to be in or out of the model together; the lasso penalty term enables the algorithm to have a more sparse representation and thus serves as a model selection tool [6].
We propose the following procedure for investigating a candidate trans-hub region:
1. Order expression phenotypes according to the linkage strength to this region (based on the score statistics Z at the hub) from the largest to the smallest.
2. For the ith ordered expression Y
(i), perform Elastic net regression Y(i) ~ {Y(j)}j<i with λ2 = 1 and maximum step kmax. Record the corresponding residue as R(i).
3. Perform linkage analysis on {R(i)}i using the robust score statistics.
4. An expression trait is considered to have a direct linkage to the candidate region if both the original expression Yi
and residual Ri show significant evidence of linkage.
For the GAW15 application, the maximum step for run-ning elastic net is set to be kmax = 20, which is the mean optimal step chosen using Mallows' CP criterion [7] among 100 randomly picked regression models (in each model, the expression of one randomly chosen gene is regressed on the expressions of all other genes).
Data analysis
We first performed an empirical normal quantile transfor-mation for each gene's expression to make them margin-ally normal [8], for the purpose of improving power of linkage detection. We want to point out that the validity of our test statistic is robust to the distributional assump-tion of the phenotypes because it is standardized by the conditional variance of the score statistic [9,10].
For genotype data, 1197 SNPs were selected from 22 auto-somes, such that the inter-marker distance is at least 0.1 cM to avoid linkage disequilibrium. The resulting map has an average inter-marker space of 3.1 cM, mean heter-ozygosity of 0.42, and mean missing rate of 3.89%. Merlin [11] was used for IBD inference based on the Rutgers sex average linkage map provided by Sung et al. [12]. Linkage tests were performed for the 3554 most variable genes selected by Morley et al. [4] and gender was used as a cov-ariate.
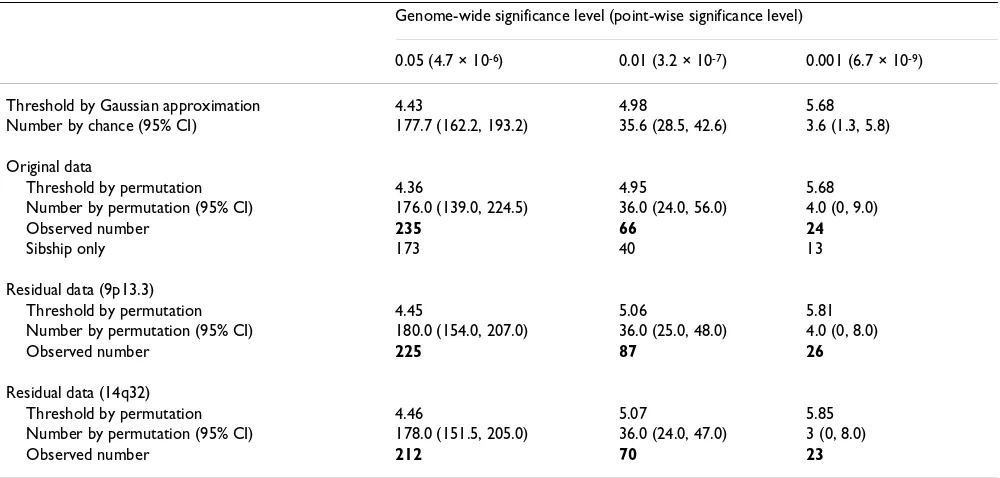
The threshold at each genome-wide significance level was estimated based on 500 permutations. In each permuta-tion cycle, pedigrees of the same size were permuted; within a pedigree, phenotypes were permuted among individuals of the same type (i.e., generation and gender). We also calculated the thresholds according to a Gaussian approximation with skewness correction [10], which results in similar thresholds (Table 1). We observed that the confidence intervals derived from permutation are wider than what would be expected if all tests were inde-pendent. This also suggests that the correlations among gene expressions should not be ignored when examining false positives.
Results
and DDX17). We also performed genome scans using only sibship data, which, not surprisingly, resulted in a lower power compared to the analysis using whole pedi-grees (Table 1).
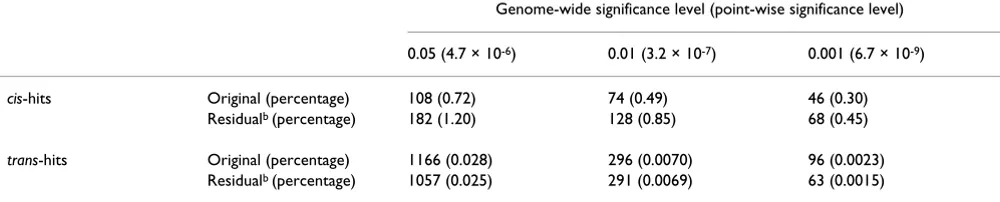
Following Morley et al. [4], we define cis-regulators as the eQTL that map within 5 megabases (Mb) of the target gene and all other eQTL are defined as trans-regulators. To illustrate the proposed trans-hub investigation method, we examine the trans-eQTL events (based on the original expression data) at the genome-wide 0.05 significant level to harvest enough eQTL hits for deriving candidate trans -hubs. The numbers of trans-hits and cis-hits at different significance levels are summarized in Table 3. The number of trans-hits dropped dramatically as the signifi-cance levels became more stringent, indicating an overall
lower confidence of the trans-linkage detection. The genomic locations of the eQTLs detected at the 0.05 sig-nificant level suggest two possible hot spots, one at 9p13.3 (30.8 Mb to 35.1 Mb) with 13 trans-hits, and another at 14q32 (94.7 Mb to 98.2 Mb) with 11 trans-hits (Figure 1, left panel). The latter region, 14q32, has also been recognized as a candidate trans-hub by Morley et al. [4]. If regulators for expression phenotypes were inde-pendently and randomly distributed along the genome, the probability of the maximum number of hits being at least 13 or 11 are both less than 1 × 10⁻⁶. However, based on permutation results (in the original data), the chance of observing a trans-hub with at least 13 hits is about 11.2%, and the chance of at least 11 hits is as high as 22.4%. These numbers imply that the false detections of
trans-eQTL are clustered instead of uniformly distributed
Table 1: Number of expressions with at least one significant eQTL
Genome-wide significance level (point-wise significance level)
0.05 (4.7 × 10⁻⁶) 0.01 (3.2 × 10⁻⁷) 0.001 (6.7 × 10⁻⁹)
Threshold by Gaussian approximation 4.43 4.98 5.68
Number by chance (95% CI) 177.7 (162.2, 193.2) 35.6 (28.5, 42.6) 3.6 (1.3, 5.8)
Original data
Threshold by permutation 4.36 4.95 5.68
Number by permutation (95% CI) 176.0 (139.0, 224.5) 36.0 (24.0, 56.0) 4.0 (0, 9.0)
Observed number 235 66 24
Sibship only 173 40 13
Residual data (9p13.3)
Threshold by permutation 4.45 5.06 5.81
Number by permutation (95% CI) 180.0 (154.0, 207.0) 36.0 (25.0, 48.0) 4.0 (0, 8.0)
Observed number 225 87 26
Residual data (14q32)
Threshold by permutation 4.46 5.07 5.85
Number by permutation (95% CI) 178.0 (151.5, 205.0) 36.0 (24.0, 47.0) 3 (0, 8.0)
Observed number 212 70 23
Table 2: Expression phenotypes with the strongest evidence of linkage from genome scans
Point-wise p-value Gene Gene location cis/trans eQTL location
<10-15 LRAP 5q15 cis Chr 5 (99080578)
<10-15 HLA-DQB1 6p21.3 transa Chr 6 (37592767)
<10-15 CHI3L2 1p13.3 cis Chr 1 (111704864)
<10-15 POMZP3 7q11.23 cis Chr 7 (75651464)
<10-14 CSTB 21q22.3 cis Chr 21 (44061921)
<10-14 TBC1D8 2q11.2 transa Chr 2 (108214542)
<10-13 DSCR2 21q22.3 trans Chr 9 (75300235)
<10-13 CRYZ 1p31-p22 transa Chr 1 (67949299)
<10-11 EGR2 10q21.1 trans Chr 20 (42643248)
<10-11 TM7SF3 12q11-q12 transa Chr 12 (39239200)
<10-11 DDX17 22q13.1 cis Chr 22 (39410468)
along the genome. We hypothesize that this is partly due to the expression correlations.
To further investigate our hypothesis, we adjusted for the expression correlations as described in the Methods on
the trans-hub at 9p13.3. The linkage results of residuals
are also summarized in Table 1, which show comparable number of eQTL detections as before. At the genome-wide 0.001 significance level, 26 expression phenotypes were identified, of which 9 overlap with the original 24 expres-sion phenotypes mapping to the similar chromosomal regions (TBC1D8, HLA-DPB1, CSTB, BCKDHA, DSCR2,
POMZP3, CHI3L2, HSD17B12, and TM7SF3). However,
the hub phenomenon becomes much less obvious now:
trans-eQTL hits were very evenly distributed along the
genome (Figure 1, right panel). One explanation is that the overall pair-wise expression correlations in the resid-ual data are much smaller than those in the original data: the median absolute correlation is 0.052 and 0.139, respectively. The maximum number of trans-hits of one 5-Mb region at the genome-wide 0.05 significance level is
only 4. The number of trans-hits at 9p13.3 drops to 3, while among the 500 permutation cycles performed on residual data, none has a maximum number of trans-hits smaller than 3. The same analysis is done for the trans-hub at 14q32 and the results are similar (Table 1). The number
of trans-hits at 14q32 drops to 4.
Thus, we conclude that there is not enough evidence to claim either two candidate regions we examined as a trans -hub. However, we do find two statistically significant,
trans-regulated, phenotypes: DSCR2 (Down Syndrome
Critical Region gene 2) is the most significant (point-wise
p-value of 10-12) gene linked to the 9p13.3 region;
MAP3K6 also shows strong evidence of linkage to the
same region according to both the original phenotype and the residual phenotype. MAP3K6 encodes a member of the serine/threonine protein kinase family, and has a point-wise p-value of 3 × 10⁻⁷. The correlation between expressions of DSCR2 and MAP3K6 is quite small: 0.074. These two trans-regulations may deserve further investiga-tion.
Table 3: Number of cis-hits and trans-hitsa
Genome-wide significance level (point-wise significance level)
0.05 (4.7 × 10⁻⁶) 0.01 (3.2 × 10⁻⁷) 0.001 (6.7 × 10⁻⁹)
cis-hits Original (percentage) 108 (0.72) 74 (0.49) 46 (0.30) Residualb (percentage) 182 (1.20) 128 (0.85) 68 (0.45)
trans-hits Original (percentage) 1166 (0.028) 296 (0.0070) 96 (0.0023)
Residualb (percentage) 1057 (0.025) 291 (0.0069) 63 (0.0015)
aThere are 4,239,027 trans-pairs and 15,111 cis-pairs in total bResiduals are regarding 9p13.3 (See text for more details.) Distribution of trans-hit along the genome
Figure 1
Distribution of trans-hit along the genome. The x-axis represents the genome order of the 1197 markers. The y-axis represents the number of trans-hits in a 5-Mb neighborhood region of each marker. Markers on different chromosomes are separated by vertical gray lines. The left panel is for the original expression data. The right panel is for the residual analysis with respect to 9p13.3. The positions of DSCR2 (21q22.3) and MAP3k6 (1p36.11), which show strong evidence of trans-linkage to 9p13.3 region, are indicated in the left panel.
Publish with BioMed Central and every scientist can read your work free of charge "BioMed Central will be the most significant development for disseminating the results of biomedical researc h in our lifetime."
Sir Paul Nurse, Cancer Research UK
Your research papers will be:
available free of charge to the entire biomedical community
peer reviewed and published immediately upon acceptance
cited in PubMed and archived on PubMed Central
yours — you keep the copyright
Submit your manuscript here:
http://www.biomedcentral.com/info/publishing_adv.asp
BioMedcentral
Discussion
In this paper, we perform linkage analysis for GAW15 data using robust score statistics, which enjoy excellent compu-tational efficiency (20 seconds for computing the score statistics for 3554 expressions on 1197 markers in R on a Thinkpad X40 laptop), and enable us to carry out large-scale permutation studies. Using the original phenotypes, we identify two candidate trans-hubs, one at 9p13.3 and the other at 14q32. However, after accounting for the expression correlations in the linkage analysis, both trans -hubs disappear. This suggests that conclusions with regard to regulation hot spots should be interpreted with great caution.
Controlling false positives is one of the most important concerns in processing large high dimensional data sets. Without the controlling of false positives, power is not a meaningful quantity. In this paper, we focused on hubs of direct trans-regulation, which is conceptually different from the situation where both direct and indirect linkages are sought after. For this purpose, there are two types of false positives: i) the locus and the gene are not linked at all, while a linkage is claimed; ii) the locus and the pheno-type are indirectly linked, while a linkage is counted as a direct regulation. The proposed method helps to prevent both types of false positives. Protection against the second type of false positives is discussed in the Methods. As to the first type of false positives, due to correlations among expressions, they do not randomly distribute along the genome. The proposed method also acts as a safeguard against detecting false hubs resulting from this source, since the residuals are usually much less correlated.
Competing interests
The author(s) declare that they have no competing inter-ests.
Acknowledgements
The authors want to thank two anonymous reviewers whose comments led to significant improvements of the paper.
This article has been published as part of BMC Proceedings Volume 1 Sup-plement 1, 2007: Genetic Analysis Workshop 15: Gene Expression Analysis and Approaches to Detecting Multiple Functional Loci. The full contents of the supplement are available online at http://www.biomedcentral.com/ 1753-6561/1?issue=S1.
References
1. Koning D, Haley C: Genetical genomics in humans and model organisms. Trends Genet 2005, 21:377-381.
2. Cheung V, Conlin L, Weber T, Arcaro M, Jen K, Morley M, Spielman R: Natural variation in human gene expression assessed in lymphoblastoid cells. Nat Genet 2003, 33:422-425.
3. Cheung V, Spielman R, Ewens K, Weber T, Morley M, Burdick J: Map-ping determinants of human gene expression by regional and whole genome association. Nature 2005, 437:1365-1369. 4. Morley M, Molony C, Weber T, Devlin J, Ewens K, Spielman R,
Che-ung V: Genetic analysis of genome-wide variation in human gene expression. Nature 2004, 430:743-747.
5. Almasy L, Blangero J: Multipoint quantitative-trait linkage anal-ysis in general pedigrees. Am J Hum Genet 1998, 62:1198-1211. 6. Zou H, Hastie T: Regularization and variable selection via the
elastic net. J Roy Stat Soc B 2005, 67:301-320.
7. Mallows L: Some comments on CP. Technometrics 1973, 15:661-676.
8. Wang K, Huang J: A score-statistic approach for the mapping of quantitative-trait loci with sibships of arbitrary size. Am J Hum Genet 2002, 70:412-424.
9. Peng J, Siegmund D: Mapping quantitative traits under ascer-tainment. Ann Hum Genet 2006, 70:867-881.
10. Tang HK, Siegmund D: Mapping quantitative trait loci in oligo-genic models. Biostatistic 2001, 2:147-162.
11. Abecasis G, Cherny S, Cookson W, Cardon L: Merlin-rapid analy-sis of dense genetic maps using sparse gene flow trees. Nat Genet 2002, 30:97-101.