Volume 8, No. 5, May – June 2017
International Journal of Advanced Research in Computer Science
RESEARCH PAPER
Available Online at www.ijarcs.info
Students Academic Performance Using Partitioning Clustering Algorithms
Humamuddin
Department of Computer Science and Engineering School of Engineering Sciences and Technology
Jamia Hamdard (Hamdard University) New Delhi - 110062, India
Md. Tabrez Nafis
Department of Computer Science and Engineering School of Engineering Sciences and Technology
Jamia Hamdard (Hamdard University) New Delhi - 110062, India
Syed Taha Owais
Scientist ‘D’
NIC, Ministry of Electronics and I.T. New Delhi, India
Abstract: With time, the data is growing at a very high rate. The issue is not in storing the data, but in extracting the valuable information from it. Data mining techniques serve as a good means for extracting valuable patterns (knowledge) from the data. Now, talking about the Educational Field, Academic Institutes and Universities are worried about their student’s performance because it’s a key factor for the growth and ranking of the institutes. Data in educational institutes is also growing at a very high rate as the number of students are increasing every year. It’s a tedious task to monitor and predict the performance of students by normal methods. Data Mining techniques are very helpful in doing this job. In this paper, we have used K-Means, K-Medoids and X-Means clustering algorithms which will help in categorizing the students into several groups based on their performance.
Keywords: Data Mining, Clustering, Student Performance, K-Means, K-Medoids, X-Means
I. INTRODUCTION
At the present time, we are not only interested in obtaining and collecting the huge amount of data, but in generating the valuable information from that data. The quantity of data obtained is having a colossal growth, therefore, appropriate tools and techniques are required to process the huge data in order to extract the useful and valuable information which will help us to take decisions on that data. That is why data mining has grown into an essential research area.
Performance analysis is a very important factor in academic institutions and student marks or grade is a key role. The most important factor which is used to judge a student performance in the college are marks. The other factors like industry internships, projects completed, and skills set like knowledge of programming languages also play a crucial role in employment opportunities for a student. We should not group the students only on the basis of marks they are scoring and ignoring their extracurricular activities. So, we should group students considering other parameters like the projects done, industry internships, programming skills, etc. so as to obtain the comprehensive view of the performance of the student and simultaneously find out the details from their time to time result. This paper is focused on the implementation of data mining technologies and a method for acquiring student overall performance during their entire semester. The research work uses K-Means, K-Medoids and X-Means clustering for categorizing students in different clusters. This will also help the students and faculty to concentrate on improving approaches by way of monitoring the performance of the students. The paper is structured as follows: Related Work, Methodology, Experimental Setup, Results & Discussions, Conclusions and References.
II. RELATED WORK
other techniques. Oyelade, O. J, Oladipupo, O. O, Obagbuwa, I. C [6] in this paper, a simple and qualitative methodology was provided to compare the predictive power of clustering algorithm and a Euclidean distance as a measure of similarity distance. S Chaitanya Kumar, E Deepak Chowdary, Venkatramaphanikumar S, K V Krishna Kishore [7] in this paper, factors impact on academics like Online-learning skills, problem solving efficiency, Time management etc. was considered to predict the performance of student in semester end examinations. In the paper [8], authors introduced a novel task to computational linguistics and machine learning: determining whether a news-wire article is true or satirical. The Authors found that the combination of SVMs and BNS feature scaling achieves high precision. M T Nafis et al [9] studied that as against the popular notion that the users with maximum social connection might not be the actual Influencers. The PageRank algorithm does not take into account the enthusiasm of users actually contributing in the information propagation by retweeting the posts shared by the content generator. More the number of retweets by multiple users in the follower graph is better than the Influencing capability of the user. Mangal Singh, M Tabrez Nafis [10] demonstrated sentiment classification and scaling with similarity evaluation among reviews. Review data is pre-processed and cleaned for data processing. Multi layered training data and related sentiment vectors with WordNet are used to transform reviews to intermediate form. In the paper [11] authors proposed a solution to address CoCoS problem by exploiting the user social network information that was obtained by tracking the activities of the users.
III. METHODOLOGY
(1) Firstly, the core of any data mining job is data collection. In this research work, the dataset used is the student data of B.Tech. Batch.
(2) Pre-processing was done on the collected data and missing values are removed (if any).
(3) Data Mining techniques are applied on the pre-processed dataset for obtaining the clusters.
(4) Performance Measures were applied to check the performance of the clustering.
IV. EXPERIMENTAL SETUP
A. Dataset
The data was collected from the student placement data. The dataset was preprocessed by applying the Normalize Operator to remove missing and noise values (if any). A sample of 94 students was obtained for analysis. To calculate the performance of students, different attributes considered are 10th, 12th, and B. Tech percentage, Aggregate percentage,
industry internships, projects completed, and skills set like knowledge of programming languages.
B. Attribute Selection
We considered the attributes: industry internships, projects completed, skills set like knowledge of programming languages, Aggregate percentage of 10th, 12th, and B.Tech. to
find out the performance of students. The attributes like Gender, Address, Contact Number, Date of Birth were discarded for performance analysis because they are unnecessary for student performance analysis.
C. Tool Used
Rapid Miner Studio 7.5
Performance Analysis is done using the RapidMiner Studio tool, it’s an open source tool and can be used for text and data mining. You will not be required to do any programming because all the operators of a large number of algorithms are there in RapidMiner, you have to only drag and drop the operator according to your requirement. Analysis can be shown in various forms like chart, bar, histogram, scatter etc.
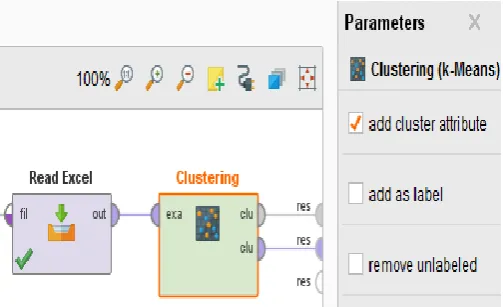
Fig. 1, shows the diagrammatic arrangement of the Read Excel Operator which reads Data from the excel file.
[image:2.595.310.559.328.485.2]Figure 1. Read Excel Operator
Fig. 2, shows the Clustering (K-Means) operator which applies K-Means clustering algorithm, the input port takes an ExampleSet(Dataset) from the output port of Read Excel operator and it delivers the cluster model.
[image:2.595.307.559.581.734.2]Fig. 3, shows the Clustering (K-Medoids) operator which applies K-Medoids clustering algorithm, the input port takes an ExampleSet(Dataset) from the output port of Read Excel operator and it delivers the cluster model.
Figure3. Clustering Operator (K-Medoids)
Fig. 4, shows the X-Means operator which applies X-Means clustering algorithm, the input port takes an ExampleSet(Dataset) from the output port of Read Excel operator and it delivers the cluster model.
Figure4. X-Means Operator
Fig. 5, shows the arrangement of all operators used for analysis. Normalize operator takes the ExampleSet(Dataset) from Read Excel operator and normalizes the attribute values of the selected attributes and delivers the normalized ExampleSet(Dataset) to the Clustering operator which then delivers the cluster model to the performance operator for performance evaluation of the clustering done.
Figure 5. Arrangement of all Operators
V. RESULTS AND DISCUSSIONS
Table I, shows the grade point scale and category on the basis of which the student’s performance is calculated.
Table I. Performance Scale
Scale Category
9.00 or above Excellent
7.00-8.99 Good
5.00-6.99 Average
4.99 or below Improvement needed
A. K-Means
Fig. 6, shows the accuracy, precision, recall and their respective confusion matrix.
Figure 6. Performance Vector (K-Means)
We applied K-Means clustering and took 3 clusters and found the results shown in table II:
Table II. Performance (K-Means)
Cluster No. of Students Performance
0 37 7.12
1 29 6.36
2 28 9.04
37 students performance is Good, 29 students performance is Average and 28 students performance is Excellent.
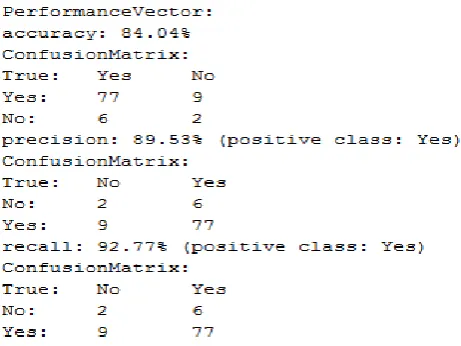
B. K-Medoids
Figure 7. Performance Vector (K-Medoids)
[image:4.595.311.555.76.125.2]We applied K-Medoids clustering and took 3 clusters and found the results shown in table III:
Table III. Performance (K-Medoids)
Cluster No. of Students Performance
0 43 5.92
1 18 9.14
2 33 7.56
43 students performance is Average, 18 students performance is Excellent and 33 students performance is Good.
C. X-Means
Fig. 8, shows the accuracy, precision, recall and their respective confusion matrix.
Figure 8. Performance Vector (X-Means)
[image:4.595.47.278.82.255.2]We applied X-Means clustering and took 3 clusters and found
Table IV. Performance (X-Means)
Cluster No. of Students Performance
0 44 8.18
1 23 6.76
2 27 9.22
44 students performance is Good, 23 students performance is Average and 27 students performance is Excellent.
VI. CONCLUSIONS
In this paper, student academic performance is done using the data mining techniques. We used three data mining techniques, namely K-Means, K-Medoids and X-Means. The results give the accuracy of 81.91% for K-Means, 84.04% for K-Medoids and 86.17% for X-Means. We found that the X-Means clustering technique gives the best result for student performance. Although K-Means and K-Medoids also performed well.
This work can be extended by increasing the size of the dataset and also taking more attributes for performance analysis. We can also use fuzzy technique by which the results will get enhanced.
VII. REFERENCES
[1] Ana Ktona, Denada Xhaja, Ilia Ninka, “Extracting Relationships Between Students’ Academic Performance and Their Area of Interest Using Data Mining Techniques”, 2014 Sixth International Conference on Computational Intelligence, Communication Systems and Networks. Pages:6-11, DOI: 10.1109/CICSyN.2014.18
[2] Muslihah Wook, Yuhanim Hani Yahaya, Norshahriah Wahab, Mohd Rizal Mohd Isa, Nor Fatimah Awang, Hoo Yann Seong, “Predicting NDUM Student’s Academic Performance Using Data Mining Techniques”, 2009 Second International Conference on Computer and Electrical Engineering. Year: 2009, Volume: 2, Pages: 357-361, DOI: 10.1109/ICCEE.2009168
[3] Ms. Tismy Devasia, Ms. Vinushree T P, Mr. Vinayak Hegde, “Prediction of Students Performance using Educational Data Mining”, 2016 International Conference on Data Mining and Advanced Computing (SAPIENCE), Pages: 91-95, DOI: 10.1109/SAPIENCE.2016.7684167
[4] Thaddeus Matundura Ogwoka, Wilson Cheruiyot, George Okeyo, “A Model for predicting Students’ Academic Performance using a Hybrid K-means and Decision tree Algorithms”, International Journal of Computer Applications Technology and Research, Volume 4, Issue 9, 693-697, 2015, ISSN: 2319-8656
[5] M. Mayilvaganan, D. Kalpanadevi, “Comparision of Classification Techniques for predicting the performance of Students Academic Environement”, 2014 International Conference on Communication and Network Technologies (ICCNT), Pages: 113-118, DOI: 10.1109/CNT.2014.7062736
[image:4.595.41.286.346.397.2] [image:4.595.38.268.534.708.2][7] S Chaitanya Kumar, E Deepak Chowdary, Venkatramaphanikumar S, K V Krishna Kishore, “M5P Model Tree in predicting Student Performance : A Case Study”, IEEE International Conference on Recent Trends In Electronics Information Communication Technology, May 20-21, 2016, India
[8] Syed Taha Owais, Md Tabrez Nafis, Seema Khanna, “An
Improved Method for Detection of Satire from User-Generated Content”, in (IJCSIT) International Journal of Computer Science and Information Technologies, Vol. 6(3), 2015, 2084-2088, ISSN:0975-9646
[9] M Tabrez Nafis, Alok Pathak, “To Find Influential’s in
Twitter based on Information Propagation” in
International Journal of Computer Applications (ISSN:0975 – 8887) Volume 118 – No. 13, 2015.
[10] Mangal Singh, M Tabrez Nafis, Neelmani, “Sentiment
Analysis and Similarity Evaluation for Heterogeneous-Domain Product Reviews” in International Journal of Computer Applications (ISSN:0975 – 8887) Volume 144 – No. 2, 2016.
[11] Afshan Shujat, M Tabrez Nafis, Vishal Sharma, “A