DOI: http://dx.doi.org/10.26483/ijarcs.v8i8.4623
Volume 8, No. 8, September-October 2017
International Journal of Advanced Research in Computer Science
RESEARCH PAPER
Available Online at www.ijarcs.info
ISSN No. 0976-5697
TRAFFIC ANALYSIS AND PREDICTION SYSTEM BY THE USE OF MODIFIED
ARIMA MODEL
Neha Verma
Harjinder Kaur
Mtech Schola Assistant Professor SSIET,Dinanagar SSIET,Dinanagar
Abstract: Traffic Prediction is critical as it is enhancing day by day leading to worst on road situations. Increased accidents and delays in critical applications is causing awful situations for the user. In order to resolve the problem Modified ARIMA is used. Modified ARIMA is implied over the dataset. The dataset for the implication is fetched from online source. The UCI website is used for traffic dataset time series analysis. Modified ARIMA is used to make stationery time series from dynamic series at AR phase. MI phase is used to predict number of previous values to be analyzed and MA phase is hybridized using KNN with Euclidean distance. The result of the proposed literature is presented in terms of accuracy and mean square error. Result shows significant improvement in terms of accuracy and means square error.
Keywords: Traffic prediction, delays, ARIMA, KNN, Euclidean distance
1. INTRODUCTION
Traffic is enhancing by leaps and bounds. Giving accurate prediction regarding traffic is need of the hour. The requirement of traffic prediction is critical in time specific applications. The environment such as ambulance movement, student needs to get back to exams or any other time critical application has significant usage of this research. Proposed literature utilizes techniques of data mining and ARIMA model for time series analysis.
The data that utilized for analyzing traffic at specified time is traffic flow data. This would help in predicting future traffic. The proper action is needed to be taken for reducing the congestion. By the use of traffic flow data this reduction of congestion has to be done as future prediction can be made.
Data Mining has quickly grown with the presence of the wonder BIG Data[1]. For sure, numerous associations have begun to digitize their records, and have changed their paper-based frameworks to electronic frameworks. This change conveys a few advantages to the associations, among them time funds, a superior administration and a more tightly checking making the assignments less demanding. One of the immediate results of this change is the visit gathering of significant Data. While the Data's holders started to stress over the capacity of Data, they understood the benefits they can take from it. The Data gathered can be considered as another unformatted of structure (Raw Data) which needs to be filtered. Handling Data give a superior quality Data which contribute in request to make choice in data selection[2]. Moreover, Healthcare elements likewise choose electronic frameworks, by utilizing different strategies, among them, Electronic health Record (EHR) or Electronic Traffic Records (EMR) frameworks. It implies the executing EHR frameworks, leads to an immense measure of Data gathered by doctor's facilities, centers and other traffic suppliers.[3] At that point, the vast majority of these Datasets are most certainly not extremely very much organized and fitting for explanatory purposes. In expansion, traffic Data are generally extremely perplexing and difficult to investigate. For instance the US Healthcare framework alone as of now achieved 150 Exabyte (1
Exabyte = 8388608 Terabit) five years prior. This pattern is because of the way that multi scale Data created from people is consistently expanding, especially with the new high-throughput sequencing stages, continuous imaging, and purpose of care gadgets, also as wearable figuring and versatile traffic innovations. As needs be, Data Mining has gotten a great deal of consideration on account of its solid capacity of separating Data from Data, furthermore, winds up noticeably prevalent in Healthcare field by dint of its productive diagnostic procedure for recognizing obscure and significant Data in traffic Data[1], [4].
of unadulterated water, human services administrations, social, natural and rural variables.
In this paper, we introduce the upsides of Data Mining for traffic and the reasons make Data Mining critical to be considered in traffic Data examination. Data mining traffic Dataset with missing values is considered to be analyzed initially through Support vector machine and accuracy is analyzed and after that ARIMA with KNN and Euclidean distance is used for rectification and analysis purpose[6]– [8][9][10]. Accuracy is observed in both the cases to prove worth of the study.
2. STUDY OF EXISTING LITERATURE
Data mining approaches is the base of this literature. Analysis of existing literature provide base for proposed literature. [11] Reviewed various models and methods used within data mining. Data mining techniques development from 2005 to 2015 is reviewed and application in regards to traffic is proposed. [1] Suggests the integration of traffic data with data mining strategies used to form traffic information system. Patient traffic condition can be analyzed along with future prediction about patient’s health. Hidden possibilities can be extracted using unlimited data mining techniques to make accurate health forecast. [12] Proposed multilayer perceptron in order to analyze big data corresponding to traffic. As literature deals with traffic of patients hence high degree of accuracy is desired. To accomplish the desired goal comparison of SVM and multilayer perceptron on traffic data set is made. Results of SVM in terms of classification are better as compared to multilayer perceptron. [3] Suggests data mining techniques used for analysis of diabetics. Support Vector Machine (SVM) is used for this purpose. Genetic approach is also analyzed for diabetic’s dataset in the field of data mining. Results of SVM are obtained to be better. [13] Suggests five J.48 classifiers to predict hypertension and eight other diseases. Prediction accuracy is obtained and compared against naïve bayes approach. Results in terms of J.48 are obtained to be better. [7] Suggests hybrid approach for traffic to predict diseases using Big data. Pruning based KNN is used for this purpose which used density based clustering based method integrated with KNN approach. Local outlier factor of PB-KNN is better as compared to KNN. [14] proposes SVM and neural network techniques for skin lesion detection in human body. Segmentation along with classification is performed in order to detect the diseases. [8]predict heart diseases are primary cause of death among humans in last decade. Data mining techniques are used in order to detect and predict heart diseases efficiently. [4] proposes a mechanism through which information about patient coming for checkup at hospital is stored and algorithm is applied in order to perform predictions. Data mining algorithm considered in this approach is naïve bayes. Accuracy of prediction is obtained is significant in this case.[15] suggests intelligent heart disease prediction system. Decision tree , naïve bayes and neural network technique are used for accurate analysis and prediction of disease.
Analyzed approaches enhance performance considering datasets not including any noisy or missing values. Missing values or noisy data handling and increasing prediction accuracy is primary task of proposed approach.
3. PROPOSED SYSTEM
Proposed system uses ARIMA model for time series analysis. ARIMA is hybridised by the use of KNN and Euclidean distance mechanism to achieve better accuracy and reduce Mean square error
3.1 ARIMA
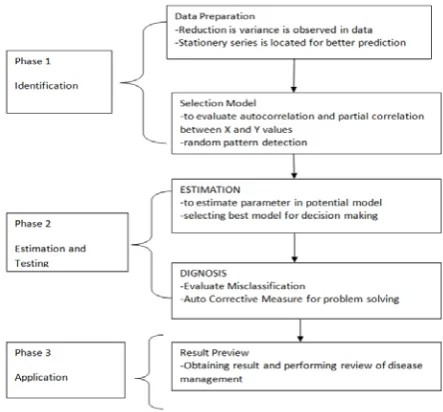
[image:2.595.319.541.284.490.2]For precise forecast of infection recognition the Auto backward moving normal model is utilized. By utilizing scientific model the alteration in time arrangement are to be done in ARIMA.This model depends on modification of watched qualities. The objective is to get the distinctions of watched esteem and esteem gotten from the model near zero. This model can foresee precisely distinction between the stationery and non stationery arrangement.
Figure 1: ARIMA Model Description
3.2 KNN
[16][17] uses a KNN technique for detecting heart disease and performing prediction accurately by simplifying parameters. The elements that have homogenous properties are grouped together by using grouping functions and these elements have been identified by nearest neighbourhood algorithm. For determining the problem the comparison of threshold values against the values generated by grouping function are to be done. Problems are reflected in the form of deviation. The process is described by considering two points ‘A’ and ‘B’. Let distance(A,B) is the distance between points A and B then
a. distance(A,B)=0 and distance(A,B) >=0 iff A=B b. distance(A,B)=distance(B,A)
c. distance(A,C)<=distance(A,C)+distance(C,B)
Accuracy=1-Error_rate
where Error_rate is given as
Error_rate=
KNN is used in many distinct environments such as classification, interpolation, problem solving, teaching and learning etc. Major limitation of KNN is that its performance depends upon value of k. Accuracy is low and further work is required to be done to improve accuracy.
3.3 EUCLIDEAN DISTANCE
[18]The simplest method for prediction and grouping is Euclidean distance where the distance has been utilized in order to evaluate the deviations. Distance can be defined in
several ways. Let is the distance of
points in terms of x coordinate and is
the distance in terms of y coordinate. The Euclidean distance is defined as
Where i define range of values from 1 to n. All the components of vectors are taken equally and no correlation is evaluated in this case. The result of Euclidean distance equation can be normalized. This is accomplished as
Where averaging is taken over all the vectors in the dataset. The scaled distance is obtained using the following equation
The scaled distance is adjusted value so that obtained result lie between the specified range. The metric is used to evaluate errors.
[19]–[21] For observing errors and accuracy Mean root square error mechanism is to be utilized. Accuracy and error rate is inversely proportional to each other.
This equation is used to evaluate Root Mean square error. Lower the value of RMS more accurate a prediction. Advantage of this approach is, convergence rate is better but disadvantage is that it can work over limited values. Non negative values are allowed and hence result always lies between 0 and 1.
3.2 Decision Implementation
The implementation of decision is final round in the visualization and rerouting of traffic monitoring. The people flow information is extracted from dataset and then using visualization meaningful information is extracted and used to divert the traffic to different routes in case of heavy congestion. Future prediction is made using this phase.
4. METHODOLOGY
The methodology for the proposed system is described as under
4.1 Algorithm
The proposed work starts by extracting datasets from UCI related to Traffic. The data which is extracted is applied with feature extraction. The extracted features are applied with compression techniques to reduce the size of the data. This is critical in order to use bandwidth efficiently. Classifier such as KNN + EUCLIDEAN DISTANCE is used to determine the future predictions concerning to traffic. Comprehensive approach is listed as follows
1. Obtain the dataset from UCI website related to Traffic data.
2. Apply Feature extraction mechanism to extract only required attributes. Clustering K-Means mechanism is utilized for this purpose.
3. Obtain data is passed through a classifier in order to obtain realistic future predictions.
4. Check for heavy traffic through prediction and apply KNN+Euclidean distance algorithm to determine closest neighbors and reduce error rate if any in terms of MSE and RMSE.
4.2 Flowchart
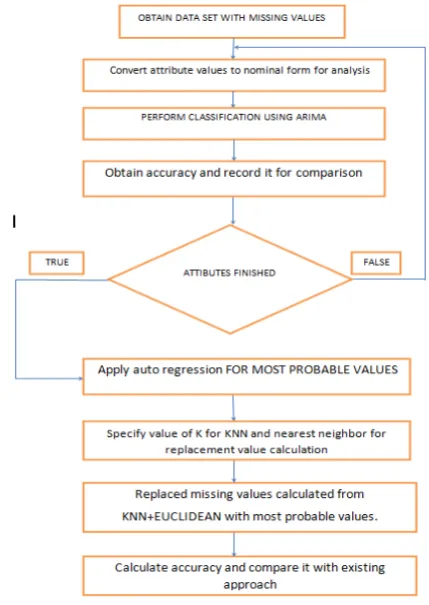
[image:3.595.325.540.360.663.2]The flowchart describing working is listed as under
Figure 2: Proposed flowchart
5. PERFORMANCE AND RESULTS
Figure 3:Showing neighborhood plot along with 1st order difference
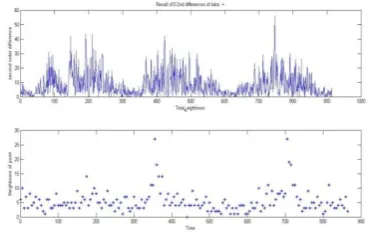
[image:4.595.339.528.137.291.2]After the first order difference more precision is introduced and second order difference is obtained. The result is listed as under
Figure 4:Second order difference along with neighborhood plotting
[image:4.595.56.242.451.569.2]Misclassification is then noted which is a difference between accuracy and actual value. In other words error rate is depicted through this plot.
Figure 5:Showing misclassification or error rate.
Accuracy is plotted after words by subtracting actual values from dataset and obtained values from ARIMA. The plots of accuracy against actual values is listed as under
Figure 6:Plot of values against accuracy
[image:4.595.341.525.570.760.2]True values are obtained values from ARIMA model. The obtained values are plotted against time series values
Figure 7:value against true value
Predicted values are plotted against time series values. The plots are as under
[image:4.595.63.258.653.770.2]Table 1: Showing True values in terms of Proposed and Existing Technique with different precision values
Examination of existing technique without KNN+Euclidean distance is listed as under
Technique Time Value True_value Predicted_Value MAP
ARIMA 5:05 0.2 0.2085 .0085
0.2 0.2135 .0135
0.2 0.2096 .0096
0.2 0.2062 .0062
PROPOSED ARIMA 5.05 5.6987 5.6946 .0040(Optimal
Map Value)
5.6987 5.8835 .1848
5.6987 5.9835 .2848
5.6987 6.0835 .3848
Figure 9:Comparative Analysis of proposed and existing technique
6. CONCLUSION
The traffic prediction is critical as traffic is enhancing due to increase in on road vehicles. The proposed literature uses modified ARIMA model for prediction of traffic accurately. The results are predicted in terms of accuracy and mean square error. The accuracy is enhanced since Euclidean distance is used for determining the closest distance between the points present within the dataset. The dataset is fetched from the online source UCI. The accuracy is obtained by subtracting the actual value from the obtained value. The least error rate and enhanced accuracy proves the worth of the study. The result is compared against the existing literature involving ARIMA without KNN and Euclidean distance.
In future, Genetic algorithm can be merged with the ARIMA for further enhancement of accuracy and reducing error rate.
7. REFERENCES
[1] I. Țăranu, “Data mining in healthcare: decision making
and precision,” Database Syst. J., vol. 5, no. 4, pp. 33–40, 2015.
[2] M. E. Student, C. T. Nadu, and C. T. Nadu, “Heart disease
classification and its co-morbid condition
detection using WPCA genetic algorithm,” pp. 287–291, 2016. [3] “1-s2.0-S2001037016300733-main(1).pdf.” .
[4] C. Anusha, S. K. Vinay, H. J. Pooja Raj, and S. Ranganatha, “Medical data mining and analysis for heart disease dataset using classification techniques,” Natl. Conf. Challenges Res. Technol. Coming Decad. (CRT 2013), pp. 1.09–1.09, 2013.
[5] E. Pinheiro, W. Weber, and L. Barroso, “Failure trends in a large disk drive population,” Proc. 5th USENIX Conf. File Storage Technol. (FAST 2007), no. February, pp. 17– 29, 2007.
[6] A. Sharma and V. Mansotra, “Emerging applications of data mining for healthcare management - A critical review,” 2014 Int. Conf. Comput. Sustain. Glob. Dev., pp. 377–382, 2014.
[7] K. Yan, X. You, X. Ji, G. Yin, and F. Yang, “A Hybrid Outlier Detection Method for Health Care Big Data,”
2016 IEEE Int. Conf. Big Data Cloud Comput. (BDCloud), Soc. Comput. Netw. (SocialCom), Sustain. Comput. Commun., pp. 157–162, 2016.
[8] S. Sivagowry, M. Durairaj, and a. Persia, “An empirical study on applying data mining techniques for the analysis and prediction of heart disease,” 2013 Int. Conf. Inf. Commun. Embed. Syst., pp. 265–270, 2013.
[9] W. E. Leland, W. E. Leland, D. V Wilson, and D. V Wilson, “On the Self-Similar Nature of Ethernet Traf c,”
Comput. Commun. Rev., vol. 2, no. August 1989, pp. 203– 213, 1992.
[10] S. Jain and N. Pise, “Computer aided Melanoma skin cancer detection using Image Processing,” Procedia - Procedia Comput. Sci., vol. 48, no. Iccc, pp. 735–740, 2015.
[11] N. Jothi, N. A. Rashid, and W. Husain, “Data Mining in Healthcare - A Review,” Procedia Comput. Sci., vol. 72, pp. 306–313, 2015.
[12] P. Naraei, V. Street, V. Street, and V. Street, “Application of Multilayer Perceptron Neural Networks and Support Vector Machines in Classification of Healthcare Data,” no. December, pp. 848–852, 2016.
[13] F. Huang, S. Wang, and C. Chan, “Predicting Disease By Using Data Mining Based on Healthcare Information System,” 2012 IEEE Int. Conf. Granul. Comput. Predict., pp. 12–15, 2012.
[14] M. A. Farooq, M. A. M. Azhar, and R. H. Raza, “Automatic Lesion Detection System (ALDS) for Skin Cancer Classification Using SVM and Neural Classifiers,”
2016 IEEE 16th Int. Conf. Bioinforma. Bioeng., pp. 301– 0
308, 2016.
[15] S. Palaniappan and R. Awang, “Intelligent heart disease prediction system using data mining techniques,” 2008 IEEE/ACS Int. Conf. Comput. Syst. Appl., pp. 108–115, 2008.
[16] M. A. Jabbar, B. L. Deekshatulu, and P. Chandra, “Classification of Heart Disease Using K- Nearest Neighbor and Genetic Algorithm,” Procedia Technol., vol. 10, pp. 85–94, 2013.
[17] I. K. A. Enriko, M. Suryanegara, and D. Gunawan, “Heart Disease Prediction System using k-Nearest Neighbor Algorithm with Simplified Patient ’ s Health Parameters,” vol. 8, no. 12, 1843.
[18] B. Veytsman, L. Wang, T. Cui, S. Bruskin, and A.
Baranova, “Distance-based classifiers as potential diagnostic and prediction tools for human diseases,” BMC Genomics, vol. 15 Suppl 1, no. Suppl 12, p. S10, 2014. [19] M. M. El-Hattab, “Applying post classification change
detection technique to monitor an Egyptian coastal zone (Abu Qir Bay),” Egypt. J. Remote Sens. Sp. Sci., vol. 19, no. 1, pp. 23–36, 2016.
[20] C. Chen, M. Won, R. Stoleru, and G. G. X. Member, “Energy-Efficient Fault-Tolerant Data Storage & Processing in Mobile Cloud,” vol. 3, no. 1, pp. 1–14, 2014.
[21] D. Bui, S. Hussain, E. Huh, and S. Lee, “Adaptive Replication Management in HDFS based on Supervised Learning,” vol. 4347, no. c, pp. 1–14, 2016.