Systematic study of high
p
Thadron production in small collision
systems by the PHENIX experiment at RHIC
TakaoSakaguchi1,,for thePHENIX Collaboration
1Brookhaven National Laboratory, Physics Department, Upton, NY 11973-5000, USA.
Abstract.HighpThadrons in the small systems ofd/3He+Au andp+Al/Au collisions have been measured at the midrapidity (|η|<0.35) as well as at the forward and backward rapidities (1.2<|η|<2.4) at √sNN =200 GeV. A clear system and centrality ordering in
theRp/d/HeA was observed for midrapidityπ0 production. HadronRcpas a function of rapidity in forward and backward regions show an opposite trend to what HIJING++ predicted. Together with the difference ofRcp in p+Al/Au collisions, the observation can be understood consistently with the measured long-range two-particle correlations, hinting the possible medium creation similar to A+A collisions.
1 Introduction
The small collision systems such as p/d+A collisions have been considered a good laboratory to
quantify cold nuclear matter effects, a necessary baseline for understanding the effects of the hot
and dense medium produced in A+A collisions. This assumption has been confirmed by
sev-eral measurements such as high transverse momentum (pT) hadrons, jets, and direct photons, in
the minimum bias d+Au collisions at √sNN =200 GeV [1–3]; the nuclear modification factors,
RdA ≡ (1/TdA)(dNdA/dpTdη)/(dσpp/dpTdη), where the TdA is the nuclear thickness function, are
consistent with unity up to high pT, and the slight deviation from the unity is consistent with the
expectation by parton distribution functions such as EPS09 [4]. The observation of the ridge-like structure in the long-range azimuthal correlations in the centralp+Pb collisions at √sNN =5.02 TeV
at the LHC [5–7], however, called into question the view of such systems as consisting merely of cold nuclear matter. The study at the LHC was followed by the PHENIX experiment at RHIC, and a finite
v2of hadrons in 0–5 % centrald+Au collisions using both the two-particle angular correlation method
and the event-plane method were observed [8–10]. These observations led the community to explore any phenomena found in A+A collisions, inp/d+A collisions.
The energy loss of hard scattered partons produced in the initial stage of the collisions, so-called jet quenching, has been one of the key observations in confirming the production of the QGP. The first evidence of this phenomena was found in the yield suppression of high transverse momentum (pT) hadrons, the fragments of the hard scattered partons. The measurement of high pT identified
hadrons have been improved over the last decade, and reached to the level that a precise quantitative comparison of the data and theoretical models became realized [11, 12]. A recent study also found that the energy loss scales with the particle multiplicity (dNch/dη) [13]. Obviously, the highpT hadrons
will be a powerful tool to investigate the parton degree of freedom in the small systems likep/d+A
collisions as well. In addition, a systematic study of the highpT hadron spectra from small to large
collision systems will be able to explore the onset of QGP as a function of the collision systems. In this paper, we show a new systematic measurement of the high pT π0 inp/d/3He+Au collisions at
midrapidity (|η|<0.35) as well as the highpThadrons inp+Al/Au collisions at forward and backward
rapidities (1.2<|η| <2.4), and discuss the hint of possible hot medium creation in connection with the long-range azimuthal correlation observed.
2 Measurement Method
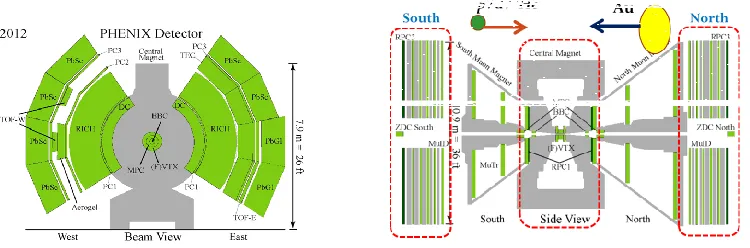
The detector setup was the same as the one in the RHIC Year-2012 run as shown in Fig. 1. The
Figure 1.(Left) Beam view of the PHENIX detector in the RHIC Year-2012 run and later. (Right) Side view of the PHENIX detector with the beam direction ofp/d/3He and Au ions shown. The central and muon arms used
for this analysis are shown in the squared dotted lines. Note that Al ions go to the same directions as Au ions.
detailed description of the PHENIX detector system can be found elsewhere [14]. Theπ0’s were reconstructed viaπ0 → γγ, by primarily using a lead-scintillator sandwich type electromagnetic calorimeter (PbSc EMCal) in the midrapidity (|η| < 0.35). The threshold of cluster energy is set to 0.2 GeV and the photon clusters were selected using a shower shape cut. Then, an energy asymmetry cut ofα=|E1−E2|/(E1+E2)<0.8 was applied on selecting pairs of photons fromπ0decay. The
efficiency and acceptance ofπ0’s were estimated using a GEANT based detector simulation software. The hadrons in the forward and backward rapidity (1.2<|η|<2.4) were measured by a muon tracker (MuTr), a silicon vertex detector (FVTX), and a muon identification detector (MuID). The tracks that left signals in MuTr, FVTX and the first two sensitive layers of MuID are identified as highpT
hadrons.
This analysis used the events recorded by PHENIX in RHIC Year-14 (3He+Au) and Year-15
(p+Al/Au) runs. We used thed+Au results from the literature published before [1]. The integrated
luminosities recorded are 25 nb−1(15 pb−1 pp-equivalent) for3He+Au collisions, 275 nb−1 (7.4 pb−1
pp-equivalent) for p+Al collisions, and 80 nb−1 (16 pb−1pp-equivalent) for p+Au collisions. Three
will be a powerful tool to investigate the parton degree of freedom in the small systems likep/d+A
collisions as well. In addition, a systematic study of the highpT hadron spectra from small to large
collision systems will be able to explore the onset of QGP as a function of the collision systems. In this paper, we show a new systematic measurement of the high pT π0 inp/d/3He+Au collisions at
midrapidity (|η|<0.35) as well as the highpThadrons inp+Al/Au collisions at forward and backward
rapidities (1.2<|η|<2.4), and discuss the hint of possible hot medium creation in connection with the long-range azimuthal correlation observed.
2 Measurement Method
The detector setup was the same as the one in the RHIC Year-2012 run as shown in Fig. 1. The
Figure 1.(Left) Beam view of the PHENIX detector in the RHIC Year-2012 run and later. (Right) Side view of the PHENIX detector with the beam direction ofp/d/3He and Au ions shown. The central and muon arms used
for this analysis are shown in the squared dotted lines. Note that Al ions go to the same directions as Au ions.
detailed description of the PHENIX detector system can be found elsewhere [14]. Theπ0’s were reconstructed viaπ0 → γγ, by primarily using a lead-scintillator sandwich type electromagnetic calorimeter (PbSc EMCal) in the midrapidity (|η|< 0.35). The threshold of cluster energy is set to 0.2 GeV and the photon clusters were selected using a shower shape cut. Then, an energy asymmetry cut ofα=|E1−E2|/(E1+E2)<0.8 was applied on selecting pairs of photons fromπ0decay. The
efficiency and acceptance ofπ0’s were estimated using a GEANT based detector simulation software. The hadrons in the forward and backward rapidity (1.2<|η|<2.4) were measured by a muon tracker (MuTr), a silicon vertex detector (FVTX), and a muon identification detector (MuID). The tracks that left signals in MuTr, FVTX and the first two sensitive layers of MuID are identified as highpT
hadrons.
This analysis used the events recorded by PHENIX in RHIC Year-14 (3He+Au) and Year-15
(p+Al/Au) runs. We used thed+Au results from the literature published before [1]. The integrated
luminosities recorded are 25 nb−1(15 pb−1 pp-equivalent) for3He+Au collisions, 275 nb−1 (7.4 pb−1
pp-equivalent) for p+Al collisions, and 80 nb−1 (16 pb−1pp-equivalent) for p+Au collisions. Three
types of events were used in this analysis; the first type of events were triggered by the coincidence of signals from the two Beam-Beam counters (BBC) located at 3.1 < |η| < 3.9 covering the full azimuth (minimum bias triggered events), the second type of events were triggered by a high energy tower hit in the EMCal coincided with a minimum bias trigger (ERT triggered events), and the third type of events were triggered by a high momentum track identified by a MuTr and MuID coincided
with a minimum bias trigger (Muon-arm triggered events). The minimum bias trigger is not 100 % efficient to the inelastic collisions because of the limited acceptance and efficiency of the BBC. This
inefficiency increases as the collision system becomes smaller. They were already studied ind+Au
collisions by comparing the charge of the south BBC with a Glauber Monte Carlo simulation folded with a negative binomial distribution [15]. From this comparison, we determined that the trigger efficiency is 88 % for d+Au collisions. We followed the same method, and determined the trigger
ef-ficiency ofp+Al,p+Au and3He+Au collisions also as 74 %, 84 % and 88 %, respectively. In case of
200 GeV Au+Au collisions, the efficiency was 94 % [12]. When dividing the events into centralities,
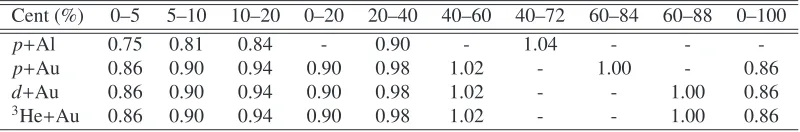
an additional bias factor plays a role. The bias is originated from a correlation of particle yield in the rapidity range for the spectra measurements, and that in the rapidity range for the centrality measure-ment which is performed by the south BBC (-3.9<|η|<-3.1). We estimated the bias factors for the
3He+Au andp+Al/Au collisions by following the method applied ford+Au collisions [15], and
deter-mined as listed in Table 1. All the results (including minimum bias and centrality-dependent) shown
Table 1.Bias factors for centrality selections in small collision systems.
Cent (%) 0–5 5–10 10–20 0–20 20–40 40–60 40–72 60–84 60–88 0–100
p+Al 0.75 0.81 0.84 - 0.90 - 1.04 - -
-p+Au 0.86 0.90 0.94 0.90 0.98 1.02 - 1.00 - 0.86
d+Au 0.86 0.90 0.94 0.90 0.98 1.02 - - 1.00 0.86
3He+Au 0.86 0.90 0.94 0.90 0.98 1.02 - - 1.00 0.86
in this paper are divided by these numbers after being corrected for acceptances and efficiencies. The
numbers for 0–100 % will be used to obtain 0–100 % centrality result from the minimum bias data of the given collision system. For instance, in order to obtain 0–100 % result ford+Au collisions, the
spectra for minimum bias events (0–88 % in this case) will be divided by 0.86.
3 Results
3.1 Mid-rapidity measurement
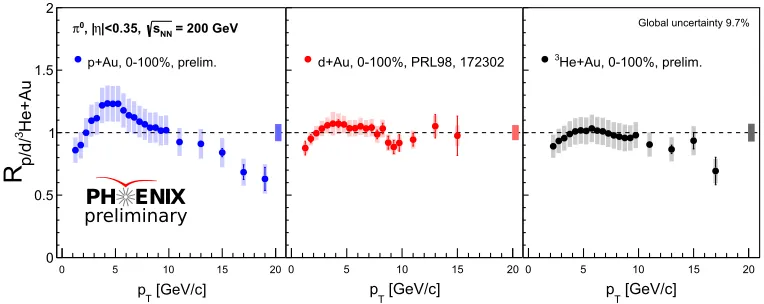
Figure 2 showsRp/d/HeA of theπ0’s for the minimum bias p+Au,d+Au, and3He+Au collisions at
√s
NN =200 GeV.Rp/d/HeA is defined asRp/d/HeA ≡ (1/Tp/d/HeA)(dNp
/d/HeA/dpTdη)/(dσpp/dp
Tdη),
where theTp/d/HeAis the nuclear thickness function. This measurement was performed at the
midra-pidity (|η| <0.35). The magnitudes of the peaks seen at pT ∼ 5 GeV/c, which are often called as
Cronin-peak and understood as the consequence of the initial momentum broadening in the nucleus, are found to change as a function of the collision systems. As the projectile becomes lighter, the magnitude of the peak becomes larger. There is a common feature over the systems that some hint of suppression is seen at highpT(pT >10 GeV/c). The systematic uncertainties on data points are
shown in boxes on them, the ones forTp/d/HeAare shown as the boxes around unity at the right end
of each plot, and the global uncertainty of 9.7 % which comes fromp+pluminosity normalization is
not shown but is mentioned by texts. Note that both the number of participant nucleons (Npart) and the
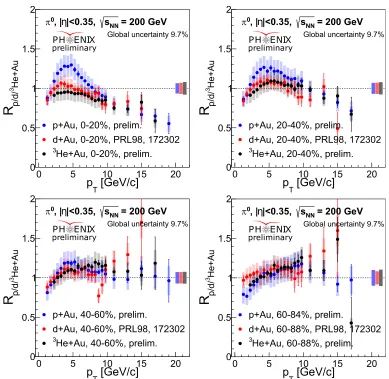
number of binary nucleon-nucleon collisions (Ncoll) are different for each system. Figure 3 shows the
centrality dependence of theπ0Rp/d/HeAforp+Au,d+Au, and3He+Au collisions at √sNN=200 GeV.
The similar feature for Cronin-peaks atpT∼5 GeV/cis seen for all the systems and centralities. The
slight suppression at higher pT (pT >10 GeV/c) tends to disappear and turns to an enhancement as
[GeV/c] T
p
0 5 10 15 20
He+Au
3
p/d/
R
0 0.5 1 1.5
2
[GeV/c]
T
p
0 5 10 15 20
He+Au
3
p/d/
R
0 0.5 1 1.5 2
= 200 GeV NN s |<0.35,
η
, | 0
π
p+Au, 0-100%, prelim.
[GeV/c]
T
p
0 5 10 15 20
He+Au
3
p/d/
R
0 0.5 1 1.5 2
d+Au, 0-100%, PRL98, 172302
[GeV/c]
T
p
0 5 10 15 20
He+Au
3
p/d/
R
0 0.5 1 1.5 2
He+Au, 0-100%, prelim.
3
Global uncertainty 9.7%
PH ENIX
preliminary
Figure 2.Rp/d/HeAof theπ0for minimum biasp+Au,d+Au, and3He+Au collisions at √sNN=200 GeV (from
left to right). Note that theNpartandNcollare different for each system.
projectile order, except for the most peripheral bin. At highpTtheRp/d/HeAof three collision systems
tend to agree each other within the quoted uncertainties for all the centralities. Note that the same centrality doesn’t mean theNpartandNcollare same. In order to see the development of the
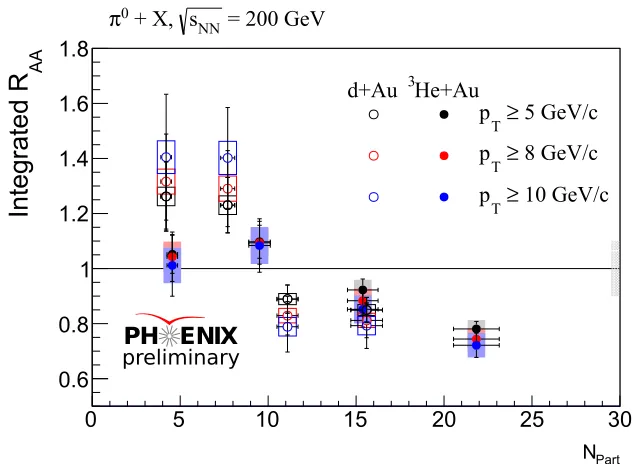
suppres-sion/enhancement atpT ∼5, 8 and 10 GeV/c, we have plotted theRAAas a function ofNpartand shown
in Figure 4 (onlyd+Au and3He+Au collisions are shown here). For the lowerNpart (Npart <∼10), theRd/HeAare different between two systems, while for highNpart, they tend to merge. The result can
be compared with theRAA’s from the peripheral Au+Au collisions, i.e., 60–70, 70–80, and 80–93 %
centrality. In the previous publication, we measured theRAAfor pT >5 GeV/cas∼0.78,∼0.87, and ∼0.84, forNpartof 26.7±3.7, 13.7±2.5, and 5.6±0.8, respectively [12]. With these numbers, we found
that theRAA’s from the three collisions systems converge forNpart >∼12, while a system ordering of
RdAu>RHeAu>RAuAuis observed forNpart <∼12. We haven’t calculated the IntegratedRpAfor p+Au
collisions, but if we take the numbers at pT =5 GeV/c, the points are found to locate aboved+Au
points atNpart<∼10.
We have made a comparison of the data with some models. A model including cold energy loss only (e.g. [16]) was found not to reproduce the system ordering of the Cronin-peak magnitude. The HIJING++model [17] was found to give a reasonable description of the system ordering of the
Cronin-peak as shown in Figure 5. It is, however, important to note that the peak positions are different
from what were observed in the data; the data have the peaks atpT ∼5 GeV/c, while the model has
the peaks atpT∼1.5 GeV/c.
3.2 For(back)ward rapidity measurement
The HIJING++model also gave a prediction of the rapidity dependence of the magnitude of the
Cronin-peak inp+Au collisions as shown in Fig 6. The prediction says that theRpAincreases as going
to p-going direction (positive rapidity), while decreases as going to Au-going direction (negative rapidity). This is mainly owing to the shadowing and anti-shadowing effect in the parton distribution
function inp- and Au-going direction, respectively.
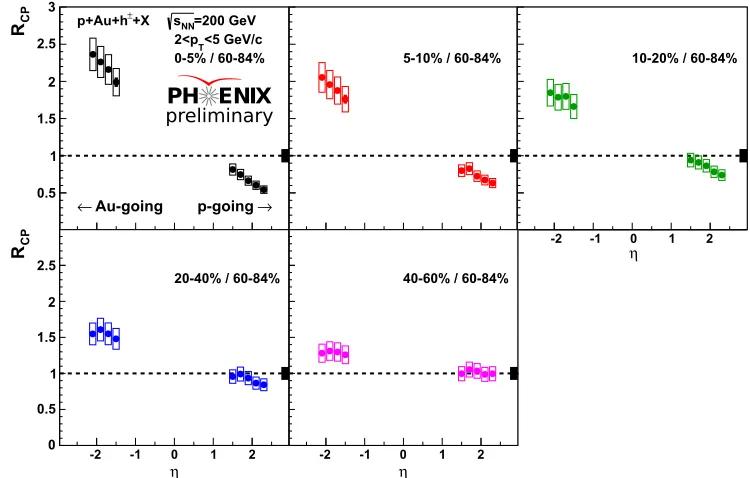
Figure 7 shows the centrality dependence of theRcpof hadrons for 2<pT <5 GeV/cas a function
[GeV/c] T
p
0 5 10 15 20
He+Au 3 p/d/
R
0 0.5 1 1.5 2 [GeV/c] T p0 5 10 15 20
He+Au 3 p/d/ R 0 0.5 1 1.5 2
= 200 GeV NN s |<0.35, η , | 0 π
p+Au, 0-100%, prelim.
[GeV/c]
T
p
0 5 10 15 20
He+Au 3 p/d/ R 0 0.5 1 1.5 2
d+Au, 0-100%, PRL98, 172302
[GeV/c]
T
p
0 5 10 15 20
He+Au 3 p/d/ R 0 0.5 1 1.5 2
He+Au, 0-100%, prelim.
3
Global uncertainty 9.7%
PH ENIX
preliminary
Figure 2.Rp/d/HeAof theπ0for minimum biasp+Au,d+Au, and3He+Au collisions at √sNN =200 GeV (from
left to right). Note that theNpartandNcollare different for each system.
projectile order, except for the most peripheral bin. At highpTtheRp/d/HeAof three collision systems
tend to agree each other within the quoted uncertainties for all the centralities. Note that the same centrality doesn’t mean theNpartandNcollare same. In order to see the development of the
suppres-sion/enhancement atpT∼5, 8 and 10 GeV/c, we have plotted theRAAas a function ofNpartand shown
in Figure 4 (onlyd+Au and3He+Au collisions are shown here). For the lower Npart (Npart <∼10), theRd/HeAare different between two systems, while for highNpart, they tend to merge. The result can
be compared with theRAA’s from the peripheral Au+Au collisions, i.e., 60–70, 70–80, and 80–93 %
centrality. In the previous publication, we measured theRAAfor pT>5 GeV/cas∼0.78,∼0.87, and ∼0.84, forNpartof 26.7±3.7, 13.7±2.5, and 5.6±0.8, respectively [12]. With these numbers, we found
that theRAA’s from the three collisions systems converge forNpart >∼12, while a system ordering of
RdAu>RHeAu>RAuAuis observed forNpart <∼12. We haven’t calculated the IntegratedRpAfor p+Au
collisions, but if we take the numbers at pT =5 GeV/c, the points are found to locate aboved+Au
points atNpart<∼10.
We have made a comparison of the data with some models. A model including cold energy loss only (e.g. [16]) was found not to reproduce the system ordering of the Cronin-peak magnitude. The HIJING++model [17] was found to give a reasonable description of the system ordering of the
Cronin-peak as shown in Figure 5. It is, however, important to note that the peak positions are different
from what were observed in the data; the data have the peaks atpT ∼5 GeV/c, while the model has
the peaks atpT∼1.5 GeV/c.
3.2 For(back)ward rapidity measurement
The HIJING++model also gave a prediction of the rapidity dependence of the magnitude of the
Cronin-peak inp+Au collisions as shown in Fig 6. The prediction says that theRpAincreases as going
to p-going direction (positive rapidity), while decreases as going to Au-going direction (negative rapidity). This is mainly owing to the shadowing and anti-shadowing effect in the parton distribution
function inp- and Au-going direction, respectively.
Figure 7 shows the centrality dependence of theRcpof hadrons for 2<pT<5 GeV/cas a function
of rapidity inp+Au collisions at √sNN =200 GeV. The measurement was performed using the MuTr,
[GeV/c]
T
p
0 5 10 15 20
H e+Au 3 p/ d/
R
0 0.5 1 1.5 2p+Au, 0-20%, prelim.
d+Au, 0-20%, PRL98, 172302 He+Au, 0-20%, prelim.
3
= 200 GeV NN s |<0.35, η , | 0 �
Global uncertainty 9.7%
PH ENIX preliminary
[GeV/c]
T
p
0 5 10 15 20
H e+Au 3 p/ d/
R
0 0.5 1 1.5 2p+Au, 20-40%, prelim.
d+Au, 20-40%, PRL98, 172302 He+Au, 20-40%, prelim.
3
= 200 GeV NN s |<0.35, η , | 0 �
Global uncertainty 9.7%
PH ENIX preliminary
[GeV/c]
T
p
0 5 10 15 20
H e+Au 3 p/ d/
R
0 0.5 1 1.5 2p+Au, 40-60%, prelim.
d+Au, 40-60%, PRL98, 172302 He+Au, 40-60%, prelim.
3
= 200 GeV NN s |<0.35, η , | 0 �
Global uncertainty 9.7%
PH ENIX preliminary
[GeV/c]
T
p
0 5 10 15 20
H e+Au 3 p/ d/
R
0 0.5 1 1.5 2p+Au, 60-84%, prelim.
d+Au, 60-88%, PRL98, 172302 He+Au, 60-88%, prelim.
3
= 200 GeV NN s |<0.35, η , | 0 �
Global uncertainty 9.7%
PH ENIX preliminary
Figure 3.Centrality dependence of theπ0Rp/d/HeAforp+Au,d+Au, and3He+Au collisions at √sNN=200 GeV.
FVTX and MuID as described in the analysis section. We don’t show the measurement of midrapidity π0 in the plots, but we confirmed that theπ0RpApoints are located right on the linear interpolation
of the for(back)ward measurements. It is seen that the rapidity dependence of theRcp is apparently
opposite to what was predicted by HINJING++. This calls additional/another physics mechanism to
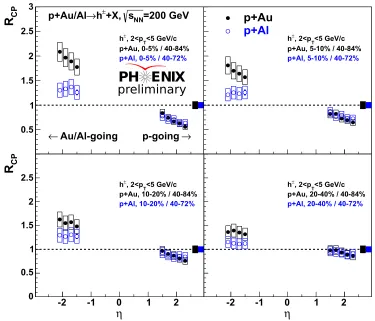
be played. Another observation is that the both enhancement and suppression as a function rapidity is highly centrality dependent, which is not expected from a parton distribution function. We have also measured the highpT hadrons in for(back)ward rapidity in p+Al collisions in RHIC Year-2015
as shown in Figure 8. The result is compared with those in p+Au collisions. There are interesting
features seen in the result. First, although the absolute magnitude are different, Rcp changes as a
function of centrality both inp+Au andp+Al collisions and both in forward (p-going) and backward
(Au/Al-going) rapidities; in more central collisions,Rcpis more suppressed in forward rapidity, and
Part N
0
5
10
15
20
25
30
AA
Integrated R
0.6
0.8
1
1.2
1.4
1.6
1.8
5 GeV/c
≥
T
p
8 GeV/c
≥
T
p
10 GeV/c
≥
T
p
= 200 GeV
NN
s
+ X,
0π
d+Au He+Au
3PH ENIX
preliminary
Figure 4.IntegratedRAAas a function ofNpartford+Au and3He+Au collisions at √sNN=200 GeV.
[GeV/c]
T
p
0 5 10 15 20
He+Au
3
p/d/
R
0 0.5 1 1.5 2
p+Au, 0-100%, prelim. d+Au, 0-100%, PRL98, 172302
He+Au, 0-100%, prelim.
3
= 200 GeV NN
s |<0.35, η , | 0 π
Global uncertainty 9.7% PH ENIX
preliminary
Figure 5.(Left)Rp/d/HeAfor minimum biasp/d/3He+Au collisions at√sNN=200 GeV. (Right) Calculation of
Part N
0
5
10
15
20
25
30
AA
Integrated R
0.6
0.8
1
1.2
1.4
1.6
1.8
5 GeV/c
≥
Tp
8 GeV/c
≥
Tp
10 GeV/c
≥
Tp
= 200 GeV
NN
s
+ X,
0π
d+Au He+Au
3PH ENIX
preliminary
Figure 4.IntegratedRAAas a function ofNpartford+Au and3He+Au collisions at √sNN=200 GeV.
[GeV/c]
T
p
0 5 10 15 20
He+Au 3 p/d/
R
0 0.5 1 1.5 2p+Au, 0-100%, prelim. d+Au, 0-100%, PRL98, 172302
He+Au, 0-100%, prelim.
3
= 200 GeV NN s |<0.35, η , | 0 π
Global uncertainty 9.7% PH ENIX
preliminary
Figure 5.(Left)Rp/d/HeAfor minimum biasp/d/3He+Au collisions at √sNN =200 GeV. (Right) Calculation of
theRp/d/HeAby HIJING++model.
● ● ●●● ● ● ● ● ● ● ● ● ●●●●●● ● ● ● ● ● ● ●● ● ●● ●●●● ●●●●●●●●●● ●● ● ●●●● ● ●
0 1 2 3 4 5
0.6 0.8 1.0 1.2 1.4 1.6
PRELIMINAR
Y
● ● ●●● ● ● ● ● ● ● ● ● ●●●●●● ● ● ● ● ● ● ●● ● ●● ●●●● ●●●●●●●●●● ●● ● ●●●● ● ●0 1 2 3 4 5
0.6 0.8 1.0 1.2 1.4 1.6 pT RpA ● [2.2,1.2]
[−0.5,0.5]
[−1.2,−2.2]
p+Au@200 GeV→ π± min. bias
G.Papp et al, HIJING++
Figure 6. (Left) HIJING++prediction ofRpAfor pions for different rapidity regions in minimum biasp+Au collisions at√sNN=200 GeV. (Right) Schematic drawing of the overall trend of theRpA.
CP R 0.5 1 1.5 2 2.5 3 CP R 0 0.5 1 1.5 2 2.5 η
-2 -1 0 1 2
-2 -1 0 1 2
CP R 0.5 1 1.5 2 2.5 3 =200 GeV NN s +X ± p+Au+h
0-5% / 60-84%T<5 GeV/c
2<p
→ p-going Au-going
←
-2 -1 0 1 2
CP R 0.5 1 1.5 2 2.5 3
5-10% / 60-84%
-2 -1 0 1 2
CP R 0.5 1 1.5 2 2.5 3
10-20% / 60-84%
η
-2 -1 0 1 2
CP R 0 0.5 1 1.5 2 2.5
20-40% / 60-84%
η
-2 -1 0 1 2
0 0.5 1 1.5 2 2.5
40-60% / 60-84%
PH ENIX
preliminary
Figure 7. Hadron Rcp in p+Au collisions at for(back)ward rapidities as a function of centrality at √sNN
CP
R
0.5 1 1.5 2 2.5 3
CP
R
0 0.5 1 1.5 2 2.5
-2 -1 0 1 2
CP
R
0.5 1 1.5 2 2.5 3
=200 GeV
NN
s +X,
±
h
→
p+Au/Al
p+Au, 0-5% / 40-84%
p+Al, 0-5% / 40-72%
<5 GeV/c T , 2<p
±
h
→
p-going Au/Al-going
←
-2 -1 0 1 2
CP
R
0.5 1 1.5 2 2.5 3
p+Au, 5-10% / 40-84%
p+Al, 5-10% / 40-72%
<5 GeV/c T , 2<p
±
h
p+Au
p+Al
η
-2 -1 0 1 2
CP
R
0.5 1 1.5 2 2.5 3
p+Au, 10-20% / 40-84%
p+Al, 10-20% / 40-72%
<5 GeV/c T , 2<p
±
h
η
-2 -1 0 1 2
CP
R
0.5 1 1.5 2 2.5 3
p+Au, 20-40% / 40-84%
p+Al, 20-40% / 40-72%
<5 GeV/c T , 2<p
±
h
PH ENIX
preliminary
Figure 8. HadronRcpin p+Al collisions at for(back)ward rapidities as a function of centrality compared with those inp+Au collisions at √sNN=200 GeV. ThepTrange is 2<pT<5 GeV/c.
inp+Al/Au collisions. On the contrary, the degree of enhancement at the backward rapidity are very
different as going to more central collisions.
3.3 Possible hot medium creation?
We have measured a flow-like signal ind+Au collisions through two-particle azimuthal angle
cor-relation functions with a wide rapidity gap (|∆η| ∼ 3) as mentioned in the introduction section. We observed a quadrupole component on top of a large dipole component when fitting the correlation functions with Fourier series. We recently measured a similar flow-like signal inp+Au collisions as
well [18]. It is interesting to understand the different level of enhancement inRcpat backward rapidity
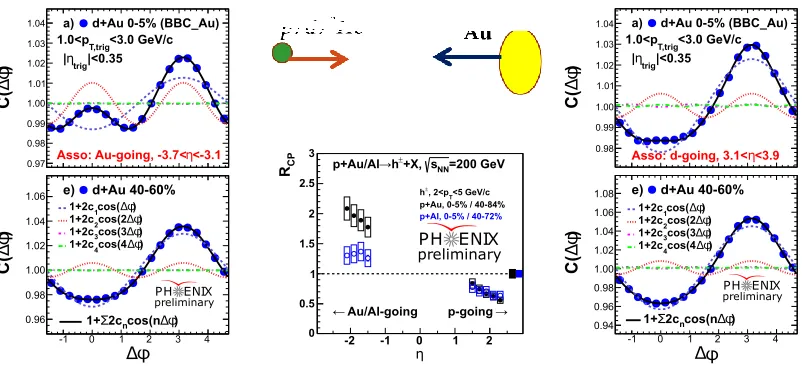
inp+Al/Au collisions in connection with the flow result. Figure 9 shows the two-particle correlation
functions measured by PHENIX together with the hadronRcp’s for 0–5 % centrality inp+Al/Au
colli-sions. The two-particle correlation functions shown at the left panel are constructed by hadrons mea-sured at CNT (|η|<0.35) associated with the energy in a tower in the south MPC (MPCS, -3.7< η <
CP
R
0.5 1 1.5 2 2.5 3 CPR
0 0.5 1 1.5 2 2.5-2 -1 0 1 2
CP R 0.5 1 1.5 2 2.5 3 =200 GeV NN s +X, ± h → p+Au/Al
p+Au, 0-5% / 40-84%
p+Al, 0-5% / 40-72%
<5 GeV/c T , 2<p ± h → p-going Au/Al-going ←
-2 -1 0 1 2
CP R 0.5 1 1.5 2 2.5 3
p+Au, 5-10% / 40-84%
p+Al, 5-10% / 40-72%
<5 GeV/c T , 2<p ± h
p+Au
p+Al
η
-2 -1 0 1 2
CP R 0.5 1 1.5 2 2.5 3
p+Au, 10-20% / 40-84%
p+Al, 10-20% / 40-72%
<5 GeV/c T , 2<p ± h
η
-2 -1 0 1 2
CP R 0.5 1 1.5 2 2.5 3
p+Au, 20-40% / 40-84%
p+Al, 20-40% / 40-72%
<5 GeV/c T , 2<p ± h
PH ENIX
preliminary
Figure 8. HadronRcpin p+Al collisions at for(back)ward rapidities as a function of centrality compared with those inp+Au collisions at √sNN=200 GeV. ThepTrange is 2<pT<5 GeV/c.
inp+Al/Au collisions. On the contrary, the degree of enhancement at the backward rapidity are very
different as going to more central collisions.
3.3 Possible hot medium creation?
We have measured a flow-like signal ind+Au collisions through two-particle azimuthal angle
cor-relation functions with a wide rapidity gap (|∆η| ∼ 3) as mentioned in the introduction section. We observed a quadrupole component on top of a large dipole component when fitting the correlation functions with Fourier series. We recently measured a similar flow-like signal inp+Au collisions as
well [18]. It is interesting to understand the different level of enhancement inRcpat backward rapidity
inp+Al/Au collisions in connection with the flow result. Figure 9 shows the two-particle correlation
functions measured by PHENIX together with the hadronRcp’s for 0–5 % centrality inp+Al/Au
colli-sions. The two-particle correlation functions shown at the left panel are constructed by hadrons mea-sured at CNT (|η|<0.35) associated with the energy in a tower in the south MPC (MPCS, -3.7< η < -3.1), which is located in Au-going side. The functions shown at the right panel are constructed by
CP R 0.5 1 1.5 2 2.5 3 0 =200 GeV NN s +X, � h → p+Au/Al
p+Au, 0-5% / 40-84%
p+Al, 0-5% / 40-72%
<5 GeV/c T , 2<p � h → p-going Au/Al-going ← η
-2 -1 0 1 2
PH ENIX preliminary 0.97 0.98 0.99 1.00 1.01 1.02 1.03
1.04 a) d+Au 0-5% (BBC_Au)
<3.0 GeV/c T,trig 1.0<p |<0.35 trig η | <-3.1 η
Asso: Au-going, -3.7<
)
φ∆
C(
-1 0 1 2 3 4 0.96
0.98 1.00 1.02 1.04
1.06 e) d+Au 40-60%
φ ∆ ) φ∆ C( PH ENIX preliminary ) φ ∆ cos( 1 1+2c ) φ ∆ cos(2 2 1+2c ) φ ∆ cos(3 3 1+2c ) φ ∆ cos(4 4 1+2c ) φ ∆ cos(n n 2c Σ 1+ 0.98 0.99 1.00 1.01 1.02 1.03
1.04 a) d+Au 0-5% (BBC_Au)
<3.0 GeV/c T,trig 1.0<p |<0.35 trig η | <3.9 η
Asso: d-going, 3.1<
-1 0 1 2 3 4 0.94 0.96 0.98 1.00 1.02 1.04 1.06
1.08 e) d+Au 40-60%
φ ∆ ) φ∆ C( ) φ∆ C( PH ENIX preliminary ) φ ∆ cos( 1 1+2c ) φ ∆ cos(2 2 1+2c ) φ ∆ cos(3 3 1+2c ) φ ∆ cos(4 4 1+2c ) φ ∆ cos(n n 2c Σ 1+
Figure 9.(Left and Right) Two-particle correlation functions measured ind+Au collisions at √sNN =200 GeV
by PHENIX. The triggerpTis 1.0<pT<3.0 GeV/cand the centralities are 0–5 % and 40–60 %. (Middle) theRcp measurement for 0–5 % centrality inp+Al/Au collisions at √sNN=200 GeV. Note that Al ions go to the same
directions as Au ions.
hadrons measured at CNT (|η|<0.35) associated with the energy in a tower in the north MPC (MPCN, 3.1< η <3.9), which is located in p/d-going side. The trigger pT is 1.0< pT <3.0 GeV/cand the
centralities are 0–5 % and 40–60 %. On top of the dipole component in both cases, the quadrupole component is much prominent for Au-going side for 0–5 % centrality. For the 40–60 % centrality, both
d-going and Au-going correlation functions look similar. The asymmetric feature of the ridge/flow
can be understood in the context of the asymmetric pseudo-rapidity distribution of produced particles in the asymmetric collision systems [19]. In the middle panel, shown is theRcp of the hadrons in
forward and backward rapidities. The rapidity dependent increase of theRcp is consistent with that
of the ridge-like structure in the two-particle correlation functions. The possible scenario is that the enhancement of theRcpis partly due to the the increase of the particle production by a possible hot
medium created in the collisions. Both the centrality dependent and system size dependent increase of theRcpin the backward rapidity may be understood as follows; (1) the possible hot medium creation
is more prominent for more central collisions and (2) for larger collision systems, and (3) the medium is shifted towards Au-going direction for more central collisions.
4 Summary
HighpT hadrons in the small systems ofd/3He+Au andp+Al/Au collisions have been measured at
the midrapidity (|η| < 0.35) as well as at the forward and backward rapidities (1.2 < |η| < 2.4) at
√s
NN =200 GeV. A clear system and centrality ordering in theRp/d/HeAwas observed for midrapidity
π0production. Rapidity dependence of the HadronRcpinp+Au collisions show an opposite trend to
what HIJING++predicted. TheRcpinp+Au collisions was found higher than that ofp+Al collisions
at the backward rapidity, while theRcpat forward rapidity shows the similar behavior. This result was
compared with the two-particle long-range correlations measured ind+Au collisions that are similar
top+Au collisions, and found to be explained consistently with a possible hot medium creation similar
References
[1] S.S. Adler et al. (PHENIX), Phys. Rev. Lett.98, 172302 (2007),nucl-ex/0610036 [2] A. Adare et al. (PHENIX), Phys. Rev.C87, 054907 (2013),1208.1234
[3] A. Adare et al. (PHENIX), Phys. Rev. Lett.116, 122301 (2016),1509.04657 [4] K.J. Eskola, H. Paukkunen, C.A. Salgado, JHEP04, 065 (2009),0902.4154 [5] S. Chatrchyan et al. (CMS), Phys. Lett.B718, 795 (2013),1210.5482 [6] B. Abelev et al. (ALICE), Phys. Lett.B719, 29 (2013),1212.2001 [7] G. Aad et al. (ATLAS), Phys. Rev. Lett.110, 182302 (2013),1212.5198 [8] A. Adare et al. (PHENIX), Phys. Rev. Lett.111, 212301 (2013),1303.1794 [9] A. Adare et al. (PHENIX), Phys. Rev. Lett.114, 192301 (2015),1404.7461 [10] L. Adamczyk et al. (STAR), Phys. Lett.B747, 265 (2015),1502.07652 [11] A. Adare et al. (PHENIX), Phys. Rev.C77, 064907 (2008),0801.1665 [12] A. Adare et al. (PHENIX), Phys. Rev.C87, 034911 (2013),1208.2254 [13] A. Adare et al. (PHENIX), Phys. Rev.C93, 024911 (2016),1509.06735 [14] K. Adcox et al. (PHENIX), Nucl. Instrum. Meth.A499, 469 (2003) [15] A. Adare et al. (PHENIX), Phys. Rev.C90, 034902 (2014),1310.4793
[16] Y.T. Chien, A. Emerman, Z.B. Kang, G. Ovanesyan, I. Vitev, Phys. Rev.D93, 074030 (2016), 1509.02936
[17] G.G. Barnaföldi, G. Bíró, M. Gyulassy, S.M. Haranozó, P. Lévai, G. Ma, G. Papp, X.N. Wang, B.W. Zhang (2017),1701.08496
[18] C. Aidala et al., Phys. Rev.C95, 034910 (2017),1609.02894