Available Online atwww.ijcsmc.com
International Journal of Computer Science and Mobile Computing
A Monthly Journal of Computer Science and Information Technology
ISSN 2320–088X
IJCSMC, Vol. 4, Issue. 11, November 2015, pg.301 – 306
RESEARCH ARTICLE
The Hydro-Ecological Process in
Spatial Database Management System
Manolekshmi.I
Assistant Professor in Computer Science and Engineering,Baselios Mathews II College of Engineering, Kerala, India
Abstract: In spatial database, geographic information system (GIS) technology and system engineering theory, the hydro-ecological spatial database was built, and the corresponding hydro-ecological spatial database management information system was designed and developed. From aspects of the data organization and classification, the overall structure of the database, database construction processes and data integration methods, the design and key technologies of hydro-ecological spatial database were elaborated and discussed. And combining with this database, the hydrological database management system based on Arc GIS Engine was developed. The functions of management, storage, query, analysis were realized in the system. The system provided a integrated data processing platform for the security evaluation and prediction of hydro-ecological system in arid areas, effectively improved efficiency of the mass data storage, management, processing and spatial analysis capabilities, as well as increased the work efficiency.
Keywords – Geographic information system, Spatial DataBase, ArcGIS Engine
I. INTRODUCTION
II. MODELING OF TECHNOLOGY
The ecological characteristics of the wetland and its process of succession. The wetland junction location of atmosphere, hydrosphere and biosphere makes its biophysical habitat difficult to be quantized due to the composition of the multiple environmental elements and the complicated relationships between biophysical factors). Based on a rational hypothesis supported by wetland. we conceptualized a complicated wetland ecosystem into a wetland hydro-ecological model by linking the structure and pattern aspects of a wetland ecosystem with both wetland hydrological regime and its pattern mainly controlled by its hydro-geomorphic characteristics
Multi-temporal remote sensed images can be employed to generate digital vegetation information at the plant com- munity scale and we can couple the vegetation information with the hydrological zonation produced by GIS hydrological analysis methods from a DEM of the study area. Surveyed vegetation data can be used to calibrate the digital vegetation information generated by the RS methods, in addition observation of hydrological data can be used to calibrate the digital hydrological zonation information generated by the GIS method. We can quantitatively analyse the vegetation ecological characteristics and its correlations to the hydrological regime in wetlands from different aspects In the study we quantified the coupled characteristics between hydrological geomorphology and plant ecological pattern, the coupled characteristics between hydrological regime and plant ecological pattern, and numeric spatial distribution of various wetland communities.
It is evident that landform is the dominant factor control- ling the pattern of a stream network, though it is not the only single factor. Hence GIS techniques are usually employed to analyse and assess topography-dependent hydro-geomorphic information and other hydrological information closely cor- related with landforms (Forman, 1995). The development of a DEM is also a useful substitute for the traditional field work which requires for a tough work on such information collection, and it allows an easier availability of digital logical information for hydro-ecologicalresearch work. Most hydrological software such as Rivertools, TOPAZ (TOpographic PArameteriZation) and ArcGIS have had their specific hydro- logical analysis modules, with which some key hydrological indicators such as stream network, watershed line and sub- catchment delineation can be digitally generated from a DEM (Turcotte et al., 2001). With the aid of field monitoring, more hydrological indicators of the hydro-geomorphology or the
Fig. 2 – Work flow for the coupled hydro-ecological analysis of wetlands supported by GIS&RS.
III. STUDY
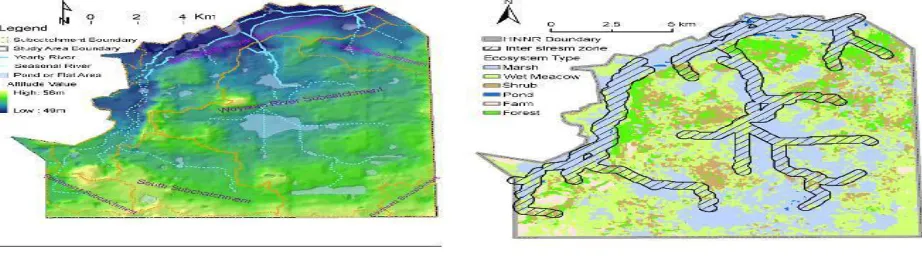
sub-module within ArcGIS8.3. The depression delineation was produced by running our written codes of the breaching and the flat area algorithm. The digital Nongjiang River, Woy- alan River, 82 ponds and flat areas as well as 6 sub-catchments were informed by using above digital process methods (Fig. 1), and all digital information were then validated with both GPS waypoints and the relief map. The DEM data was also used to delineate the hydrological zones by two different methods. The hydrological regime based method defined the yearly saturated zone, where the water table reaches an average depth deduced from records of gauge readings, and the connected area above an average height was defined as the yearly unsaturated zone. The area between yearly saturated zone and yearly unsaturated zone was then assigned to the seasonal saturated zone. The hydro-geomorphology based method was used to simply delineate the study area into two hydrological zones. The inter-stream zone was delineated by generating 300 m buffer zone along the two rivers; the area beyond the inter- stream was defined as the outer-stream zone.
Fig. 1 – Map of surface hydrological system in HNNR.
The GIS spatial analysis module in the ArcGIS 8.3 was used for producing spatial variables. Three continuous variables included the sample site above sea level as for a relief character, the sample straight distance to the stream outlet of the Woyalan River, and the sample wetness index produced by AVTOPMODEL (Huang and Jiang, 2002). The ordinal variables included the 11 grades for the samples based on their minimum straight distance to the Woyalan rivercourse, and three types of the samples belonging to the specific hydrologic regime zones.
IV. RESULT
The hydro-ecological analysis by coupling the 13 wetland community compositions with the two hydro-geomorphic zones Within the inter-stream zone, the patch area and numbers of different wetland communities are very different. Due to the different ecological withstanding to the wetland biophysical habitats. The patch area and numbers of the wet- land communities increased from the forestry communities, the bush communities, the meadow communities through to the marshes in a good moisture gradient. This indicates a good agreement of the marsh wetland communities in the wetter biophysical habitat. Within the outer-stream zone, the predominant patch number and its area moves to the transitional meadow communities.
Calamagrostis angustifolia-Carex spp. community constitutes over one third HNNR, however, the marshes still remained in a low ratio for both patch number and area due to some existence of depression and flat areas within this zone.
Carex lasiocarpa constitute 70% of the zone, and their patch numbers constitute 42% of all community patches. In contrast, the transitional vegetation communities like meadow constitute for a very small percentage, and fewer none-marsh communities like forestry and bush appear in this zone. The different distribution of wetland communities indicates that the overabundant water plays a key role on restraining none- marsh communities in the yearly saturated zone. A cluster analysis was executed by using the Two-Step Cluster module in SPSS 12.0 for testing the quantitative characteristic of the biophysical wetland habitat in HNNR, and the statistical results of two clusters demonstrates that principal difference exists between the marsh communities and the non-marshes communities according to 100 sample points (Fig. 10). Cluster one is distributed in all three hydrological zones consisting of all marshes, and some types of meadow.
V. CONCLUSION
It is complicated to establish a rational assemble of variables for quantifying interaction between wetland ecology and hydrology in the wetland. The existence of the wetland ecosystem involves diversified environmental factors within various kinds of specific niches, and numerous incompatibilities between the ecological, data and statistical models can be identified (Wheeler, 1999; Austin, 2007). The interaction between the wetland ecology and hydrology is complicated due to multiple environmental factors involved, for example, hydrological process and ecological process can play a key role in the formation of the spatial patterns. Except for the flooding zone delineated by the GIS methods with the support of field hydrological monitor data in this research, few hydrological variables involved in our coupling analysis. The wetland hydro-ecological model presented in this paper is specifically designed to contain the bare minimum of detail necessary for a spatially explicit wetland community coupled with its hydrological pattern (Fig. 1). How can our hydro-ecological model to be qualified for such a complicated reality of the wetland? A strong theoretical in Liebig’s Law of the mini- mum justifies our model application in China. Liebig’s Law of the Minimum is operating when modeling species response to environmental predictors and then predicting their spatial distribution. One statement of the Law would be “plant growth will be limited by the nutrient in shortest supply even when other nutrients are abundant, giving rise to a hyperbolic response curves to individual nutrients” (Austin, 2007). In China, isolated natural wetlands are always surrounded by the extensive irrigation system which demands all available water resources for the agriculture (Liu et al., 2002). Therefore, the “shortest supply” for wetland plant growth is availability of water resources within the inland wetland. Furthermore, the wetland ecosystem within the HNNR as a natural wetland is mainly the water controlled ecological system. The ecological spatial pattern can match its hydrological pattern very well.
from modern geo-information techniques. The scarcity of avail- able data due to wetlands far from residential areas as well as their inaccessibility, or data qualification limitations, also highlights the need for such geo-information techniques to support hydro-ecological wetland research. Multi-temporal remote sensed images can be employed to generate digital vegetation information at the various plant ecological scales, and the vegetation ecological information can be coupled with hydrological zonation produced by GIS hydrological analysis methods from a DEM of the study area. This methodology is helpful to quantitatively couple the wetland landscape ecology into hydrological units.
REFERENCES
Acremanm, C., 2001. Hydro-ecology: Linking Hydrology and Aquatic Ecology. IAHS Publ.
Aspinall, R., Pearson, D., 2000. Integrated geographical assessment of environmental condition in water catchments: liking landscape ecology, environmental modelling and GIS. J. Environ. Manage. 59, 299–319.
Austin, M., 2007. Species distribution models and ecological theory: a critical assessment and some possible new approaches. Ecol. Model. 200, 1–19.
Busch, D.E., Loftus, W.F., Bass, O.L., 1998. Long-termhydrological effects on marsh plant community structure in the southern Everglades. Wetlands 18 (2), 230–241.
Capon, S.J., 2005. Flood variability and spatial variation in plant community composition and structure on a large arid floodplain. J. Arid Environ. 60, 283–302.
Coops, H., Brink, F.W., Velder, G., 1996. Growth and morphological responses of four helophyte species in an experimentalwater-depth gradient. Aquat. Bot. 54, 11–24.
Forman, R.T.T., 1995. Some general principles of landscape and regional ecology. Landsc. Ecol. 10 (3), 133–142. Hattermann, F.F., Krysanova, V., Habeck, A., Bronstert, A., 2006. Integrating wetlands and riparian zones in river
basin modeling. Ecol. Model. 199, 9–392.
Hoersch, B., Braun, G., Schmidt, U., 2002. Relation between landform and vegetation in alpine regions of Wallis, Switzerland: a multi-scale remote sensing and GIS approach. Comput. Environ. Urban Syst. 6, 113–139.
Huang, B., Jiang, B., 2002. AVTOP: a full integration of TOPMODEL into GIS. Environ. Model. Softw. 17, 261–268. Hupp, R.C., Osterkamp, R.W., 1996. Riparian vegetation and fluvial geomorphic processes. Geomorphology 14
(4),277–295.
Jeltch, F., Milton, S.J., Dean, W.J., 1996. Tree spacing and co-existence in semi-arid savannas. J. Ecol. 84,583–595. Kennen, J.G., Kauffman, L.J., Ayers, M.A., Wolock, D.M., Colarullo, S.J., 2008. Use of an integrated flow model to
estimate ecologically relevant hydrologic characteristics at stream biomonitoring sites. Ecol. Model. 211, 57–76. Leitao,˜ A.B., Ahern, J., 2002. Applying landscape ecological concepts and metrics in sustainable landscape planning.
Landsc. Urban Plan. (59), 65–93.
Liu, H.Y., Zhang, S.K., Lu, X.G., 2004. Wetland landscape structure and the spatial-temporal changes in 50 years in the Sanjiang Plain. Acta Geograph. Sin. 59 (3), 391–400.
Liu, X.T., Ma, X.H., 2002. Natural Environmental Change and Ecological Protection in the Sanjiang Plain. Science Press, Beijing, pp. 55–75.
Martz, L.M., Garbrecht, J., 1998. The treatment of flat areas and depressions in automated drainage analysis of raster digital elevation models. Hydrol. Process 12, 843–855.