Available Online atwww.ijcsmc.com
International Journal of Computer Science and Mobile Computing
A Monthly Journal of Computer Science and Information Technology
ISSN 2320–088X
IMPACT FACTOR: 6.017
IJCSMC, Vol. 6, Issue. 6, June 2017, pg.259 – 265
Statically Analysis on Big
Data Using Hadoop
Jyoti Kumari
1, Mr. Surender
21
M.Tech Scholar, 2Associate Professor
1,2
Department of Computer Science & Engineering, Om group of institutions (Haryana)
1
[email protected], 2 [email protected]
Abstract:- Over the past decade, big data analysis has seen an exponential growth and will certainly continue to witness spectacular developments due to the emergence of new interactive multimedia applications and highly integrated systems driven by the rapid growth in information services and microelectronic devices. So far, most of the current mobile systems are mainly targeted to voice communications with low transmission rates. In the near future, however, big data access at high transmission rates will be. This is a review on accessible big-data systems that include a set of tools and technique to load, extract, and improve dissimilar data while leveraging the immensely parallel processing power to perform complex transformations and analysis. “Big-Data” system faces a series of technical challenges.
Keywords: - Big Data
I. INTRODUCTION
In this world of information the term BIG DATA has emerged with new opportunities and challenges to deal with the massive amount of data. BIG DATA has earned a place of great importance and is becoming the choice for new researches. To find the useful information from massive amount of data to organizations, we need to analyze the data. Mastery of data analysis is required to get the information from unstructured data on the web in the form of texts, images, videos or social media posts. Big Data present opportunities as well as challenges to the researchers. An overview on opportunities to healthcare, technology etc. is given.
The term of „„big-data‟‟ was coined to capture the profound meaning of this data-explosion trend and indeed the data has been touted as the new oil, which is expected to transform our society. For example, a McKinney report [2] states that the potential value of global personal location data is estimated to be $100 billion in revenue to service providers over the next ten years and be as much as $700 billion in value to consumer and business end users. These technological challenges demand an overhauling re-examination of the current data management systems, ranging from their architectural principle to the implementation details. Indeed, many leading industry companies [1] have discarded the transitional solutions to embrace the emerging big data platforms.
volume will grow by a factor of 300, from 130 Exabyte‟s to 40,000 Exabyte‟s, representing a double growth every two years. The huge potential associated with big-data has led to an emerging research field that has quickly attracted tremendous interest from diverse sectors, for example, industry, government and research community.
The broad interest is first exemplified by coverage on both industrial reports [2] and public media; Government has also played a major role in creating new programs [8] to accelerate the progress of tackling the big data challenges. Finally, Nature and Science Magazines have published special issues to discuss the big-data phenomenon and its challenges, expanding its impact beyond technological domains. As a result, this growing interest in big-data from diverse domains demands a clear and intuitive understanding of its definition, evolutionary history, building technologies and potential challenges.
First, due to the large variety of different data sources and the huge volume, it is too difficult to collect, integrate and analysis of “Big Data” with scalability from scattered locations.
Second “Big Data” systems need to manage, store and integrate the gathered large and varied verity of datasets, while provide function and performance assurance [1], in terms of fast retrieval, scalability and secrecy protection.
Third “Big Data” analytics must effectively excavation large datasets at different levels in real time or near real time - including modeling, visualization [2], prediction and optimization - such that inherent potentials can be revealed to improve decision making and acquire further advantages.
To address these challenges, the researcher IT industry and community has given various solutions for “Big Data” science systems in an ad-hoc manner. Cloud computing can be called as the substructure layer for “Big Data” systems to meet certain substructure requirements, such as cost-effectiveness, resistance[2], and the ability to scale up or down. Distributed file systems and No SQL databases are suitable for persistent storage and the management of massive scheme free datasets [1]. Map Reduce, R is a programming framework, has achieved great success in processing “Big Data” group-aggregation tasks, such as website ranking [10]. Hadoop integrates data storage, data processing, system management, and other modules to form a powerful system-level solution, which is becoming the mainstay in handling “Big Data” challenges. We can build various “Big Data” application system based on these innovative technologies and platforms. In light of the of big-data technologies, a systematic frame work should be in order to capture the fast evolution of big-data research.
ABRIEF HISTORY OF BIG DATA
Considering the growth and intricacy of “Big Data” science systems, previous descriptions are based on a one-sided view point, such as chronology or milepost technologies. The history of “Big Data” is presented in terms of the data size of interest. Under this framework, the history of “Big Data” is tied closely to the capability of efficiently storing and managing larger datasets, with size boundaries expanding by orders of degree.
FIGURE 1:GROWTH OF BIG DATA.
1) Megabyte to Gigabyte: In the 1970s and 1980s, historical business data introduced the earliest “Big Data” challenge in moving from megabyte to gigabyte sizes. [18]
2) Gigabyte to Terabyte: In the late 1980s, the popularization of digital technology caused data volumes to expand to several gigabytes or even a terabyte, which is beyond the storage and/or processing capabilities of a single large computer system [2]. Data parallelization was proposed to extend storage capabilities and to improve performance by distributing data and related tasks, such as building indexes and evaluating queries, into disparate hardware.
PRINCIPLES FOR DESIGNING BIG DATA SYSTEM
In designing “Big Data” analytics systems, we summarize seven necessary principles to guide the development of this kind of burning issues [3]. “Big Data” analytics in a highly distributed system cannot be achievable without the following principles [13].
BIG DATA OPPORTUNITIES
The bonds between “Big Data” and knowledge hidden in it are highly crucial in all areas of national priority. This initiative will also lay the groundwork for complementary “Big Data” activities, such as “Big Data” sub structure projects, platforms development, and techniques in settling complex, data-driven problems in sciences and engineering. Researchers, policy and decision makers have to recognize the potential of harnessing “Big Data” to uncover the next wave of growth in their fields. There are many advantages in business section that can be obtained through harnessing “Big Data” increasing operational efficiency, informing strategic and direction etc.
BIG DATA ANALYSIS
The last and most important stage of the “Big Data” value chain is data analysis, the goal of which is to get useful values, suggest best conclusions and support decision-making system of an organization to stay in competition market. [1]
Descriptive Analytics: exploits historical data to describe what occurred in past. For instance, a regression technique may be used to find simple trends in the datasets, visualization presents data in a meaningful fashion, and data modeling is used to collect, store and cut the data in an efficient way. Descriptive analytics is typically associated with business intelligence or visibility systems [2].
Predictive Analytics: focuses on predicting future probabilities and trends. For example, predictive modeling uses statistical techniques such as linear and logistic regression to understand trends and predict future out-comes, and data mining extracts patterns to provide insight and forecasts [4].
Prescriptive Analytics: addresses decision making and efficiency. For example, simulation is used to analyze complex systems to gain insight into system performance and identify issues and optimization techniques are used to find best solutions under given constraints.
BIG DATA CLASSIFICATION ALGORITHM 1) Decision Tree
2) Random Forest
3) Support Vector Machine
Decision tree learning uses a decision tree as a predictive model which maps observations about an item to conclusions about the item's target value. It is one of the predictive modeling approaches used in statistics, data mining and machine learning. Tree models where the target variable can take a finite set of values are called classification trees. In decision analysis, a decision tree can be used to visually and explicitly represent decisions and decision making. In data mining, a decision tree describes data but not decisions; rather the resulting classification tree can be an input for decision making [23].
Random Forests is an ensemble learning method also thought of as a form of nearest neighbor predictor for classification and regression that construct a number of decision trees at training time and outputting the class that is the mode of the classes output by individual trees. Random Forests is a combination of tree predictors. The basic principle is that a group of “weak learners” can come together to form a “strong learner”. Random Forests are a wonderful tool for making predictions considering they do not over fit because of the law of large numbers. [24].
II BIG DATA TOOLS:TECHNIQUES AND TECHNOLOGIES
To capture the value from “Big Data”, we need to develop new techniques and technologies for analyzing it. Until now, scientists have developed a wide variety of techniques and technologies to capture, curate, analyze and visualize Big Data.
We need tools (platforms) to make sense of “Big Data”. Current tools concentrate on three classes, namely, batch processing tools, stream processing tools, and interactive analysis tools. Most batch processing tools are based on the Apache Hadoop infrastructure, such as Map reduce [4].
In this we will describe about the design and evaluation simulation experiments. We investigated the performance issues related to the resource optimization. For experiments purpose, we use Hadoop Map R sandbox. Experimental results show that NQO and WQO, both have attempts for read operation and WQO wrote more Bytes are written during query optimization process as compared to the NQO. In this work, impact of query execution will be investigated and a optimal solution for query processing will be offered. Performance analysis includes various parameters i.e. execution time, battery life, number of processes used. For experimental purpose, we will use MapR sandbox.
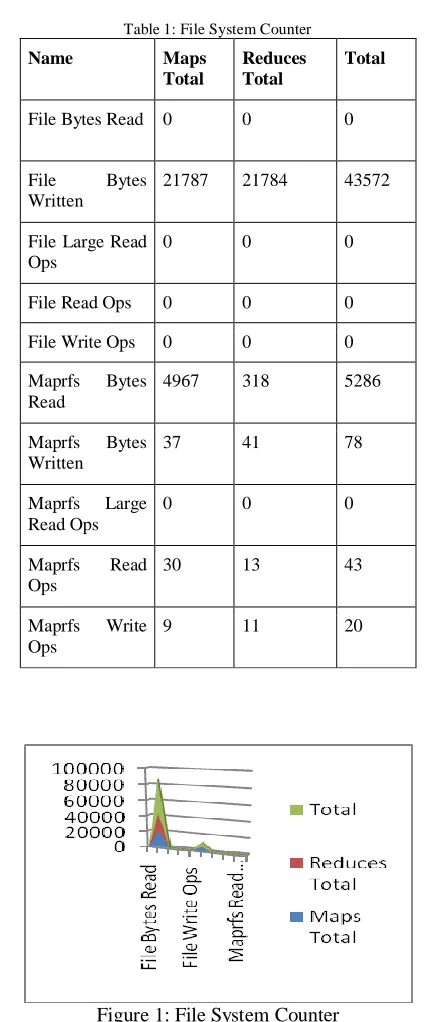
Table 1: File System Counter
Name Maps Total
Reduces Total
Total
File Bytes Read 0 0 0
File Bytes
Written
21787 21784 43572
File Large Read Ops
0 0 0
File Read Ops 0 0 0
File Write Ops 0 0 0
Maprfs Bytes
Read
4967 318 5286
Maprfs Bytes
Written
37 41 78
Maprfs Large
Read Ops
0 0 0
Maprfs Read
Ops
30 13 43
Maprfs Write
Ops
9 11 20
Figure 1: File System Counter
Table 5.2: Job Counter
NQO WQO
Disk Millis Maps 61272 9979
Disk Millis Reduces 6780 7094
Mb Millis Maps 125485056 20435968
Mb Millis Reduces 15661056 16386048
Figure 5.2: Job Counter
Above figure shows the Job counter for NQO and WQO. It can be observed that NQO used more Mb Millis Map and Reduce process as compared to WQO.
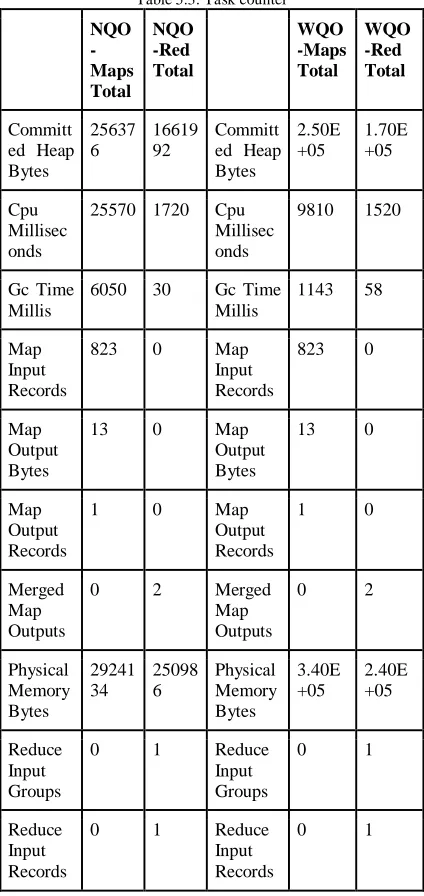
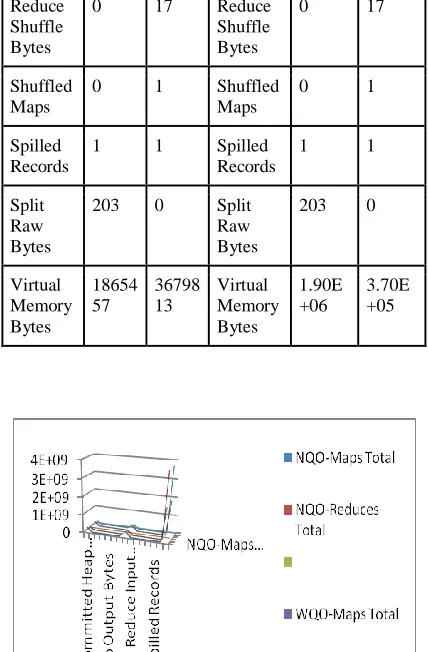
Table 5.3: Task counter
NQO -Maps Total NQO -Red Total WQO -Maps Total WQO -Red Total Committ ed Heap Bytes 25637 6 16619 92 Committ ed Heap Bytes 2.50E +05 1.70E +05 Cpu Millisec onds
25570 1720 Cpu
Millisec onds
9810 1520
Gc Time Millis
6050 30 Gc Time
Millis
1143 58
Map Input Records
823 0 Map
Input Records
823 0
Map Output Bytes
13 0 Map
Output Bytes
13 0
Map Output Records
1 0 Map
Output Records
1 0
Merged Map Outputs
0 2 Merged
Map Outputs
0 2
Physical Memory Bytes 29241 34 25098 6 Physical Memory Bytes 3.40E +05 2.40E +05 Reduce Input Groups
0 1 Reduce
Input Groups
0 1
Reduce Input Records
0 1 Reduce
Input Records
Reduce Shuffle Bytes
0 17 Reduce
Shuffle Bytes
0 17
Shuffled Maps
0 1 Shuffled
Maps
0 1
Spilled Records
1 1 Spilled
Records
1 1
Split Raw Bytes
203 0 Split
Raw Bytes
203 0
Virtual Memory Bytes
18654 57
36798 13
Virtual Memory Bytes
1.90E +06
3.70E +05
Figure 3: Task counter
The above figure shows that NQO and WQO, both have almost performed similar tasks but results show that WQO performed well as compared to NQO.
III CONCLUSION
Analysis show that NQO used more Mb Millis Map and Reduce process as compared to WQO and both have almost performed similar tasks but WQO performed well as compared to NQO. WQO requires less slots for MAP and Reduce processes. NQO consumed extra slots for Millis Map and Reduce processes. NQO was completed 156s for completion as compared to WQO which is 53s only. So it can be observed that NQO requires more time for job completion and consumed more energy as compared to WQO. Finally, it can be concluded that proposed scheme is able to reduce the overall consumption of available resources and it can be extended to load balancing also.
REFERENCES
1. M. Dhavapriya, et al. , “Big Data Analytics: Challenges and Solutions Using Hadoop, Map Reduce and Big Table”, International Journal of Computer Science Trends and Technology (IJCST) – Volume 4 Issue 1, PP 5-14 ISSN: 2347-8578 2016
2. Varsha B.Bobade , “Survey Paper on Big Data and Hadoop” International Research Journal of Engineering and Technology (IRJET) e-ISSN: 2395-0056 Volume: 03 Issue: 01 PP 861 ISSN: 2395-0072 2016
3. Rahul Beakta, “Big Data And Hadoop: A Review Paper” Baddi University of Emerging Sciences & Technology, Baddi, India Volume 2, Spl. Issue 2 ISSN: 1694-2329 2015
4. Ms. Gurpreet Kaur Et Al., “Review Paper On Big Data Using Hadoop” International Journal of Computer Engineering & Technology (IJCET) Volume 6, Issue 12, pp. 65-71, ISSN 0976–6375 2015
6. Anant Bhardwaj1, Souvik Bhattacherjee2, Amit Chavan2 Amol Deshpande2, Aaron J. Elmore1,3, Samuel Madden1, Aditya Parameswaran, “DataHub: Collaborative Data Science & Dataset Version Management at Scale”, 2015
7. Alekh Jindal, Challenges and Opportunities with Big Data Robust Data Transformations, 2015
8. Bill Howe, “Big Data Science Needs Big Data Middleware”, Jan 2015
9. Radu Tudoran, “High-Performance Big Data Management Across Cloud Data Centers”, Jan 2015
10. Burt L. Monroe, Jennifer Pan , Margaret E. Roberts, Maya Sen , Betsy Sinclair, “No! Formal Theory, Causal Inference, and Big Data Are Not Contradictory Trends in Political Science”, American Political Science Association, 2015
11. Poonam et al., “Survey Paper on Big Data Processing and Hadoop” International Journal of Science and Research (IJSR) ISSN (Online): 2319-7064 Volume 3 Issue 10, 2014
12. Hongbo Zou, Yongen Yu, Wei Tang, Hsuan- Wei Michelle Chen, “Flex Analytics: A Flexible Data Analytics Framework for Big Data Application with I/O Performance Improvement”, Elsevier 2014
13. C.L. Philip Chen, Chun-Yang Zhang, “Data intensive applications, challenges, techniques and technologies: A survey on Big Data” Information Science 0020-0255 (2014), PP 341-347, elsevier
14. Han hu1At. Al. (Fellow, IEEE),” Toward Scalable Systems for Big Data Analytics: A Technology Tutorial”, IEEE 2169-3536(2014),PP 652-687
15. Shweta Pandey, Dr.Vrinda Tokekar,” Prominence of Map Reduce in BIG DATA Processing”, IEEE (Fourth International Conference on Communication Systems and Network Technologies)978-1-4799-3070-8/14, PP 555-560
16. Katarina Grolinger At. Al.“Challenges for Map Reduce in Big Data”, IEEE (10th World Congress on Services)978-1-4799-5069-0/14,PP 182-189
17. Lei,Wang At. Al., “Big Data Bench: a Big Data Benchmark Suite from Internet Services”,IEEE 978-1-4799-3097-5/14.
18. Anirudh Kadadi At. Al., “Challenges of Data Integration and Interoperability in Big Data”, IEEE (International Conference on Big Data)978-1-4799-5666-1/14, PP 38-40
19. Zhen Jia1 At. Al.“Characterizing and Sub setting Big Data Workloads", IEEE 978-1-4799-6454-3/14, PP 191-201
20. Hajar Mousanif At. Al., “From Big Data to Big Projects: a Step-by-step Roadmap”, IEEE (International Conference on Future Internet of Things and Cloud) 978-1-4799-4357-9/14, PP 373-378
21. Ganapathy Mani, Nima Barit, Duoduo Liao, Simon Berkovich, “Organization of Knowledge Extraction from Big Data Systems”, IEEE (4 Fifth International Conference on Computing for Geospatial Research and Application) 978-1-4799-4321-0/14, PP 63-69
22. Avita Katal, Mohammad Wazid, R H Goudar, “Big Data: Issues, Challenges, Tools and Good Practices”, IEEE 978-1-4799-0192-0/13,PP 404-409
23. Du Zhang,” Inconsistencies in Big Data”, IEEE 978-1-4799-0783-0/13, PP 61-67
24. Zibin Zheng, Jieming Zhu, and Michael R. Lyu, “Service-generated Big Data and Big Data-as-a-Service: An Overview”, IEEE (International Congress on Big Data) 978-0-7695-5006-0/13, PP 403-410