© 2018, IRJET | Impact Factor value: 6.171 | ISO 9001:2008 Certified Journal | Page 2790
CONTINGENCY ANALYSIS & SECURITY OF 6 BUS POWER SYSTEM
NETWORK
NEELESH SAHU
1, Dr. K.T. CHATURVEDI
21
Assistant professor (power system specialization),Dept of Electrical &Electronics Engineering, School of research
&technology ,Peoples university Bhopal ,M.P., India
2
Assistant Professor , Dept of Electrical &Electronics Engineering, University institute of technology,
RGPV, Bhopal, M.P., India
---***---Abstract -
Power systems are operated so that overloads do not occur either in real-time or under any statistically likely contingency. This is often called maintaining system “security”. Maintaining power system security is one of the challenging tasks for the power system engineers. Contingencies can consist of several actions or elements – Simple Example: outage of a single transmission line, Complex: outage of a several lines, a number of generators, and the closure of a normally open transmission line. The process of identifying these severe contingencies is referred as contingency selection and this can be done by calculating performance indices for each contingencies. The main motivation of the work is to carry out the contingency selection by calculating the two kinds of performance indices; Line flow performance index (PIlf) and Reactive power performance index (PIrp) for singletransmission line outage with the help of NEWTON RAPHSON load flow analysis. The PIlf and PIrp have been calculated in
MATLAB environment and contingency ranking is made. Overall performance index is the summation of two performance index, one of the performance index determines line overloading and other performance index determines bus voltage drop limit violation and are known as Line flow performance index PIlf and reactive power performance index
PIrp respectively. Here in this proposed work the contingency
ranking has been done with IEEE 6 bus.
Key Words
:
Contingency selection, Contingency
ranking, Lineoutage, Performance indices, Load flow
1. INTRODUCTION
Power system security is the ability of power system to survive in looming disturbances conditions (contingencies), without hampering to the safety reliability and customer service. It is well known that power system is a complex network consisting of numerous equipments like generators, transformers, transmission lines, circuit breakers etc. Failure of any of these equipments during its operation harms the reliability of the system and hence leading to outages. Thus one of the major agenda of power system planning and its operation is to study the effect of outages in terms of its severity.
Contingency selection or contingency screening is a process in which probable and potential critical contingencies are identified for which it requires consideration of each line or generator outage. To solve this problem a number of algorithms have been developed which are classified into two methods. One of those method is the Performance
Index[2] (PI)which is based on calculation the PI values and ranking them accordingly to quantify the severity for each case.
1.1 POWER SYSTEMSTATIC SECURITY LEVEL
In the Fig-1 given below arrowed lines represent involuntary transitions between levels 1 to 5 due to contingencies. The removal of violations from level 4 normally requires corrective rescheduling or remedial action bringing the system to level 3, from where it can return to either level 1or 2 by preventive rescheduling depending upon the desired operational security objectives. Levels 1 and 2 represent normal power system operation. Level 1 has the ideal security but is too conservative and costly. Level 2 is more economical, but depends on post contingency corrective rescheduling to alleviate violations without loss of load, within a specified period of time.
The Security assessment [1] gives the security level of the system operating state. The Security control determines the appropriate security constrained scheduling required to optimally attaining the target security level. The static security level of a power system is characterized by the presence or otherwise of emergency operating conditions (limit violations) in its actual (pre-contingency) or potential (post contingency) operating states. System security assessment is the process by which any such violation are detected. System monitoring provides the operator of the power system with pertinent up-to-date information on the current conditions of the power system.
© 2018, IRJET | Impact Factor value: 6.171 | ISO 9001:2008 Certified Journal | Page 2791
2. POWER FLOW STUDY
The objective of any power flow program [3] is to produce the following information:
• Voltage magnitude at each bus.
• Real and reactive power flowing in each line.
• Phase angle of voltage at each bus.
2.1 LOAD FLOW ANALYSIS USING POWER SYSTEM ANALYSIS TOOLBOX (PSAT)
The power system analysis toolbox (PSAT)[4], an open source Matlab and GNU/Octave-based software package for analysis and design of small to medium size electric power systems. PSAT includes power flow, continuation power flow, optimal power flow, small signal stability analysis and time domain simulation as well as several static and dynamic models, including non-conventional loads, synchronous and synchronous machines, regulators and FACTS. PSAT is also provided with a complete set of user-friendly graphical interfaces and a Simulink-based editor of one-line network diagrams. Basic features, algorithms and a variety of case studies is provided in PSAT .
Load Flow Study (LFS) is the most important part of system-planning , transient and dynamic stability studies. Load Flow Study (LFS) software package use [5],Power System Analyses Toolbox (PSAT).
3. MODELLING CONTINGENCY ANALYSIS
In the contingency analysis it involves the simulation of each contingency on the base case model of the power system, three major difficulties are involved in this analysis. First difficulty is to develop the appropriate power system model. Second is the choice of which contingency should be consider and third difficulty is computation of the power flow and bus voltages which leads to enormous time consumption in the Energy Management System.
It is therefore convenient to separate the on-line contingency analysis into three different stages named as contingency definition, selection and evaluation. Contingency definition comprises of the set of possible contingencies that might occur in a power system, it involves the process of creating the contingency list. Contingency selection is a process of identifying the most severe contingencies from the contingency list that leads to limit violations in the power flow and bus voltage magnitude, thus this process eliminates the least severe contingencies and shortens the contingency list. It uses some sort of index calculations which indicates the severity of contingencies. On the basis of the results of these index calculations the contingency cases are ranked. Contingency evaluation is then done which involves the necessary security actions or necessary control to function in order to mitigate the effect of contingency.
3.1 CONTINGENCY RANKING APPROACH
The Contingency analysis with the use of AC power flow gives the advantage that it provides power flows in terms of MW, MVAR and bus voltage magnitudes. Using the AC power flow overloads and accurate voltage limit violations can be found. In the present work, for the contingency ranking outages of each line has been considered. Performance indices (PI) are considered for ranking the severity of a particular contingency. Conventional power flow methods are used in calculating the indices in an offline mode. After obtaining the values obtained using conventional method are sorted out in descending manner and the highest value of PI is ranked first. There are two types of performance index [2] which are mainly used for contingency analysis. They are as follow:
I. Line flow performance index (PIlf) : This is the index which helps in determining the extent of line over loads
II. Reactive power performance index (PIrp) : This
is the index which helps in determining bus Voltage limit violation.
Line flow performance index (PIlf) :
PIlf
=
(P
l new/ P
llimit)
2nWhere
P
l new is the MW power flow of line lP
llimit is the MW capacity of line l is the number of lines of the systemW is the real non-negative weighting factor, value = 1 n is exponent of penalty function and value is (=1)
P
llimit = ( Vi *Vj) / XWhere,
Vi is voltage at the bus ith obtained from NR solution
Vj is voltage at the bus jth obtained from NR solution X is the reactance of the line connecting ith and jth bus
Reactive power performance index (PIrp) :
PI
rp=
{(|
V
i|- |V
isp|
)/Δ
V
ilim }2n+
(Q
i/ Q
ilimit)
2n|
Vi| is the voltage magnitude at ith bus|Visp| is the specified (rated) voltage magnitude at ith bus
© 2018, IRJET | Impact Factor value: 6.171 | ISO 9001:2008 Certified Journal | Page 2792 n is the exponent of penalty function and value is (=1)
is the number of buses in the system taken.
Q
i is the produced reactive power at ith bus
Q
ilimit is the reactive power production limit. Ng is the number of generating units in the system.Bus voltages are also influenced by the reactive power which is produced by the generating units and PIrp provides
information regarding severity of abnormal voltages till the reactive power are within the limits or not.
3.2 ALGORITHM FOR CONTINGENCY ANALYSIS USING NEWTON RAPHSON METHOD
Step 1: Read the given system’s line data and bus data.
Step 2: Without considering the line contingency perform the load flow analysis for base case.
Step 3: Simulating a line outage or line contingency, i.e. removing a line and proceeding to the next step.
Step 4: Load flow analysis is done for this particular outage, then calculation of the active power flow is done in the remaining lines and value Plimit is found out .
Step 5: The Line flow performance index(PIlf) is found,
which indicates the active power limit violation of the system model taken.
Step 6: subsequently for the particular line contingency; voltages of all the load buses are calculated.
Step 7: Then Reactive power performance index (PIrp) is
being calculated which indicates the voltage limit violation at all the load buses due to the line contingencies.
Step 8: Computation of overall performance index is done by adding PIlf and PIrp for each line outage of the system.
Step 9: Steps 3 to 8 for all line outages is repeated to obtain the PIlf and PIrp for all line outages.
Step 10: Then contingencies is ranked based on the overall performance index (OPI) which is calculated according to the values of the performance indices obtained.
Step 11: Do the power flow analysis for the most severe contingency case and obtain the results.
FLOW CHART ALGORITHM
4. RESULTS
The computation of performance indices are calculated based on the load flow analysis carried out using conventional method Newton Raphson method under MATALB environment. The most severe contingent is chosen from the contingency list and the corresponding power flows and line flows are analyzed for the considered power system. The study has been carried out for the following 6 bus standard system.
© 2018, IRJET | Impact Factor value: 6.171 | ISO 9001:2008 Certified Journal | Page 2793 In Fig-2 bus system consist of bus1 as slack bus, bus2 ,bus6 &
bus4 as load bus ,and bus3,bus5 &bus2 as generator bus. There are 7 transmission line for 6 bus system and active power flows on transmission lines were obtained using NR load flow method. In Fig-2 the active power flows and bus
voltages are shown by considering the base case .
The bus data and line for the 5 bus test system has been given in Table Below. The following conventions were used for all the test bus systems; Base MVA = 100
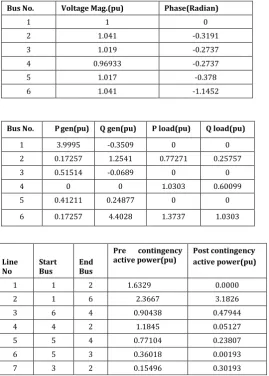
Bus No. Voltage Mag.(pu) Phase(Radian)
1 1 0
2 1.041 -0.3191
3 1.019 -0.2737
4 0.96933 -0.2737
5 1.017 -0.378
6 1.041 -1.1452
Bus No. P gen(pu) Q gen(pu) P load(pu) Q load(pu)
1 3.9995 -0.3509 0 0
2 0.17257 1.2541 0.77271 0.25757
3 0.51514 -0.0689 0 0
4 0 0 1.0303 0.60099
5 0.41211 0.24877 0 0
6 0.17257 4.4028 1.3737 1.0303
[image:4.595.305.566.76.194.2]
Table A.1: ACTIVE POWER(pu) FLOWS IN THE PRE AND POST CONTINGENCY STATE
From bus To bus Line P flow(pu)
1 2 1 1.6329
1 6 2 2.3667
4 6 3 0.90438
2 4 4 1.1845
5 4 5 0.77104
3 5 6 0.36018
3 2 7 0.15496
From bus To bus Line Q Flow
1 2 1 0.04902
1 6 2 -0.3999
4 6 3 -0.5029
2 4 4 0.42307
5 4 5 0.22532
3 5 6 0.01305
3 2 7 -0.0819
[image:4.595.34.304.208.585.2]
TABLE A.2 POWER FLOWS IN LINE BETWEEN BUSES
By considering the line outage for each line at a time, the load flow analysis is done with the line outage no.1 . The active power and reactive power performance indices PIP
and PIV are calculated considering the outage of only one line
[image:4.595.348.557.300.458.2]sequentially and the calculated indices are summarized.
Fig-3 post contingency state of 6 bus system
By considering the line outage for each line at a time, the load flow analysis is done. considering the outage of only one line sequentially and the calculated indices are summarized. The contingencies have been ordered by their ranking where the most severe contingency is being ranked 1 and the least has been ranked 7. The variation of overall performance index(OPI) with their ranking has been shown in the Fig. . It is clear from the result of different OPI that the contingency number 1 which the line outage no. 1 is the most severe contingency. Hence the post contingency analysis corresponding to this line outage has been performed.
In this work, the contingency selection and ranking which are important for contingency analysis have been done by evaluating two important performance indices namely; active and reactive power performance index (PIlf & PIrp).
These indices were calculated for various test bus systems using the NR method, since the for the contingency ranking, Overall Performance Index (OPI) is calculated which is the summation of two severity indices namely Line flow performance index and Reactive power performance index using Newton-Raphson load flow method.
Line
No Start Bus End Bus
Pre contingency
active power(pu) Post contingency active power(pu)
1 1 2 1.6329 0.0000
2 1 6 2.3667 3.1826
3 6 4 0.90438 0.47944
4 4 2 1.1845 0.05127
5 5 4 0.77104 0.23807
6 5 3 0.36018 0.00193
© 2018, IRJET | Impact Factor value: 6.171 | ISO 9001:2008 Certified Journal | Page 2794 Outage
no.
PIlf PIrp OPI Ranking
1 0.596 1.2104 1.8064 1
2 0.304 0.812 1.116 3
3 0.1227 0.9282 1.0509 4
4 0.108 1.1878 1.2958 2
5 0.1866 0.8322 1.0188 5
6 0.0596 0.804 0.864 7
[image:5.595.303.563.84.243.2]7 0.0597 0.3362 0.8669 6
Table A.3 PERFORMANCE INDICES, OVERALL PERFORMANCE INDEX AND CONTINGENCY RANKING
Line outage contingencies are considered for each line and one at a time, and the load flow analysis is carried out for the outages individually. The Line flow Performance indices and Reactive power Performance indices has been calculated for each line outage. The active power flows for line outage-1 have been shown in table A.1. The Table A.1show the pre contingency state and post contingency state for the active power flows, while Table A.3 shows Line flow performance index and Reactive power performance index for each line outages and their ranking corresponding to highest overall performance index. From the Table A.3 it is observed that line outage number 1 has the highest OPI, overall performance index because of contribution of high value of PIrp for that particular line outage(because for line outage no.
1 the bus voltages has violated the minimum voltage limit (0.950 p.u.), while in other outage cases the bus voltages lies below or above nominal voltage i.e.(1 p.u.) but remains within maximum voltage limit range (1.05 pu) and so PIv can be seen above 1.0 based on bus voltages considered and hence it is ranked as first.
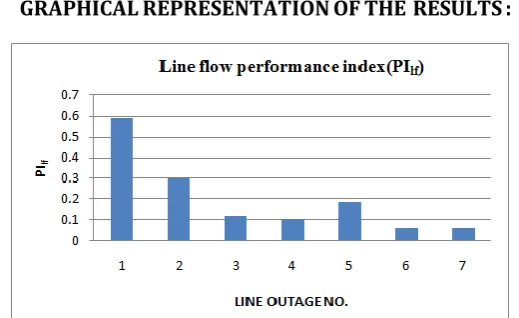
Fig.4 represents the graphical representation of Values of PIlf
for 6-Bus system. Fig.5 represents the graphical representation of Values of PIrp for 6-Bus system. these
performance indices for each outage cases and the contingency ranking based on the overall performance indices has been shown.
Bus voltages are also influenced by the reactive power which is produced by the generating units and PIrp provides
information regarding severity of abnormal voltages till the reactive power are within the limits or not. During a case of a contingency and if the reactive power reaches to their limits, and under this circumstance taking reactive power limits standard AC load flow calculates the bus voltages and therefore there is deviation of voltage from their scheduled voltage at generator buses. Hence, for the voltage analysis under contingency involves the reactive power constraints of the generators also.
GRAPHICAL REPRESENTATION OF THE RESULTS :
Fig.4 Values of PIlf for 6-Bus system
Fig.5 Values of PIrp for 6-Bus system
Fig.6 value of OPI for 6 bus system
From the results we can conclude that Performance indices calculated indicates how much severe a possible line outage is and thus defines the severity of each line outage in the system .The performance index with highest value indicates the severity of that particular line outage and also indicates that it has got maximum chances of making system parameters to operate beyond the operating limits. Thus it helps the operational engineers of power system to take necessary and prior actions to mitigate the problem and thus
[image:5.595.305.563.299.592.2]© 2018, IRJET | Impact Factor value: 6.171 | ISO 9001:2008 Certified Journal | Page 2795 helps in guiding to have a safe, secure, reliable and
continuous supply from the power system.
SCOPE FOR FUTURE WORK
The followings can be taken up for further study and analysis:
» The training for large systems like 30-Bus system and the structure of RBF-ANN like, neurons in hidden layer need to be investigated further.
» To perform the contingency analysis and the contingency selection consider a multiple line or equipment failures.
» Implement a hardware model for the neural network so that it can be used for online applications in power system
contingency analysis
REFERENCES
[1] M.Shahidehpour, W. F. Tinney and Y. Fu “Impact of security on power systems operation” Proc. IEEE, vol. 93, no. 11 Nov. 2005.
[2] Pudi Sekhar, Prof. Sanjeeb Mohanty “Power system contingency ranking using Newton Raphson load flow method” 2013 Annual IEEE.
[3]
“A Power Flow Solution by Newton-Raphson and Time
Domain Simulation”, Changing Kang and Lei Yuan.
[4] An Open Source Power System Analysis Toolbox, Federico Milano, Member, IEEE.