ClinicoEconomics and Outcomes Research 2017:9 505–518
ClinicoEconomics and Outcomes Research
Dove
press
submit your manuscript | www.dovepress.com 505
O R I G I N A L R E S E A R C H
open access to scientific and medical research
Open Access Full Text Article
A cost-effectiveness analysis of first-line induction
and maintenance treatment sequences in patients
with advanced nonsquamous non-small-cell lung
cancer in France
Kaisa Taipale1
Katherine B Winfree2
Mark Boye2
Mickael Basson3
Ghassan Sleilaty4
James Eaton5
Rachel Evans5
Christos Chouaid6
1Global Patient Outcomes and
Real World Evidence International, Oy Eli Lilly Finland AB, Helsinki, Finland; 2Global Patient Outcomes
and Real World Evidence, Eli Lilly and Company, Indianapolis, IN, USA;
3Corporate Affairs, Lilly France,
Neuilly-sur-Seine, 4Bio-Medicines
Medical Affairs, Lilly France, Neuilly-sur-Seine, France; 5ICON Health
Economics and Epidemiology, ICON Plc, Milton Park, UK; 6Thoracic
Oncology, Service de Pneumologie, Centre Hospitalier Intercommunal Créteil, Créteil, France
Background: Comparative effectiveness and cost-effectiveness data for induction–maintenance (I–M) sequences for the treatment of patients with nonsquamous non-small-cell lung cancer (nsqNSCLC) are limited because of a lack of direct evidence. This analysis aimed to compare the cost-effectiveness of I–M pemetrexed with those of other I–M regimens used for the treat-ment of patients with advanced nsqNSCLC in the French health-care setting.
Materials and methods: A previously developed global partitioned survival model was adapted to the France-only setting by restricting treatment sequences to include 12 I–M regi-mens most relevant to France, and incorporating French costs and resource-use data. Following a systematic literature review, network meta-analyses were performed to obtain hazard ratios for progression-free survival (PFS) and overall survival (OS) relative to gemcitabine + cisplatin (induction sequences) or best supportive care (BSC) (maintenance sequences). Modeled health-care benefits were expressed as life-years (LYs) and quality-adjusted LYs (QALYs) (estimated using French EuroQol five-dimension questionnaire tariffs). The study was conducted from the payer perspective (National Health Insurance). Cost- and benefit-model inputs were discounted at an annual rate of 4%.
Results: Base-case results showedpemetrexed + cisplatin induction followed by (→) pemetrexed maintenance had the longest mean OS and PFS and highest LYs and QALYs. Costs ranged from €12,762 for paclitaxel + carboplatin → BSC to €35,617 for pemetrexed + cisplatin →
pemetrexed (2015 values). Gemcitabine + cisplatin → BSC, pemetrexed + cisplatin → BSC, and pemetrexed + cisplatin → pemetrexed were associated with fully incremental cost-effectiveness ratios (ICERs) of €16,593, €80,656, and €102,179, respectively, per QALY gained versus paclitaxel + carboplatin → BSC. All other treatment sequences were either dominated (ie, another sequence had lower costs and better/equivalent outcomes) or extendedly dominated (ie, the comparator had a higher ICER than a more effective comparator) in the model. Sensitivity analyses showed the model to be relatively insensitive to plausible changes in the main assump-tions, with none increasing or decreasing the ICER by more than ~€20,000 per QALY gained.
Conclusion: In the absence of direct comparative trial evidence, this cost-effectiveness analy-sis indicated that of a large number of I–M sequences used for the treatment of patients with nsqNSCLC in France, pemetrexed + cisplatin → pemetrexed achieved the best clinical outcomes (0.28 incremental QALYs gained) versus paclitaxel + carboplatin → BSC.
Keywords: advanced nonsquamous NSCLC, cost-effectiveness, France, induction–maintenance, pemetrexed, quality-adjusted life-years
Correspondence: Kaisa Taipale
Oy Eli Lilly Finland AB, 23 Laajalahdentie, Helsinki 00330, Finland
Tel +358 40 840 0529 Email [email protected]
Journal name: ClinicoEconomics and Outcomes Research Article Designation: ORIGINAL RESEARCH
Year: 2017 Volume: 9
Running head verso: Taipale et al
Running head recto: Cost-effectiveness analysis of induction + maintenance in nsqNSCLC DOI: http://dx.doi.org/10.2147/CEOR.S128371
ClinicoEconomics and Outcomes Research downloaded from https://www.dovepress.com/ by 118.70.13.36 on 21-Aug-2020
For personal use only.
This article was published in the following Dove Press journal: ClinicoEconomics and Outcomes Research
16 August 2017
Dovepress Taipale et al
Introduction
In 2012, lung cancer was the leading cause of cancer death among men in most European countries (including France) and the second most common cause of cancer death among women in France after breast cancer.1 Efforts to improve
survival in patients with non-small-cell lung cancer (NSCLC;
>80% of patients with lung cancer have NSCLC) over the past 10 years have included targeting of the different histological subtypes of NSCLC (notably nonsquamous/squamous) and more recently molecular profiling.2,3 In the latest European
Society for Medical Oncology and American Society of Clinical Oncology guidelines, however, chemotherapy with a platinum doublet remains the standard first-line therapy for patients with nonsquamous NSCLC.4,5
In a recent report on pemetrexed,6 the French National
Authority for Health specified that it is not conceivable to treat patients with nonsquamous NSCLC in France without combining pemetrexed with platinum-based chemotherapy, depending on the line of treatment and patient profile. This recommendation stems from the lack of alternative thera-pies currently available for patients with this disease and the contribution that pemetrexed makes to their clinical management (eg, favorable tolerability profile, absence of contraindications with radiotherapy, and a 3-week adminis-tration schedule).
Based on the findings of Phase III trials, pemetrexed is currently approved7 for the treatment of patients with locally
advanced or metastatic nonsquamous NSCLC: as first-line therapy in combination with cisplatin therapy,8 as
mono-therapy for maintenance mono-therapy in patients whose disease has not progressed after four cycles of platinum-based first-line chemotherapy,9,10 and as second-line treatment.11 Pemetrexed
is less effective in NSCLC of squamous histology,10 and is
not indicated for use in this patient group.
Despite standard initial chemotherapy with a platinum doublet, most patients with advanced NSCLC will eventually progress. Maintenance therapy aims to prolong the favorable effect of initial chemotherapy, and is continued until disease progression. Various induction–maintenance treatment sequences utilizing maintenance therapy with single-agent pemetrexed, erlotinib, gemcitabine, or bevacizumab have demonstrated significant improvements in the overall survival (OS) of patients.9,10,12–16 However, few clinical studies have
compared induction–maintenance treatment sequences head to head; consequently, data on the comparative effectiveness and cost-effectiveness of induction–maintenance sequences are limited.
The aim of this study was to compare the clinical effec-tiveness and cost-effeceffec-tiveness of induction–maintenance chemotherapy-based sequences used for the treatment of patients with advanced nonsquamous NSCLC for whom plat-inum-based chemotherapy is the appropriate treatment choice in the French health-care setting. Sequences containing peme-trexed were compared with other induction– maintenance regimens. The study used a global decision-analysis model that has previously been adapted for use in the Swedish17 and
US health-care settings.18 The study was conducted from the
payer perspective (National Health Insurance).
Materials and methods
A global decision-analysis model was adapted to the French health-care setting by including induction–maintenance treat-ment sequences relevant to that clinical setting (Table 1), incorporating French costs and resource-use data, and using
Table 1 Induction–maintenance regimens included in the model
Comparator
Induction Æ Maintenance
Gemcitabine 1,000 mg/m2 + cisplatin 75 mg/m2 → BSC
Docetaxel 75 mg/m2 + cisplatin 75 mg/m2 → BSC
Vinorelbine 30 mg/m2 + cisplatin 80 mg/m2 → BSC
Paclitaxel 225 mg/m2 + carboplatin 400 mg/m2 → BSC
Pemetrexed 500 mg/m2 + cisplatin 75 mg/m2 → BSC
Gemcitabine 1,250 mg/m2 + cisplatin 80 mg/m2 + bevacizumab 7.5 mg/kg → Bevacizumab 7.5 mg/kg
Paclitaxel 200 mg/m2 + carboplatin 400 mg/m2 + bevacizumab 7.5 mg/kg → Bevacizumab 7.5 mg/kg
Docetaxel 75 mg/m2 + cisplatin 75 mg/m2 → Pemetrexed 500 mg/m2
Vinorelbine 30 mg/m2 + cisplatin 80 mg/m2 → Pemetrexed 500 mg/m2
Paclitaxel 225 mg/m2 + carboplatin 400 mg/m2 → Pemetrexed 500 mg/m2
Gemcitabine 1,000 mg/m2 + cisplatin 75 mg/m2 → Pemetrexed 500 mg/m2
Pemetrexed 500 mg/m2 + cisplatin 75 mg/m2 → Pemetrexed 500 mg/m2
Abbreviation: BSC, best supportive care.
ClinicoEconomics and Outcomes Research downloaded from https://www.dovepress.com/ by 118.70.13.36 on 21-Aug-2020
Dovepress Cost-effectiveness analysis of induction + maintenance in nsqNSCLC
French EuroQol five-dimension questionnaire (EQ-5D) tar-iffs to calculate quality-adjusted life-years (QALYs).
Comparators
Ten induction platinum doublets followed by maintenance treatment with pemetrexed or best supportive care (BSC; standard doublet–maintenance sequences) and two triplet therapies, consisting of bevacizumab plus a platinum-doublet induction regimen followed by single-agent bevacizumab continued until progression, were investigated using the model. All comparators mentioned in the French National Cancer Institute guidelines for use in patients who are willing and able to undergo chemotherapy19 and
for which evidence was available were included. Erlotinib induction and maintenance regimens were not included in line with the recent European Medicines Agency label
change for erlotinib, which focuses use of this drug in patients with advanced NSCLC who have EGFR-activating mutations.20 A no-treatment option was not included, as this
is not deemed to be an appropriate treatment strategy for this patient group.
Structure of the model
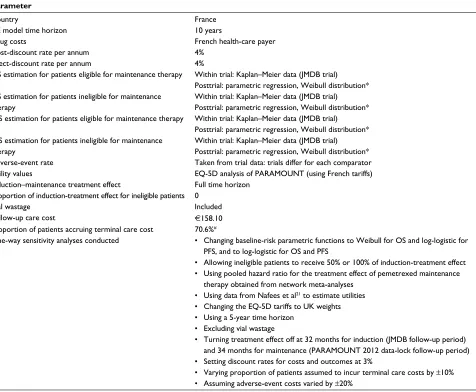
The model was made up of three health states: preprogres-sion, postprogrespreprogres-sion, and dead. It used an area-under-the-curve approach to simulate 1-week cycles (three model cycles are equivalent to one 21-day treatment cycle). The model calculates the proportion of patients in each health state according to the estimated survival functions for progression-free survival (PFS) and OS. A summary of key characteristics used in the base-case model and the sensitivity analyses conducted are shown in Table 2.
Table 2 Summary of key characteristics in the base-case model and sensitivity analyses conducted
Parameter
Country France
CE model time horizon 10 years
Drug costs French health-care payer
Cost-discount rate per annum 4%
Effect-discount rate per annum 4%
OS estimation for patients eligible for maintenance therapy Within trial: Kaplan–Meier data (JMDB trial) Posttrial: parametric regression, Weibull distribution* OS estimation for patients ineligible for maintenance
therapy
Within trial: Kaplan–Meier data (JMDB trial) Posttrial: parametric regression, Weibull distribution* PFS estimation for patients eligible for maintenance therapy Within trial: Kaplan–Meier data (JMDB trial)
Posttrial: parametric regression, Weibull distribution* PFS estimation for patients ineligible for maintenance
therapy
Within trial: Kaplan–Meier data (JMDB trial) Posttrial: parametric regression, Weibull distribution* Adverse-event rate Taken from trial data: trials differ for each comparator
Utility values EQ-5D analysis of PARAMOUNT (using French tariffs)
Induction–maintenance treatment effect Full time horizon Proportion of induction-treatment effect for ineligible patients 0
Vial wastage Included
Follow-up care cost €158.10
Proportion of patients accruing terminal care cost 70.6%#
One-way sensitivity analyses conducted • Changing baseline-risk parametric functions to Weibull for OS and log-logistic for PFS, and to log-logistic for OS and PFS
• Allowing ineligible patients to receive 50% or 100% of induction-treatment effect
• Using pooled hazard ratio for the treatment effect of pemetrexed maintenance therapy obtained from network meta-analyses
• Using data from Nafees et al21 to estimate utilities • Changing the EQ-5D tariffs to UK weights
• Using a 5-year time horizon
• Excluding vial wastage
• Turning treatment effect off at 32 months for induction (JMDB follow-up period) and 34 months for maintenance (PARAMOUNT 2012 data-lock follow-up period)
• Setting discount rates for costs and outcomes at 3%
• Varying proportion of patients assumed to incur terminal care costs by ±10%
• Assuming adverse-event costs varied by ±20%
Note: *Weibull distribution chosen, as visual assessment of survival curves showed that this provided both a reasonable extrapolation of event rates and a reasonable
within-trial fit; #data from Sesé et al.22 JMDB data taken from Scagliotti et al8; PARAMOUNT data taken from Paz-Ares et al.9
Abbreviations: CE, cost-effectiveness; EQ-5D, EuroQol five-dimension questionnaire; OS, overall survival; PFS, progression-free survival.
ClinicoEconomics and Outcomes Research downloaded from https://www.dovepress.com/ by 118.70.13.36 on 21-Aug-2020
Dovepress Taipale et al
A 10-year lifetime horizon was used so as to represent the anticipated survival of the cohort. Cost- and benefit-model inputs were discounted at an annual rate of 4%, consistent with current French National Authority for Health guide-lines;23 costs were calculated in December 2015 euros. The
primary measures of effectiveness modeled were life-years (LYs) and QALYs gained.
Modeling of PFS and OS
Treatment effects and baseline-risk estimates were synthe-sized using data from randomized controlled trials (RCTs) of induction and maintenance sequences. Hazard ratios (HRs) were combined for the induction and maintenance periods using the method described by Woods et al.24
Baseline risk
Baseline-risk estimates for each event type (progression or death) were obtained for the gemcitabine + cisplatin induc-tion regimen. Reasons for choosing this sequence included the accessibility of individual patient and efficacy data from a Phase III RCT comparing first-line pemetrexed + cisplatin and gemcitabine + cisplatin8 and that gemcitabine + cisplatin
is a relatively common comparator in RCTs (Table S1). A key feature of all trials investigating induction–maintenance regi-mens is that only patients who respond to induction receive subsequent maintenance therapy. A reanalysis of JMDB data8
found 63.5% of participants to be eligible for maintenance treatment (ie, had received four cycles of induction with no disease progression and who presented with an Eastern Cooperative Oncology Group [ECOG] performance status of 0–1). Due to a lack of treatment-specific data, the proportion
of patients eligible for maintenance therapy was assumed to be the same across all induction treatments.
Treatment efficacy
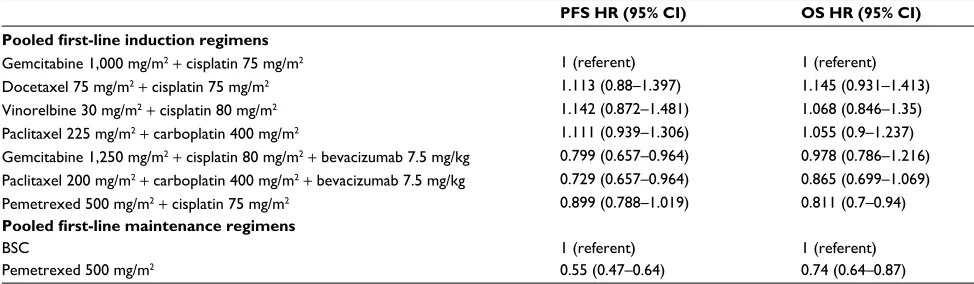
RCT evidence for the 12 selected induction–maintenance regimens was identified via systematic review. A series of net-work meta-analyses (NMAs) were performed to obtain HRs for OS and PFS relative to gemcitabine + cisplatin (induction sequences) or BSC (maintenance sequences) (Table 3). The systematic review was conducted using Preferred Reporting Items for Systematic Review and Meta-Analyses (PRISMA) guidelines. Inclusion/exclusion criteria for the systematic review and a list of studies included are provided in Table S1.
Induction–maintenance treatment effects were then applied to the baseline estimates of risk of each event type (progression or death) obtained from the reanalyzed JMDB trial data8 on patient eligibility for maintenance therapy. It
should be noted that the evidence available for the triplet sequences25–28 compared induction doublet therapy with
trip-let therapy, the additional component (bevacizumab) being continued until progression in those eligible for maintenance therapy. The relative treatment effect for the triplet compara-tors thus included the treatment effect from both the induction and maintenance components. In addition, the HRs included in the NMAs for the induction triplets already incorporated outcomes in both eligible and ineligible patients.
In line with clinical trial evidence, the maintenance- treatment effect used for pemetrexed in the base case was dependent on the choice of induction: the treatment effect in the PARAMOUNT trial9 was used for pemetrexed maintenance
if it followed a pemetrexed-induction doublet; the treatment
Table 3 PFS and OS HRs and 95% CIs for first-line induction and maintenance regimens included in the model (fixed-effect network
meta-analysis*)
PFS HR (95% CI) OS HR (95% CI)
Pooled first-line induction regimens
Gemcitabine 1,000 mg/m2 + cisplatin 75 mg/m2 1 (referent) 1 (referent)
Docetaxel 75 mg/m2 + cisplatin 75 mg/m2 1.113 (0.88–1.397) 1.145 (0.931–1.413)
Vinorelbine 30 mg/m2 + cisplatin 80 mg/m2 1.142 (0.872–1.481) 1.068 (0.846–1.35)
Paclitaxel 225 mg/m2 + carboplatin 400 mg/m2 1.111 (0.939–1.306) 1.055 (0.9–1.237)
Gemcitabine 1,250 mg/m2 + cisplatin 80 mg/m2 + bevacizumab 7.5 mg/kg 0.799 (0.657–0.964) 0.978 (0.786–1.216)
Paclitaxel 200 mg/m2 + carboplatin 400 mg/m2 + bevacizumab 7.5 mg/kg 0.729 (0.657–0.964) 0.865 (0.699–1.069)
Pemetrexed 500 mg/m2 + cisplatin 75 mg/m2 0.899 (0.788–1.019) 0.811 (0.7–0.94)
Pooled first-line maintenance regimens
BSC 1 (referent) 1 (referent)
Pemetrexed 500 mg/m2 0.55 (0.47–0.64) 0.74 (0.64–0.87)
Notes: *Network meta-analyses conducted using WinBUGS. The primary analysis was not adjusted for covariates; however, covariate-adjusted analyses were also
performed using the Cox proportional-hazard model (stratified by the nonplatinum component of induction chemotherapy). This was done to control for potential baseline characteristics that may have influenced the end point. The treatment effect was similar to and consistent with the primary analysis. Randomized controlled trials included
in the network meta-analyses are available in Table S1.
Abbreviations: PFS, progression-free survival; OS, overall survival; HR, hazard ratios; CIs, credible intervals; BSC, best supportive care.
ClinicoEconomics and Outcomes Research downloaded from https://www.dovepress.com/ by 118.70.13.36 on 21-Aug-2020
Dovepress Cost-effectiveness analysis of induction + maintenance in nsqNSCLC
effect observed in the JMEN trial10 was used if pemetrexed
maintenance followed any nonpemetrexed induction.
Assumptions of the model
For standard doublet–maintenance sequences, the induction period for patients allocated to pemetrexed maintenance was assumed to be four cycles (as in the Phase III pemetrexed maintenance trials).9,10 For patients allocated to BSC
main-tenance, the duration of induction was assumed to be the number of cycles (mean/median) used in the largest avail-able study for the relevant induction therapy (to reflect usual practice). For triplet sequences, the assumed induction period was four cycles, after which (if eligible) patients would be able to continue receiving the maintenance component of the therapy (ie, bevacizumab).
In addition, patients receiving maintenance therapy were assumed to have received treatment from the end of induction until either disease progression or treatment being discontin-ued for other reasons. Information on treatment discontinu-ation for other reasons was estimated using data from the PARAMOUNT trial (pemetrexed group)9 and applied to all
maintenance therapies.
Statistical analysis for effectiveness
outcomes
Baseline-risk estimates based on the reanalysis of JMDB trial data were determined using Kaplan–Meier survival curves for the within-study period and parametric survival models for the poststudy period. Survival curves were estimated separately for patients who were eligible for maintenance and those who were not. Results from fixed-effect NMAs (which provided the best model fit compared with random-effect models in all cases, as identified using the deviance information criterion)29
were applied to the risk estimates to generate relative effec-tiveness. Weibull, exponential, log-normal, and log-logistic parametric curves were fitted to the survival data. A “goodness of fit” measure (Akaike information criterion score)30 was
used to identify the best-fitting distribution for all analyses.31
A visual assessment of the fitted curves was also carried out to evaluate the plausibility of the extrapolations generated.
Utilities
In the base case, French-specific EQ-5D utility scores, cal-culated from data collected during the PARAMOUNT trial32
and weighted for the French population,33 were chosen for
health states and allocated according to a patient’s proxim-ity to death (stratified according to the number of treatment
cycles [21 days] a patient was from dying) and progression status. The PARAMOUNT trial randomized patients with advanced nonsquamous NSCLC whose disease had not progressed after four 21-day cycles of pemetrexed–cisplatin and who had an ECOG performance status of 0 or 1.
Costs
Costs were calculated from the payer perspective (National Health Insurance), and were updated to December 2015 euros. Costs included in the model and the sources of these costs are presented in Table 4.
Drug costs
Acquisition–administration costs of induction therapy were assigned to patients eligible for maintenance treatment who received active therapy. For all patients who received BSC after induction, acquisition–administration costs of induction therapy were applied for the mean/median length of treat-ment in the largest available trial, regardless of progression. Drug regimens, cycle lengths, and mean/median numbers of cycles were obtained from drug licenses or from the largest trial identified in the systematic review if the drug did not have a current license in the indication of interest (for details, see Table S2).
Drug costs per patient were calculated assuming that excess medication in a single vial was not reused (wast-age); such a strategy results in accrual of excess charges. A sensitivity analysis was modeled to allow for only the actual amount of drug administered to reflect a more efficient use of medication without wastage.
Hospitalization and other costs
Probabilities of pre- and postprogression hospitalization were derived using data from the PARAMOUNT trial (BSC group).9 Hospitalization costs were accrued per event, and
not per days spent in hospital (Table 4).
A terminal-care cost (allocated when a patient dies in hospital) was based on data on lung cancer-associated stays in palliative care in French public hospitals (Table 4). The proportion of patients who died in hospital was taken from Sesé et al22 (set at 70.6% in the base case). Follow-up
care costs, based on standard follow-up procedures, were estimated using Caisse Nationale d’Assurance Maladie and Caisse Nationale de l’Assurance Maladie des Travail-leurs Salariés data (Table 4).35 Base-case radiotherapy costs
comprised the cost of a single session, including preparation and delivery.
ClinicoEconomics and Outcomes Research downloaded from https://www.dovepress.com/ by 118.70.13.36 on 21-Aug-2020
Dovepress Taipale et al
Second-line therapy costs
A proportion of patients who progress while receiving mainte-nance therapy will receive docetaxel, erlotinib, gemcitabine, or pemetrexed as second-line therapy. This proportion was esti-mated as 67% based on PARAMOUNT data.39 BSC costs are
included in diagnosis-related group costs, and so were set to zero.
Adverse-event costs
Adverse-event data were obtained from the largest trial identi-fied in the systematic review conducted for each treatment
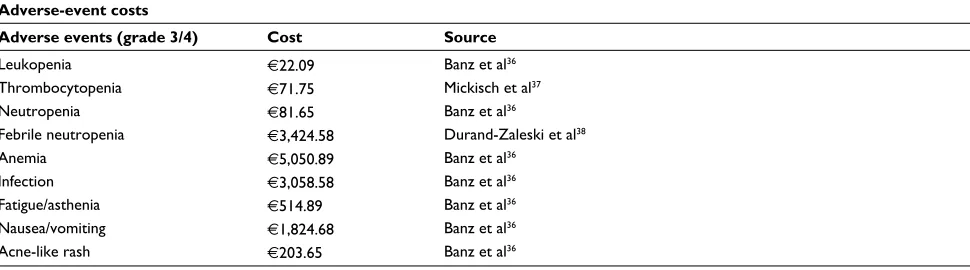
sequence. For an adverse event to be included in the model, it had to be grade 3/4 and to have occurred in at least 10% of the study population (Table 4).
Presentation of results
The term “dominated” was used to describe a treatment sequence if another sequence had lower costs and better/ equivalent outcomes. A treatment sequence was described as “extendedly dominated” when the comparator had a higher incremental cost-effectiveness ratio (ICER) than a more Table 4 Summary of costs included in the model
Drug acquisition and administration costs
Drug Unit size (mg) Price per unit Administration cost‡
Pemetrexed* 500 €1,047.55# €354.27
Docetaxel* 160 § €394.27
Gemcitabine* 1,000 § €788.54
Vinorelbine* 50 § €788.54
Bevacizumab* 400 €932.94# €354.27
Carboplatin 600 § €394.27
Paclitaxel 300 § €394.27
Notes: *Drugs for which drug wastage was included; #data from the French Health Insurance document on drug base and pricing information;34‡data from Diagnosis-Related
Group (DRG) code GHS-NRO 9606;34 §included in the DRG.
Hospitalization and other costs
Description Cost Source
Cost per hospitalization* €2,288.08 04M091 DRG cost34
Terminal care# €4,870 GHM 23Z02Z and 23Z02T (2013 cost inflated to 2015 using INSEE consumer
price index)34
Follow-up care#,§ €158.10 Caisse Nationale d’Assurance Maladie (CNAM) and Caisse Nationale de
l’Assurance Maladie des Travailleurs Salariés (CNAMTS) 201535
Radiotherapy delivery‡ €135.88 GHM28Z23Z34
Radiotherapy preparation‡ €170 GHM28Z24Z34
Notes: *Based on a single respiratory neoplasm-related stay; #base case; ‡sensitivity analysis; §including cost of one consultation, one full-body computed tomography scan,
and one standard biological test once every two cycles.
Second-line therapy costs
Second-line therapy Time on therapy Dose Doses per cycle Administration costs
per 21-day cycle§
Docetaxel 68.46 days* 75 mg/m2# 1# €394.27
Erlotinib 110.28 days* 150 mg/m2# 21# €0
Gemcitabine 63 days‡ 1,200 mg/m2# 3# €788.54
Pemetrexed 63 days‡ 500 mg/m2# 1# €354.27
Notes: *Derived from PARAMOUNT data9; #PARAMOUNT protocol regimen; ‡assumption based on expert clinical opinion (CC); §data from DRG code GHS-NRO 9606.34
Adverse-event costs
Adverse events (grade 3/4) Cost Source
Leukopenia €22.09 Banz et al36
Thrombocytopenia €71.75 Mickisch et al37
Neutropenia €81.65 Banz et al36
Febrile neutropenia €3,424.58 Durand-Zaleski et al38
Anemia €5,050.89 Banz et al36
Infection €3,058.58 Banz et al36
Fatigue/asthenia €514.89 Banz et al36
Nausea/vomiting €1,824.68 Banz et al36
Acne-like rash €203.65 Banz et al36
ClinicoEconomics and Outcomes Research downloaded from https://www.dovepress.com/ by 118.70.13.36 on 21-Aug-2020
Dovepress Cost-effectiveness analysis of induction + maintenance in nsqNSCLC
effective comparator. As treatment sequences that are “domi-nated” or “extendedly domi“domi-nated” do not represent value for money, they were removed from model analyses, in line with international standards for the conduct of cost-effectiveness analyses.23 All other treatment sequences provided an ICER
compared with the next-best option.
Sensitivity analyses
A number of one-way sensitivity analyses were conducted with the aim of addressing uncertainty in the model (see Table 2). These included keeping the baseline-risk parametric function as Weibull (as in the base case) for OS, but changing it to log-logistic for PFS, and modifying the baseline-risk parametric functions from Weibull to log-logistic for both OS and PFS; using a pooled HR for the treatment effect of pemetrexed-maintenance therapy obtained from NMAs (rather than basing this on PARAMOUNT or JMEN study data); use of data from Nafees et al21 to estimate utilities for
the health states, rather than PARAMOUNT EQ-5D utility scores; excluding vial wastage; switching off the treatment effect at 32 months for induction and 34 months for mainte-nance (the follow-up period for JMDB and the 2012 data-lock follow-up period for PARAMOUNT, respectively).
A probabilistic sensitivity analysis was performed to estimate the level of confidence in the model findings that the treatment selected was cost-effective based on the expected values. Appropriate distributions were allocated to all model inputs, 1,000 simulations were run, and results were plotted as a cost-effectiveness acceptability frontier.40,41
Results
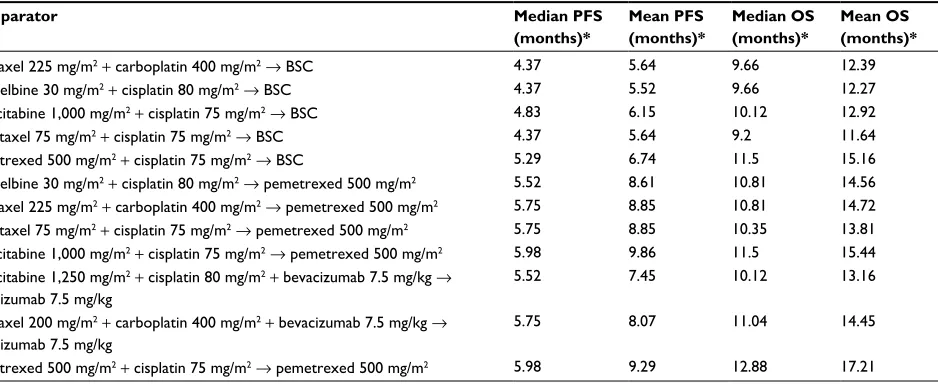
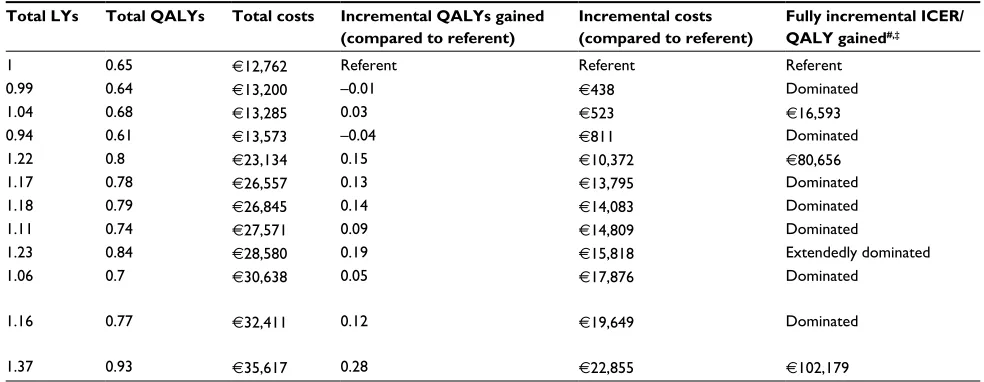
In the base-case model, the comparator associated with the longest median OS (12.88 months) and PFS (5.98 months) was pemetrexed + cisplatin → pemetrexed (Table 5). This regimen was also associated with the largest gains in LYs and QALYs. PFS and LYs and QALYs gained were greater for all comparators when pemetrexed was used as maintenance rather than BSC.
Base-case costs for the 12 induction–maintenance sequences analyzed in the model ranged from €12,762 (pacli-taxel + carboplatin → BSC) to €35,617 (pemetrexed + cispla-tin → pemetrexed) (Table 5); a breakdown of costs for each sequence investigated is provided in Table 6. The least costly treatment sequences used BSC as the maintenance treatment. Conversely, the two bevacizumab regimens and the pemetrexed
+ cisplatin → pemetrexed sequence were the most expensive. Cost-effectiveness analysis found pemetrexed + cisplatin
→ pemetrexed to be associated with the highest incremental
gain in QALYs of all the comparators investigated compared with paclitaxel + carboplatin → BSC (the sequence with the lowest cost per QALY in the model) (Table 5). Only three treatment sequences were not dominated or extendedly dominated in the model: gemcitabine + cisplatin → BSC, pemetrexed + cisplatin → BSC, and pemetrexed + cisplatin
→ pemetrexed. The respective ICER values for these three sequences were €16,593, €80,656, and €102,179 per QALY gained.
Sensitivity analyses
Scenarios that had the greatest impact on the results are shown in Table 7. The ICER for pemetrexed + cisplatin →
pemetrexed increased from €102,179 per QALY gained (when applying a Weibull distribution to the baseline PFS data) to €108,845 per QALY gained (when the baseline PFS was instead modeled using a log-logistic function). When a log-logistic function to model both OS and PFS was used, the ICER fell to €52,129 per QALY gained. A review of the extrapolation, however, showed that this approach may not reflect clinically observed disease progression, given that the long OS-curve tails indicated improbable survival duration in this rapidly progressing NSCLC setting.
The use of utility data from Nafees et al21 resulted in
a lower baseline quality of life compared with the PARA-MOUNT trial-based EQ-5D, and thus any extensions to life were downweighted in this scenario. The effect of this was to increase the ICERs of all the comparators analyzed. Similar findings were also seen when the treatment effects of maintenance therapy were switched off. Another one-way sensitivity analysis was conducted under the assumption that the induction-treatment effect was reduced by half among treatment-ineligible patients. The intent was to account for the reduced use of treatment in these patients, and this analysis resulted in decreased ICERs for all the compara-tors analyzed.
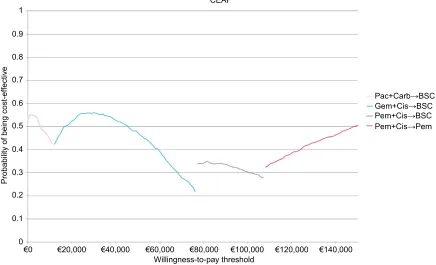
The results of the probabilistic sensitivity analyses are illustrated in Figure 1. The cost-effectiveness acceptabil-ity frontier following a rerun of the analyses omitting the carboplatin-based regimens is shown in Figure S1 (for details of the regimens, see Table S2). Several treatment sequences were dominated or extendedly dominated in all sensitiv-ity analyses: vinorelbine + cisplatin → BSC; docetaxel +
cisplatin → BSC; vinorelbine + cisplatin → pemetrexed; paclitaxel + carboplatin → pemetrexed; docetaxel + cisplatin
→ pemetrexed; gemcitabine + cisplatin + bevacizumab →
bevacizumab; paclitaxel + carboplatin + bevacizumab →
bevacizumab.
ClinicoEconomics and Outcomes Research downloaded from https://www.dovepress.com/ by 118.70.13.36 on 21-Aug-2020
Dovepress Taipale et al
Discussion
Of the 12 induction–maintenance treatment sequences rel-evant to the treatment of patients with nonsquamous NSCLC in France analyzed, pemetrexed + cisplatin → pemetrexed was shown to have the most favorable clinical efficacy (longest median PFS and OS and most LYs and QALYs gained). This is an important finding in view of the lack of direct trial evidence available for induction–maintenance treatment sequences and the unlikelihood that such studies will be conducted. As expected, comparators using BSC as maintenance were the least costly, but were also associated with lower PFS and OS. The highest costs were reported for the two bevacizumab-triplet sequences and the pemetrexed +
cisplatin → pemetrexed sequence. Uncertainty in the model was addressed using extensive sensitivity analyses performed on key assumptions. These showed the model to be relatively insensitive to plausible changes in the main assumptions.
In the cost-effectiveness analysis, eight of the 12 treat-ment sequences investigated were either dominated or extendedly dominated in the model, and thus did not provide sufficient value for further consideration. Only three treat-ment sequences were not dominated or extendedly dominated in the model: gemcitabine + cisplatin → BSC, pemetrexed +
cisplatin → BSC, and pemetrexed + cisplatin → pemetrexed. A number of studies have assessed the cost-effectiveness of either induction or maintenance regimens for the treat-ment of NSCLC, but studies assessing complete induction– maintenance treatment sequences are few. Two studies,17,18
utilizing the same efficacy and cost-effectiveness model as in
the current study, but adapted for use in different health-care settings, also found a pemetrexed + cisplatin → pemetrexed regimen to be among the most cost-effective induction– maintenance treatment sequences used for the management of patients with NSCLC in those settings. Results from a US-based analysis in patients with nonsquamous NSCLC showed the following four induction–maintenance treat-ment sequences to have value with regard to care costs and survival outcomes: pemetrexed + cisplatin → pemetrexed, gemcitabine + cisplatin → BSC (the referent), gemcitabine
+ cisplatin → erlotinib, and pemetrexed + cisplatin →
BSC.18 Similar analyses adapted to the Swedish health-care
system showed pemetrexed + cisplatin → pemetrexed to offer improved PFS, OS, and QALYs and to be more cost-effective than gemcitabine + cisplatin → bevacizumab 7.5 mg/kg or gemcitabine + cisplatin → bevacizumab 15 mg/kg.17
In this Swedish study, the higher costs associated with pemetrexed + cisplatin → pemetrexed (compared with the two comparator bevacizumab regimens) were attributed to the better clinical efficacy of pemetrexed: increases in PFS resulted in longer treatment with maintenance therapy and its associated costs, and prolonged OS resulted in higher follow-up care and second-line therapy costs.
Several studies have estimated the cost-effectiveness of therapies for the first-line induction, maintenance, or combined first-line induction plus maintenance of patients with nonsquamous NSCLC; however, comparisons across studies are necessarily hindered by differences in meth-odology, study quality, reporting, year study conducted, Table 5 Clinical effectiveness and cost-effectiveness of first-line induction–maintenance regimens included in the model
Comparator Median PFS
(months)*
Mean PFS (months)*
Median OS (months)*
Mean OS (months)*
Total LYs Total QALYs Total costs Incremental QALYs gained
(compared to referent)
Incremental costs (compared to referent)
Fully incremental ICER/ QALY gained#,‡
Paclitaxel 225 mg/m2 + carboplatin 400 mg/m2 → BSC 4.37 5.64 9.66 12.39 1 0.65 €12,762 Referent Referent Referent
Vinorelbine 30 mg/m2 + cisplatin 80 mg/m2 → BSC 4.37 5.52 9.66 12.27 0.99 0.64 €13,200 –0.01 €438 Dominated
Gemcitabine 1,000 mg/m2 + cisplatin 75 mg/m2 → BSC 4.83 6.15 10.12 12.92 1.04 0.68 €13,285 0.03 €523 €16,593
Docetaxel 75 mg/m2 + cisplatin 75 mg/m2 → BSC 4.37 5.64 9.2 11.64 0.94 0.61 €13,573 –0.04 €811 Dominated
Pemetrexed 500 mg/m2 + cisplatin 75 mg/m2 → BSC 5.29 6.74 11.5 15.16 1.22 0.8 €23,134 0.15 €10,372 €80,656
Vinorelbine 30 mg/m2 + cisplatin 80 mg/m2 → pemetrexed 500 mg/m2 5.52 8.61 10.81 14.56 1.17 0.78 €26,557 0.13 €13,795 Dominated
Paclitaxel 225 mg/m2 + carboplatin 400 mg/m2 → pemetrexed 500 mg/m2 5.75 8.85 10.81 14.72 1.18 0.79 €26,845 0.14 €14,083 Dominated
Docetaxel 75 mg/m2 + cisplatin 75 mg/m2 → pemetrexed 500 mg/m2 5.75 8.85 10.35 13.81 1.11 0.74 €27,571 0.09 €14,809 Dominated
Gemcitabine 1,000 mg/m2 + cisplatin 75 mg/m2 → pemetrexed 500 mg/m2 5.98 9.86 11.5 15.44 1.23 0.84 €28,580 0.19 €15,818 Extendedly dominated
Gemcitabine 1,250 mg/m2 + cisplatin 80 mg/m2 + bevacizumab 7.5 mg/kg →
bevacizumab 7.5 mg/kg
5.52 7.45 10.12 13.16 1.06 0.7 €30,638 0.05 €17,876 Dominated
Paclitaxel 200 mg/m2 + carboplatin 400 mg/m2 + bevacizumab 7.5 mg/kg →
bevacizumab 7.5 mg/kg
5.75 8.07 11.04 14.45 1.16 0.77 €32,411 0.12 €19,649 Dominated
Pemetrexed 500 mg/m2 + cisplatin 75 mg/m2 → pemetrexed 500 mg/m2 5.98 9.29 12.88 17.21 1.37 0.93 €35,617 0.28 €22,855 €102,179
Notes: *Rounded to the nearest week (0.23 months), due to a cycle length of 1 week; #fully incremental analysis conducted by comparing regimens to the next most
cost-effective option; ‡due to the rounding of these values, it may not be possible to precisely recreate these results.
Abbreviations: BSC, best supportive care; ICER, incremental cost-effectiveness ratio; LYs, life-years; OS, overall survival; PFS, progression-free survival; QALY, quality-adjusted LYs.
(Continued)
ClinicoEconomics and Outcomes Research downloaded from https://www.dovepress.com/ by 118.70.13.36 on 21-Aug-2020
Dovepress Cost-effectiveness analysis of induction + maintenance in nsqNSCLC
currency, health-care systems, and study perspectives.42–44
Bongers et al42 reported that gemcitabine + cisplatin was a
cost-effective first-line induction treatment option in patients with advanced NSCLC compared with paclitaxel + cisplatin, but that pemetrexed + cisplatin appeared more cost-effective in patients with nonsquamous histology. The pemetrexed +
cisplatin doublet has also been reported to be cost-saving compared with other platinum doublets as first-line induc-tion therapy in patients with advanced NSCLC, particularly those with nonsquamous histology.43 In this patient group, the
incremental costs per LY gained were US$83,537, $178,613, and more than $300,000 for pemetrexed + cisplatin compared with, respectively, gemcitabine + cisplatin, paclitaxel + car-boplatin, and paclitaxel + carboplatin + bevacizumab. A UK health-technology assessment published in 2013, focusing on first-line chemotherapy options licensed in Europe and recommended by the National Institute for Health and Care Excellence, reported that pemetrexed + cisplatin improved OS to a greater extent than all other recommended treatments in patients with advanced or metastatic nonsquamous disease. Pemetrexed + cisplatin was considered cost-effective in the UK (versus gemcitabine + cisplatin) at a cost-effectiveness threshold of £35,000/QALY gained.44
With regard to maintenance therapy, histology was identi-fied by Bongers et al42 as an important factor when choosing
the most appropriate treatment in patients with advanced NSCLC. In their review, the incremental cost per LY gained with pemetrexed maintenance (versus observation) was mark-edly lower in nonsquamous patients than in the total study
population ($122,371 versus $205,597 [2009 values]). In a review by Chouaïd et al;43 however, the authors reported that
with the exception of one study,45 all studies included in the
review indicated that maintenance pemetrexed was not cost-effective, as judged from the perspective of their individual health-care settings.
If no active treatment had been an appropriate first-line and maintenance-treatment option for patients able to receive chemotherapy, it is possible that the referent regimen (paclitaxel + carboplatin → BSC) may have demonstrated value in the model. We were unable to identify any studies evaluating the cost-effectiveness of paclitaxel + carboplatin
→ BSC in NSCLC, but the incremental cost per LY gained was reported to be $178,613 for pemetrexed + cisplatin compared with paclitaxel + carboplatin in patients with nonsquamous NSCLC in one systematic review.43 Previous
cost-effectiveness analyses of platinum-doublet induction therapy have reported cisplatin-based doublets to be generally less costly than those containing carboplatin.43,44
Strengths/limitations of study
This is the first study to investigate the cost-effectiveness of a wide range of NSCLC induction–maintenance treat-ment sequences relevant to the French health-care setting. We included RCT data for each induction or maintenance sequence to the fullest extent possible. Nonetheless, it was necessary to populate the model with out-of-trial data, including French costs, tariffs, and resource-use data, thus reflecting the local health-care system. Despite having relied Table 5 Clinical effectiveness and cost-effectiveness of first-line induction–maintenance regimens included in the model
Comparator Median PFS
(months)*
Mean PFS (months)*
Median OS (months)*
Mean OS (months)*
Total LYs Total QALYs Total costs Incremental QALYs gained
(compared to referent)
Incremental costs (compared to referent)
Fully incremental ICER/ QALY gained#,‡
Paclitaxel 225 mg/m2 + carboplatin 400 mg/m2 → BSC 4.37 5.64 9.66 12.39 1 0.65 €12,762 Referent Referent Referent
Vinorelbine 30 mg/m2 + cisplatin 80 mg/m2 → BSC 4.37 5.52 9.66 12.27 0.99 0.64 €13,200 –0.01 €438 Dominated
Gemcitabine 1,000 mg/m2 + cisplatin 75 mg/m2 → BSC 4.83 6.15 10.12 12.92 1.04 0.68 €13,285 0.03 €523 €16,593
Docetaxel 75 mg/m2 + cisplatin 75 mg/m2 → BSC 4.37 5.64 9.2 11.64 0.94 0.61 €13,573 –0.04 €811 Dominated
Pemetrexed 500 mg/m2 + cisplatin 75 mg/m2 → BSC 5.29 6.74 11.5 15.16 1.22 0.8 €23,134 0.15 €10,372 €80,656
Vinorelbine 30 mg/m2 + cisplatin 80 mg/m2 → pemetrexed 500 mg/m2 5.52 8.61 10.81 14.56 1.17 0.78 €26,557 0.13 €13,795 Dominated
Paclitaxel 225 mg/m2 + carboplatin 400 mg/m2 → pemetrexed 500 mg/m2 5.75 8.85 10.81 14.72 1.18 0.79 €26,845 0.14 €14,083 Dominated
Docetaxel 75 mg/m2 + cisplatin 75 mg/m2 → pemetrexed 500 mg/m2 5.75 8.85 10.35 13.81 1.11 0.74 €27,571 0.09 €14,809 Dominated
Gemcitabine 1,000 mg/m2 + cisplatin 75 mg/m2 → pemetrexed 500 mg/m2 5.98 9.86 11.5 15.44 1.23 0.84 €28,580 0.19 €15,818 Extendedly dominated
Gemcitabine 1,250 mg/m2 + cisplatin 80 mg/m2 + bevacizumab 7.5 mg/kg →
bevacizumab 7.5 mg/kg
5.52 7.45 10.12 13.16 1.06 0.7 €30,638 0.05 €17,876 Dominated
Paclitaxel 200 mg/m2 + carboplatin 400 mg/m2 + bevacizumab 7.5 mg/kg →
bevacizumab 7.5 mg/kg
5.75 8.07 11.04 14.45 1.16 0.77 €32,411 0.12 €19,649 Dominated
Pemetrexed 500 mg/m2 + cisplatin 75 mg/m2 → pemetrexed 500 mg/m2 5.98 9.29 12.88 17.21 1.37 0.93 €35,617 0.28 €22,855 €102,179
Notes: *Rounded to the nearest week (0.23 months), due to a cycle length of 1 week; #fully incremental analysis conducted by comparing regimens to the next most
cost-effective option; ‡due to the rounding of these values, it may not be possible to precisely recreate these results.
Abbreviations: BSC, best supportive care; ICER, incremental cost-effectiveness ratio; LYs, life-years; OS, overall survival; PFS, progression-free survival; QALY, quality-adjusted LYs.
ClinicoEconomics and Outcomes Research downloaded from https://www.dovepress.com/ by 118.70.13.36 on 21-Aug-2020
Dovepress Taipale et al
on RCT data and making numerous assumptions in build-ing our model, this local adaptation should provide useful information relevant to the French practice setting.
Our findings are largely supported by the results of sensitiv-ity analyses. Exceptions included the use of utilsensitiv-ity data from Nafees et al21 and the turning off of
induction/maintenance-treatment effects. Aside from one scenario that was considered likely to be implausible (changing the method of extrapolation for OS), none of the analyses increased or decreased the ICER by more than ~€20,000 per QALY gained.
The study was designed and conducted in line with guidelines from the French National Authority for Health regarding the methodology for economic evaluations23
and the International Society for Pharmacoeconomics and Outcomes Research.46 The analysis was conducted from the
payer perspective (National Healthcare Insurance), including only direct costs.
A major strength of the study is that the model used is structured to assess the cost-effectiveness of induction– maintenance treatment sequences as a whole rather than separately. Studies that assess the cost-effectiveness of maintenance therapy only are limited in that they do not take into consideration premaintenance induction effects. The only previous studies assessing the cost-effectiveness of induction and maintenance sequences that we identified were the aforementioned two, which utilized the same cost-effectiveness model as in the current study adapted for use in different health-care settings.17,18
In line with Haute Autorité de Santé guidelines regarding the methodology for economic evaluations,23 this analysis included
both cisplatin-based induction–maintenance sequences, as recommended in French guidelines, and carboplatin- based regimens, which have not yet obtained marketing authoriza-tion, but which are used regularly in daily practice. Rerunning the analysis excluding carboplatin-based regimens resulted in vinorelbine + cisplatin → BSC as the referent (see Table S3), and the conclusion of the cost-effectiveness model did not change: gemcitabine + cisplatin → BSC, pemetrexed + cisplatin
→ BSC, and pemetrexed + cisplatin → pemetrexed were the only comparators to produce positive ICERs. ICERs identical to those in the initial model were obtained for the pemetrexed +
cisplatin → BSC (€80,656 per QALY gained) and pemetrexed
+ cisplatin → pemetrexed regimens (€102,179 per QALY gained), whereas the ICER for gemcitabine + cisplatin → BSC fell to €2,120 per QALY gained.
Although use of RCT data in cost-effectiveness analyses is associated with both strengths and limitations,47 RCTs
provide accurate estimates of survival, with few missing
Table 6
Costs of treatment
Comparator
Acquisition induction Administration induction Acquisition maintenance Administration maintenance Long-term follow-up* Adverse events
†
Second-line therapy
Total
Paclitaxel 225 mg/m
2+
carboplatin 400 mg/m
2→ BSC – € 1,571 – – € 4,759 € 2,063 € 4,369 € 12,762
Vinorelbine 30 mg/m
2+
cisplatin 80 mg/m
2→ BSC – € 1,571 – – € 4,746 € 2,395 € 4,488 € 13,200
Gemcitabine 1,000 mg/m
2+
cisplatin 75 mg/m
2→ BSC – € 1,961 – – € 4,817 € 2,028 € 4,479 € 13,285
Docetaxel 75 mg/m
2+
cisplatin 75 mg/m
2→ BSC – € 1,961 – – € 4,687 € 2,193 € 4,732 € 13,573
Pemetrexed 500 mg/m
2+
cisplatin 75 mg/m
2→ BSC € 9,978 € 1,762 – – € 5,041 € 2,228 € 4,125 € 23,134
Vinorelbine 30 mg/m
2+
cisplatin 80 mg/m
2→
pemetrexed 500 mg/m
2 – € 1,378 € 11,575 € 2,044 € 5,007 € 2,703 € 3,851 € 26,557
Paclitaxel 225 mg/m
2+
carboplatin 400 mg/m
2→
pemetrexed 500 mg/m
2 – € 1,383 € 11,957 € 2,112 € 5,026 € 2,374 € 3,994 € 26,845
Docetaxel 75 mg/m
2+
cisplatin 75 mg/m
2→
pemetrexed 500 mg/m
2 – € 1,382 € 11,951 € 2,111 € 4,939 € 2,481 € 4,707 € 27,571
Gemcitabine 1,000 mg/m
2+
cisplatin 75 mg/m
2→
pemetrexed 500 mg/m
2 – € 1,400 € 13,500 € 2,384 € 5,108 € 2,357 € 3,832 € 28,580
Gemcitabine 1,250 mg/m
2+
cisplatin 80 mg/m
2+
bevacizumab 7.5 mg/kg
→
bevacizumab 7.5 mg/kg
€ 7,772 € 1,557 € 7,700 € 1,543 € 4,859 € 2,981 € 4,225 € 30,638
Paclitaxel 200 mg/m
2+
carboplatin 400 mg/m
2+
bevacizumab 7.5 mg/kg
→
bevacizumab 7.5 mg/kg
€ 9,143 € 1,832 € 7,746 € 1,552 € 4,992 € 2,815 € 4,331 € 32,411
Pemetrexed 500 mg/m
2+
cisplatin 75 mg/m
2→
pemetrexed 500 mg/m
2 € 7,202 € 1,272 € 12,709 € 2,244 € 5,268 € 2,556 € 4,366 € 35,617 Notes:
*Includes best supportive care (BSC),
computed
tomography
scan, consultant, terminal care, follow-up care, and
concomitant radiotherapy
costs
preprogression;
†includes adverse events and hospitalizations. ‘–’
indicates not
applicable.
ClinicoEconomics and Outcomes Research downloaded from https://www.dovepress.com/ by 118.70.13.36 on 21-Aug-2020
Dovepress Cost-effectiveness analysis of induction + maintenance in nsqNSCLC
Table 7
Sensitivity analyses with the greatest impact on results
Comparators
Weibull OS, log-logistic PFS Log-logistic OS, log-logistic PFS Ineligible patients allowed to receive 50% of induction- treatment effect
Pooled
HR
for
pemetrexed maintenance No vial wastage
Nafees et al
21
utility data
Treatment effect turned off
Paclitaxel 225 mg/m
2+
carboplatin 400 mg/m
2→ BSC Referent Referent Referent Referent Referent Referent Referent
Vinorelbine 30 mg/m
2+
cisplatin 80 mg/m
2→ BSC Dominated Dominated Dominated Dominated Dominated Dominated Dominated
Gemcitabine 1,000 mg/m
2+
cisplatin 75 mg/m
2→ BSC € 15,619 € 11,029 € 12,730 € 16,593 € 16,602 € 19,194 € 16,931
Docetaxel 75 mg/m
2+
cisplatin 75 mg/m
2→ BSC Dominated Dominated Dominated Dominated Dominated Dominated Dominated
Pemetrexed 500 mg/m
2+
cisplatin 75 mg/m
2→
BSC
€
79,095
Extendedly dominated
€ 56,609 € 80,656 € 76,484
Extendedly dominated
€
85,662
Vinorelbine 30 mg/m
2+
cisplatin 80 mg/m
2→
pemetrexed 500 mg/m
2 Dominated Dominated Dominated Dominated Dominated Dominated Dominated
Paclitaxel 225 mg/m
2+
carboplatin 400 mg/m
2→
pemetrexed 500 mg/m
2
Dominated
Extendedly dominated
Dominated
Dominated
Dominated
Extendedly dominated
Dominated
Docetaxel 75 mg/m
2+
cisplatin 75 mg/m
2→
pemetrexed 500 mg/m
2 Dominated Dominated Dominated Dominated Dominated Dominated Dominated
Gemcitabine 1,000 mg/m
2+
cisplatin 75 mg/m
2→
pemetrexed 500 mg/m
2
Extendedly dominated Extendedly dominated
Dominated
Extendedly dominated Extendedly dominated
€
105,956
Extendedly dominated
Gemcitabine 1,250 mg/m
2+
cisplatin 80 mg/m
2+
bevacizumab 7.5 mg/kg
→
bevacizumab 7.5 mg/kg
Dominated Dominated Dominated Dominated Dominated Dominated Dominated
Paclitaxel 200 mg/m
2+
carboplatin 400 mg/m
2+
bevacizumab 7.5 mg/kg
→
bevacizumab 7.5 mg/kg
Dominated
Dominated
Extendedly dominated
Dominated
Dominated
Dominated
Dominated
Pemetrexed 500 mg/m
2+
cisplatin 75 mg/m
2→
pemetrexed 500 mg/m
2 € 108,845 € 52,129 € 80,155 € 89,983 € 96,442 € 122,005 € 118,930 Note:
Results showing values in Euros reflect incremental cost per quality-adjusted life-year gained.
Abbreviations:
BSC, best supportive care; HR, hazard ratio; OS, overall survival; PFS, progression-free survival.
ClinicoEconomics and Outcomes Research downloaded from https://www.dovepress.com/ by 118.70.13.36 on 21-Aug-2020
Dovepress Taipale et al
data, and have adequate power to prevent the emergence of spurious conclusions. The findings of the model could be applied to similar patient cohorts to ensure external validity.
Another limitation to the study is that protocol-driven resource-use requirements may differ from those used in local clinical practice. Additionally, due to the paucity of postdiscontinuation RCT resource-use data, out-of-trial estimates were required to populate the model. Therefore, any comparison of model-based costs with those observed in practice should be attempted with caution.
Conclusion
In the absence of direct comparative trial evidence, this robust cost-effectiveness analysis found pemetrexed + cisplatin →
pemetrexed to achieve the best clinical outcomes of 12 induc-tion–maintenance sequences used in the treatment of patients with nonsquamous NSCLC in the French health-care setting. The regimen also demonstrated value in the model when com-pared with other induction–maintenance treatment options.
Acknowledgments
The authors wish to acknowledge Dr Gillian Gummer and Greg Plosker (Rx Communications, Mold, UK) for medical writing assistance with the preparation of this article, funded
Figure 1 Cost-effectiveness acceptability frontier (CEAF).
Notes: The CEAF was created by running probabilistic sensitivity analyses, and shows the probability that the treatment selected on the basis of the expected values is cost-effective. For details of the regimens, refer to Table 1.
Abbreviations: BSC, best supportive care; Carb, carboplatin; Cis, cisplatin; Gem, gemcitabine; Pac, paclitaxel; Pem, pemetrexed.
€0 0 0.1 0.2 0.3 0.4 0.5 0.6 0.7 0.8 0.9 1
€20,000 €40,000 €60,000 €80,000
CEAF
Pac+Carb→BSC Gem+Cis→BSC Pem+Cis→BSC Pem+Cis→Pem
Willingness-to-pay threshold
Probability of being cost-effectiv
e
€100,000 €120,000 €140,000
by Eli Lilly and Company. We also acknowledge Beth Woods and Peter Bryden for the development of the global cost- effectiveness model on which this country adapted model was based.
Disclosure
KT, KBW, MB, and MB are employees of Eli Lilly and Com-pany. GS is a former employee of Eli Lilly and ComCom-pany. JE and RE are employees of ICON Plc, who were contracted by Lilly to perform this analysis. CC has received fees from Eli Lilly and Company for attending scientific meetings, speak-ing, organizing research, or consulting. The authors report no other conflicts of interest in this work.
References
1. Ferlay J, Steliarova-Foucher E, Lortet-Tieulent J, et al. Cancer incidence and mortality patterns in Europe: estimates for 40 countries in 2012.
Eur J Cancer. 2013;49(6):1374–1403.
2. Tomasini P, Berlesi F, Mascaux, Gerillier L. Pemetrexed for advanced stage nonsquamous non-small cell lung cancer: latest evidence about its extended use and outcomes. Ther Adv Med Oncol. 2016;8(3):198–208. 3. National Comprehensive Cancer Network. Non–Small Cell Lung
Cancer. Version 5. 2017. Available from: www.nccn.org/professionals/ physician_gls/pdf/nscl_blocks.pdf. Accessed April 17, 2017. 4. Novello S, Barlesi F, Califano R, et al. Metastatic non-small-cell lung
cancer: ESMO clinical practice guidelines for diagnosis, treatment and follow-up. Ann Oncol. 2016;27 Suppl 5:v1–v27.
ClinicoEconomics and Outcomes Research downloaded from https://www.dovepress.com/ by 118.70.13.36 on 21-Aug-2020
Dovepress Cost-effectiveness analysis of induction + maintenance in nsqNSCLC 5. Masters GA, Temin S, Azzoli CG, et al. Systemic therapy for stage
IV non-small-cell lung cancer: American Society of Oncology clinical practice guidelines update. J Clin Oncol. 2015;33(30): 3488–3515.
6. Haute Autorité de Santé. Alimta (pemetrexed), antimetabolite. 2016. Avalable from: https://www.has-sante.fr/portail/jcms/c_2628546/fr/ alimta-mesotheliome. Accessed May 21, 2017.
7. Alimta 100/500 mg [summary of product characteristics]. 2009. Avail-able from: http://www.ema.europa.eu/docs/en_GB/document_library/ EPAR_-_Product_Information/human/000564/WC500025611.pdf. Accessed April 21, 2017.
8. Scagliotti GV, Parikh P, von Pawel J, et al. Phase III study compar-ing cisplatin plus gemcitabine with cisplatin plus pemetrexed in chemotherapy-naive patients with advanced-stage non-small-cell lung cancer. J Clin Oncol. 2008;26(21):3543–3551.
9. Paz-Ares L, de Marinis F, Dediu M, et al. Maintenance therapy with pemetrexed plus best supportive care versus placebo plus best sup-portive care after induction therapy with pemetrexed plus cisplatin for advanced non-squamous non-small-cell lung cancer (PARAMOUNT): a double-blind, phase 3, randomised controlled trial. Lancet Oncol. 2012;13(3):247–255.
10. Ciuleanu T, Brodowicz T, Zielinski C, et al. Maintenance pemetrexed plus best supportive care versus placebo plus best supportive care for non-small-cell lung cancer: a randomised, double-blind, phase 3 study.
Lancet. 2009;374(9699):1432–1440.
11. Hanna N, Shephard FA, Fossella FV, et al. Randomized phase III trial of pemetrexed versus docetaxel in patients with non-small-cell lung cancer previously treated with chemotherapy. J Clin Oncol. 2004;22(9):1589–1597.
12. Cappuzzo F, Ciuleanu T, Stelmakh L, et al. Erlotinib as maintenance treatment in advanced, non-small-cell lung cancer: a multicen-tre, randomised, placebo-controlled phase 3 study. Lancet Oncol. 2010;11(6):521–529.
13. Brodowicz T, Krzakowski M, Zwitter M, et al. Cisplatin and gemcitabine first-line chemotherapy followed by maintenance gemcitabine or best supportive care in advanced non-small cell lung cancer: a phase III trial.
Lung Cancer. 2006;52(2):155–163.
14. Barlesi F, Scherpereel A, Rittmeyer A, et al. Randomized phase III trial of maintenance bevacizumab with or without pemetrexed after first-line induction with bevacizumab, cisplatin, and pemetrexed in advanced nonsquamous non-small-cell lung cancer: AVAPERL (MO22089).
J Clin Oncol. 2013;31(24):3004–3011.
15. Lopez-Chavez A, Young T, Fages S, et al. Bevacizumab maintenance in patients with advanced non-small-cell lung cancer, clinical patterns, and outcomes in the Eastern Cooperative Oncology Group 4599 study: results of an exploratory analysis. J Thorac Oncol. 2012;7(11):1707–1712. 16. Pérol M, Chouaid C, Pérol D, et al. Randomized, phase III study of
gemcitabine or erlotinib maintenance therapy versus observation, with predefined second-line treatment, after cisplatin-gemcitabine induction chemotherapy in advanced non-small-cell lung cancer. J Clin Oncol. 2012;30(28):3516–3524.
17. Bryden P, Kumar G, Winfree KB, et al. A cost-effectiveness analysis of cisplatin plus pemetrexed doublet induction treatment followed by pemetrexed maintenance compared with bevacizumab plus cisplatin plus gemcitabine triplet induction treatment followed by bevacizumab maintenance for non-squamous NSCLC in Sweden. Poster presented at: ISPOR 16th Annual European Congress; November 2–6, 2013; Dublin, Ireland.
18. Kumar G, Woods B, Hess LM, et al. Cost-effectiveness of first-line induction and maintenance treatment sequences in non-squamous non-small cell lung cancer (NSCLC) in the U.S. Lung Cancer. 2015;89(3):294–300.
19. Institut National du Cancer [homepage on the Internet]. Available from: http://www.e-cancer.fr. Accessed June 14, 2016.
20. European Medicines Agency. Summary of opinion (post authorisation): Tarceva (erlotinib). 2015. Available from: http://www.ema.europa.eu/ docs/en_GB/document_library/Summary_of_opinion/human/000618/ WC500199001.pdf. Accessed June 14, 2016.
21. Nafees B, Stafford M, Gavriel S, Bhalla S, Watkins J. Health state utilities for non-small cell lung cancer. Health Qual Life Outcomes. 2008;6:84.
22. Sesé L, Didier M, Rousseau-Bussac G, Crequit P, Masanes MJ, Chouaid C. [Chemotherapy at the end of life for patients with lung cancer: a practice analysis]. Rev Mal Respir. 2015;32(3):256–261. French. 23. Haute Autorité de Santé. Choices in methods for economic evaluation.
2012. Available from: http://www.has-sante.fr/portail/upload/docs/ application/pdf/2012-10/choices_in_methods_for_economic_evalua-tion.pdf. Accessed June 14, 2016.
24. Woods BS, Hawkins N, Scott DA. Network meta-analysis on the log-hazard scale, combining count and log-hazard ratio statistics accounting for multi-arm trials: a tutorial. BMC Med Res Methodol. 2010;10:54. 25. Niho S, Kunitoh H, Nokihara H, et al. Randomized phase II study of
first-line carboplatin-paclitaxel with or without bevacizumab in Japanese patients with advanced non-squamous non-small-cell lung cancer. Lung Cancer. 2012;76(3):362–367.
26. Reck M, von Pawel J, Zatloukal P, et al. Overall survival with cisplatin-gemcitabine and bevacizumab or placebo as first-line therapy for nonsquamous non-small-cell lung cancer: results from a randomised phase III trial (AVAiL). Ann Oncol. 2010;21(9):1804–1809.
27. Sandler A, Gray R, Perry MC, et al. Paclitaxel-carboplatin alone or with bevacizumab for non-small-cell lung cancer. N Engl J Med. 2006;355(24):2542–2550.
28. Sandler A, Yi J, Dahlberg S, et al. Treatment outcomes by tumor histol-ogy in Eastern Cooperative Group study E4599 of bevacizumab with paclitaxel/carboplatin for advanced non-small cell lung cancer. J Thorac Oncol. 2010;5(9):1416–1423.
29. Spiegelhalter DJ, Best NG, Carlin BP, van der Linde A. Bayesian mea-sures of model complexity and fit. J R Stat Soc Series B Stat Methodol. 2002;64(4):583–639.
30. Akaike H. Akaike’s information criterion. 2014. Available from: http://link. springer.com/referenceworkentry/10.1007/978-3-642-04898-2_110. Accessed May 22, 2017.
31. Collett D. Modelling Survival Data in Medical Research. Boca Raton (FL): Chapman & Hall; 2003.
32. Gridelli C, de Marinis F, Pujol JL, et al. Safety, resource use, and quality of life in PARAMOUNT: a phase III study of maintenance pemetrexed versus placebo after induction pemetrexed plus cisplatin for advanced nonsquamous non-small-cell lung cancer. J Thorac Oncol. 2012;7(11):1713–1721.
33. Chevalier J, de Pouvourville G. Valuing EQ-5D using time trade-off in France. Eur J Health Econ. 2013;14(1):57–66.
34. L’Assurance-Maladie. Base des médicaments et informations tarifaires. 2015. [Health Insurance. Drug base and pricing information]. Available from: http://www.codage.ext.cnamts.fr/codif/bdm_it/. Accessed June 14, 2016. French.
35. Agence Technique de l’Information sur l’Hospitalisation. Tarifs MCO et HAD. 2015. [Technical Agency of Information on Hospitalization. MCO and HAD tariffs]. Available from: http://www.atih.sante.fr/tarifs-mco-et-had. Accessed June 14, 2016. French.
36. Banz K, Bischoff H, Brunner M, et al. Comparison of treatment costs of grade 3/4 adverse events associated with erlotinib or pemetrexed maintenance therapy for patients with advanced non-small-cell lung cancer (NSCLC) in Germany, France, Italy, and Spain. Lung Cancer. 2011;74(3):529–534.
37. Mickisch G, Gore M, Escudier B, Procopio G, Walzer S, Nuijten M. Costs of managing adverse events in the treatment of first-line metastatic renal cell carcinoma: bevacizumab in combination with interferon-α2a compared with sunitinib. Br J Cancer. 2010;102(1):80–86.
38. Durand-Zaleski L, Vainchtock A, Bogillot O. [Use of an administra-tive database to estimate the economic burden of febrile neutropenia].
J Econ Med. 2007;25:269–280. French.
39. Paz-Ares LG, de Marinis F, Dediu M, et al. PARAMOUNT: final overall survival results of the phase III study of maintenance pemetrexed versus placebo immediately after induction treatment with pemetrexed plus cisplatin for advanced nonsquamous non-small-cell lung cancer. J Clin Oncol. 2013;31(23):2895–2902.
ClinicoEconomics and Outcomes Research downloaded from https://www.dovepress.com/ by 118.70.13.36 on 21-Aug-2020
Dovepress
ClinicoEconomics and Outcomes Research
Publish your work in this journal
Submit your manuscript here: https://www.dovepress.com/clinicoeconomics-and-outcomes-research-journal ClinicoEconomics and Outcomes Research is an international,
peer-reviewed open-access journal focusing on health technology assess-ment, pharmacoeconomics and outcomes research in the areas of diagnosis, medical devices, and clinical, surgical and pharmacological intervention. The economic impact of health policy and health systems
organization also constitute important areas of coverage. The manu-script management system is completely online and includes a very quick and fair peer-review system, which is all easy to use. Visit http://www.dovepress.com/testimonials.php to read real quotes from published authors.
Dove
press
Taipale et al
40. Fenwick E, Claxton K, Sculpher M. Representing uncertainty: the role of cost-effectiveness acceptability curves. Health Econ. 2001;10(8):779–787.
41. Barton GR, Briggs AH, Fenwick EA. Optimal cost-effectiveness deci-sions: the role of the cost-effectiveness acceptability curve (CEAC), the cost-effectiveness acceptability frontier (CEAF), and the expected value of perfection information (EVPI). Value Health. 2008;11(5):886–897. 42. Bongers ML, Coupé VM, Jansma EP, Smit EF, Uyl-de Groot CA. Cost
effectiveness of treatment with new agents in advanced non-small-cell lung cancer: a systematic review. Pharmacoeconomics. 2012;30(1): 17–34.
43. Chouaïd C, Crequit P, Borfet I, Vergnenegre A. Economic evaluation of first-line and maintenance treatments for advanced non-small cell lung cancer: a systematic review. Clinicoecon Outcomes Res. 2014;7:9–15.
44. Brown T, Pilkington G, Bagust A, et al. Clinical effectiveness and cost-effectiveness of first-line chemotherapy for adult patients with locally advanced or metastatic non-small cell lung cancer: a systematic review and economic evaluation. Health Technol Assess. 2013;17(31):1–278. 45. Greenhalgh J, McLeod C, Bagust A, et al. Pemetrexed for the mainte-nance treatment of locally advanced or metastatic non-small cell lung cancer. Health Technol Assess. 2010;14 Suppl 2:33–39.
46. Caro JJ, Briggs AH, Siebert U, Kuntz KM. Modeling good research practices – overview: a report of the ISPOR-SMDM Modeling Good Research Practices Task Force-1. Value Health. 2012;15(6):796–803. 47. Ramsey S, Willke R, Briggs A, et al. Good research practices for
cost-effectiveness analysis alongside clinical trials: the ISPOR RCT-CEA Task Force report. Value Health. 2005;8(5):521–533.
ClinicoEconomics and Outcomes Research downloaded from https://www.dovepress.com/ by 118.70.13.36 on 21-Aug-2020