Prediction of Students Performance in
Semester Exams using a Naïve bayes Classifier
Humera Shaziya
1, Raniah Zaheer
2, G.Kavitha
3Assistant Professor, Dept of Computer Science, Nizam College, Hyderabad, TS, India1
Lecturer, Dept of Computer Science, Najran University, Najran, Saudi Arabia 2
Assistant Professor, Dept of Computer Science, Nizam College, Hyderabad, TS, India3
ABSTRACT: Educational data mining is an emerging trend, concerned with developing techniques for exploring, and analyzing the huge data that come from the educational context. EDM is poised to leverage an enormous amount of research from data mining community and apply that research to educational problems in learning, cognition and assessment. In recent years, Educational data mining has proven to be more successful at many of these educational statistics problems, due to enormous computing power and data mining algorithms. The main objective of higher education institutions is to provide quality education to its students. One way to achieve highest level of quality in higher education system is by discovering knowledge for prediction about students‟ performance. This study presents an approach to predict the performance of students in a semester exams. This approach is based on a Naive Bayes classifier. The objective is to know what grades students may obtain in their end semesters results. This helps the educational institute, teachers and students i.e., all the stakeholders involved in an education system. They can be benefitted from the prediction of students‟ results in multitude of ways. Students and teachers can take necessary actions to improve the results of those students whose result prediction is not satisfactory. A training dataset of students is taken to build the Naive Bayes model. The model is then applied on the test data to predict the end semester results of students. In this study, number of attributes is considered to predict the grade of a student.
KEYWORDS:Student performance, Naive Bayesian classifier, Educational data mining, Prediction.
I. INTRODUCTION
Classification is a data mining task that maps the data into predefined groups & classes. It is also called as supervised learning .It consists of two steps:
Model construction: It consists of set of predetermined classes. Each tuple/sample is assumed to belong to a predefined class. The set of tuple used for model construction is training set. The model is represented as classification rules, decision trees, or bayes model.
Model usage: This model is used for classifying future or unknown objects. The known label of test sample is compared with the classified result from the model. Accuracy rate is the percentage of test set samples that are correctly classified by the model. Test set is independent of training set, otherwise over-fitting will occur.
1.1 Prediction
Prediction is used to model continuous-valued functions, i.e., predicts unknown or missing values. In this model we deduce single aspect of data from some combination of other aspect of data. In educational data mining prediction can be used to detect student behaviour, predicting or understanding student educational outcomes.
1.2 Bayesian Classifier
1.3 Uses of Naive Bayes classification
Naive Bayes text classification: Naive Bayes classifiers are among the most successful known algorithms for learning to classify text documents.
Spam filtering: Spam filtering is the best known use of Naive Bayesian text classification. It makes use of a naive Bayes classifier to identify spam e-mail.
Hybrid Recommender System: Using Naive bayes classifier and collaborative filtering recommender systems apply machine learning and data mining techniques for filtering unseen information and can predict whether a user would like a given resource.
Online applications: This online application has been set up as a simple example of supervised machine learning and effective computing. Using a training set of examples which reflect nice, nasty or neutral sentiments, we're training data to distinguish between them.
1.4 Educational Data Mining
Educational Data Mining is an emerging discipline, concerned with developing methods for exploring the unique types of data that come from educational settings, and using those methods to better understand students, and the settings which they learn in. Data mining is extraction of interesting (non-trivial, implicit, previously unknown and potentially useful) patterns or knowledge from huge amount of data. As we know large amount of data is stored in educational database, so in order to get required data & to find the hidden relationship, different data mining techniques are developed & used. There are varieties of popular data mining task within the educational data mining e.g. classification, clustering, outlier detection, association rule, prediction etc. We can use the data mining in educational system as: predicting drop-out student, relationship between the student university entrance examination results & their success, predicting student's academic performance, discovery of strongly related subjects in the undergraduate syllabi, knowledge discovery on academic achievement, classification of students‟ performance in computer programming course according to learning style, investing the similarity & difference between colleges and schools.
EDM develops methods and applies techniques from statistics, machine learning, and data mining to analyse data collected during teaching and learning. EDM tests learning theories and informs educational practice.
1.5 Learning analytics applies techniques from information science, sociology, psychology, statistics, machine learning, and data mining to analyse data collected during education administration and services, teaching, and learning. Learning analytics creates applications that directly influence educational practice.
II. RELATEDWORK
Similar work was carried out in [2] from which the dataset for the present work has been obtained. The authors took a sample data set of MCA students and predicted end semester grades by using decision tree classifying technique. They considered number of attributes for predicting the students‟ results like students performance in seminar, attendance, lab work and so on.
Another study of predicting the performance of students on educational web based system was done in [4] in which data mining techniques were applied on the vast amount of data on user patterns collected during the interaction of students with the web based education system. The approach followed is to analyse the logged data of students and then classify students based on the data and predict the final grade of the students, the authors have used multiple classifiers and applied genetic algorithm to improve the accuracy of the prediction.
In a study of advanced programming course in an institute of higher learning in Malaysia in paper [5], the authors have presented a theoretical model that shows how data from different educational settings can contribute in the prediction of student's final grade. The results indicate that coursework marks has the most significant positive relationship with the student's final grade followed by total number of materials downloaded from course management system. The predictor variables of model in [5] are based on attributes from different educational settings such as course work marks, psychosocial factors and Course Management System (CMS) log data.
the answers to a question about the student‟s achievement in taking the course were made. Then these student groups were compared in combination with other data such as examination scores as achievement, and attendance and home work scores as effort, as well as the features of words used in the answered texts. It was found that the students who have good achievement scores often give the comments from a wider view than what they actually learned in the class. On the other hand the students who give the comments using those terms which were taught in the class tends to have low achievement scores.
III. DATA DESCRIPTION
The data chosen for the prediction of students‟ results is MCA students‟ data set consisting of the eight attributes. Table 1 shows different attributes with their description and values.
SNo Attribute Description Values
1. PSM Previous Semester Marks First >60% ; Second>45% &<65% ; Third>35% & <45%
2. CTG Class Test Grade Poor; Average; Good
3. SEM Seminar Performance Poor; Average; Good
4. ASS Assignment Yes; No
5. GP General Proficiency Yes; No
6. ATT Attendance Poor; Average; Good
7. LW Lab Work Yes; No
8. ESM End Semester Marks First >60% ; Second>45% &<65% ;
Third>35% & <45%
Table 1: Attribute description of data set
The domain values for some of the variables were defined for the present investigation as follows:
PSM - Previous Semester Marks/Grade obtained in MCA course: It is split into five class values: First is >60%, Second is >45% and <60%, Third is >36% and < 45%, Fail is< 40%.
CTG - Class test grade obtained: Here in each semester two class tests are conducted and average of two class test are used to calculate sessional marks. CTG is split into three classes: Poor is < 40%, Average is> 40% and <60%, Good is >60%.
SEM - Seminar Performance obtained: In each semester, seminars are organized to check the performance of students. Seminar performance is evaluated into three classes: Poor - Presentation and communication skill is low, Average - Either presentation is fine or Communication skill is fine, Good - Both presentation and Communication skill is fine.
ASS - Assignment performance: In each semester two assignments are given to students by each teacher. Assignment performance is divided into two classes: Yes-student submitted assignment, No-Student not submitted assignment.
GP-General Proficiency: general proficiency tests are organized based on performances in each semester. General Proficiency test is divided into two classes: Yes -student participated in general proficiency, No - Student not participated in general proficiency.
ATT - Attendance of Student: Minimum 70% attendance is compulsory to participate in end Semester Examination. But even through in special cases low attendance students also participate in End Semester Examination on genuine reason. Attendance is divided into three classes: Poor is<60%, Average is> 60% and <80%, Good is >80%.
ESM - End semester Marks: obtained in MCA semester and it is declared as response variable. It is split into five class values: First is >60%, Second is>45% and <60%, Third is>36% and< 45%, Fail is< 40%.
The experiments are conducted in weka machine learning software tool, so data is converted to arff (attribute relation file format) which is shown below
Arff file generated from the data Set @relation Student
@attribute PSM {First, Second, Third, Fail} @attribute CTG {Good, Average, Poor} @attribute SEM {Good, Average, Poor} @attribute ASS {Yes, No}
@attribute GP {Yes, No}
@attribute ATT {Good, Average, Poor} @attribute LW {Yes, No}
@attribute ESM {First, Second, Third, Fail} @data
First, Good, Good, Yes, Yes, Good, Yes, First First, Good, Average, Yes, No, Good, Yes, First
First, Good, Average, No, No, Average, No, First and so on
IV. METHODOLOGY
Model Generation
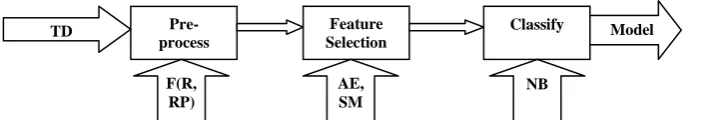
The model proposed in this study of prediction problem is shown in fig 1. The students‟ data set is loaded in weka and converted to arff file. The pre-processing step is required as it applies a filter to change the ordering of data elements in the data set. Randomize and Remove Percentage Filters are chosen to perform this task. Selection of features is an important step as it improves the efficiency and performance of the classifier. Attribute evaluator namely CfsSubsetEval and Greedy Stepwise Search Method are feature selection methods. Pre-processed data and selected features are then input to the naive bayes classifer to build the model which is going to be used for prediction of test data
TD: Training Data
F(R, RP): Filter(Randomize, Remove Percentage) AE: Attribute Evaluator SM: Search Method NB:Naive Bayes
Fig 1: Model for the prediction of students performance in exams
Model Usage
The model developed from a three steps process of model generation is then used to predict the students results in their semester exams. Test data is input to the model i.e., naive bayes classifier model, that process it and predict the results shown in fig 2. The naive bayes theorem and its derivation are discussed below:
Naive Bayes Theorem–The Bayes Theorem: P( h | D)= P( D | h ) P( h ) / P( D )
P( h ) : Prior probability of hypothesis h P( D ) : Prior probability of training data D P( h | D ) : Probability of h given D P( D | h ) : Probability of D given h Fig 2: Usage of model for prediction
Pre-process
Feature Selection
Classify
TD Model
F(R, RP)
AE, SM
NB
Derivation of naive bayes theorem: Let D be the set of tuples and each tuple is an „n‟ dimensional attribute vector X :
(x1,x2,x3,…. xn) and let there be „m‟ Classes : C1,C2,C3…Cm . Naïve Bayes classifier predicts X belongs to Class Ci iff
P ( Ci | X ) > P( Cj | X ) for 1<= j <= m and j <> i.
Maximum Posteriori Hypothesis: P ( Ci | X) = P( X | Ci) P( C i) / P( X ). Maximize P( X | Ci) P( Ci ) as P( X ) is constant with many attributes, it is computationally expensive to evaluate P( X | Ci ).
Naïve Assumption of “class conditional independence” is as follows:
P( X | Ci )= 𝑛𝑘=1𝑃(𝑋𝑘 | 𝐶𝑖)
P( X | Ci) = P( x1 | Ci) * P( x2 | Ci) *…* P( xn | Ci )
V. EXPERIMENTAL STUDY AND RESULTS ANALYSIS
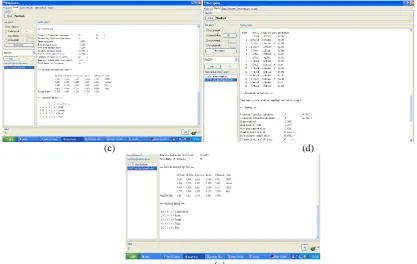
The prediction task of students‟ performance in semester exams is carried out on weka 3.7.10. The output screens (a) through (e) in Fig3 shows the different steps in performing the model generation and model usage.Pre-processing of data is done in (a), followed by task of attribute selection shown in (b). Execution of naive bayes classifier on the training data is done in (c). Testing data on the model is shownin (d) and (e). The result is analysed through different measures like kappa statistics and confusion matrix. The kappa statistic measures the agreement of prediction with the true class, 1.0 signifies complete agreement. The confusion matrix is more commonly named contingency table. Confusion matrix is a 4x4 table as we have only four attributes in our data set after the step of attribute selection, the matrix could be arbitrarily large based on the number of attributes in the data set. The number of correctly classified instances is the sum of diagonals in the matrix; all others are incorrectly classified. Four instances of class first gets misclassified as second, and first misclassified as third once, class second as third exactly twice and so on.
(a) (b)
The True Positive (TP) rate is the proportion of instances which were classified as class x, among all instances which
truly have class x, i.e. how much part of the class was captured. It is equivalent to Recall. In the confusion matrix, this
is the diagonal element divided by the sum over the relevant row, i.e. class first TP rate is calculated as 2/(2+2)=0.500, second as 3/(3)=1.000, third as 4/(1+4)=0.800 fail as 1/(1+2)=0.333 for our dataset of Student.
The False Positive (FP) rate is the proportion of instances which were classified as class x, but belong to a different
class, among all examples which are not of class x. In the matrix, this is the column sum of class x minus the diagonal
element, divided by the rows sums of all other classes; i.e. for first 2-2/4=0 and so on.
The Precision is the proportion of the instances which truly have class x among all those which were classified as
class x. In the matrix, this is the diagonal element divided by the sum over the relevant column, i.e. 2/2=1 for class first,
3/(2+3+1)=0.500 for class second, 4/(4+2)=0.667 for class third, and 1/1=1.000 for class fail.
The F-Measure is simply 2*Precision*Recall/(Precision+Recall), a combined measure for precision and recall.
First=2*1.0*0.5/(1.0+.5)=0.667, Second=2*0.5*1.0/(0.5+1.0)=0.667, Third=2*0.667*0.8/(0.667+0.8)=0.727,
(c) (d)
(e)
Fig 3: Output screens (a) Pre-process (b) Attribute selection (c) Classify (d) and (e) Test data prediction
Thus, it is shown through experimental results that the prediction of students‟ performance in their semester exams can be done by using their previous semester marks and their overall performance in various activities of the current semester. This helps all the stakeholders of the educational system to take necessary actions to improve the results.
VI. CONCLUSION
Data Mining is used to study and analyse vast amount of data from multitude of domains. Every domain has its own importance; however education is the most critical domain as it builds the future of students. In this paper, educational data mining area is explored and its impact in improving the quality of education is discussed. Students‟ results are of interest to teachers, students, parents, educational institute and so on. Predictions of results help every stakeholder in an education system to improve the performance of students.
This paper presents a model and implements it in order to predict the final semester results of the students. Seven attributes were selected for the purpose of prediction of final results. In a feature selection process, an attribute was removed as it was not of significant value in the prediction process. Naïve Bayes model has been chosen and successfully implemented on weka 3.7.10.
REFERENCES
[1] A Comparison of Tree-based data classifying Algorithms in Weka Tool using Glass Dataset, Humera Shaziya, M. PurnaChary, G.Kavitha, 2014 International Conference on Biophysics .
[2] Mining Educational Data to Analyze Students‟ Performance, Brijesh Kumar Baradwaj, Saurabh Pal, (IJACSA) International Journal of Advanced Computer Science and Applications, Vol. 2, No. 6, 2011.
[3] A Survey and Future Vision of Data mining in Educational Field, Barahate Sachin R, Shelake Vijay M, 2012 Second International Conference on Advanced Computing & Communication Technologies.
[4] Predicting student performance:an application of data Mining methods with aneducational web-based system Behrouz Minaei-Bidgoli , DeborahA. Kashy, Gerd Kortemeyer, William F. Punch,2003 IEEE, 33'd ASEE/IEEEFrontiers inEducation Conference
[6] A Case Study on Using Data Mining for University Curricula, Yoshitaka Sakurai, Kouhei Takada and Setsuo Tsuruta, Rainer Knauf, 2012, 12th IEEE International Conference on Advanced Learning Technologies.
[7] Evaluation of Academic Plans of Study Using Data Mining Techniques, Muazzam Ahmed Siddiqui and Shehab Gemalel-Din, 2013 IEEE 13th International Conference on Advanced Learning Technologies.
[8] Predicting School Failure and Dropout by Using Data Mining Techniques, Carlos Márquez-Vera, Cristóbal Romero Morales, and Sebastián Ventura Soto, IEEE Journal of latin-american learning technologies, vol. 8, no. 1, February 2013.
[9] Data Mining in Educational System using WEKA, Sunita B Aher, Mr. LOBO L.M.R.J. International Conference on Emerging Technology Trends (ICETT) 2011 Proceedings published by International Journal of Computer Applications (IJCA).
[10] Educational Data Mining: A Case Study, Agathe MERCERON and Kalina YACEF.
[11] A survey of educational data-mining research, Richard A. Huebner, Research in Higher Education Journal.
[12] An Educational Data Mining Model for Online Teaching and Learning Jui-Long Hung, Kerry Rice, Anthony Saba,Hung, J.L., Rice, K. Saba, A. (2012). An educational data mining model for online teaching and learning.Journal of Educational Technology Development and Exchange, 5(2), 77-94.
[13] Educational Data Mining for Grouping Students in E-learning System,Divna Krpan, Slavomir Stankov.
[14] Enhancing Teaching and Learning Through Educational Data Mining and Learning Analytics: An Issue Brief U.S. Department of Education, Office of Educational Technology , Prepared by: Marie Bienkowski, Mingyu Feng, Barbara Means, Center for Technology in Learning SRI International, October 2012.
[15] Introduction to The Special Section on Educational Data Mining,Toon Calders, Mykola Pechenizkiy, SIGKDD Explorations Volume 13, Issue 2.
[16] Application of Data Mining in Educational Databases for Predicting Academic Trends and Patterns, Suhem Parack, Zain Zahid, Fatima Merchant.
[17] Investigation of Students‟ Attitudes to Lectures with Text-Analysis of Questionnaires,Toshiro Minami, Yoko Ohura, 2013 Second IIAI International Conference on Advanced Applied Informatics.
[18] Workshop on Educational Data Mining @ ICALT07 (EDM@ICALT07), Joseph E. Beck1, Toon Calders2, Mykola Pechenizkiy2 and Silvia Rita Viola3, Seventh IEEE International Conference on Advanced Learning Technologies (ICALT 2007).
[19] Educational Data Mining: A Review of the State-of-the-Art, Cristóbal Romero, Member, IEEE, Sebastián Ventura, Senior Member, IEEE,
Transactions on Systems, Man, and Cybernetics--Part C: Applications and Reviews
[20] Learning Analytics Text: Chapter4 Educational Data Mining and Learning Analytics, Ryan Shaun Baker, Paul Salvado Inventado, pp 61-75, Springer.
[21] Eduational Data Mining Application and Trends Text: Chapter 2 Survey on pre-processing educational data, Cristobal Romero, Jose Raul Romero, Sebastian Ventura, pp 29-64, Springer.
[22] Where is research on massive open online courses headed? A data analysis of the MOOC Research Initiative, Dragan Gasevic, Vitomir Kovanovic, Srecko Joksimovic, George Siemens,
The international review of research in open and distance learning, Vol 15, No(5), 2014.
[23] Educational data sciences: framing emergent practices for analytics of learning, organizations, and systems, Philip J. Piety, Daniel T. Hickey, M.J. Bishop, Proceedings LAK‟14 proceedings of the Fourth International Conference on Learning Analytics and Knowledge, Pages 193-202. [24] Learning Analytics and Educational Data Mining in Practice: A Systematic Literature Review of Empirical Evidence, Zacharoula Papamitsiou
and Anastasios A. Economides, Journal of Educational Technology & Society, Vol. 17, No. 4, Review Articles in Educational Technology (October 2014), pp. 49-64