ON THE RECOMBINATIONAL STRUCTURE AND COMPLEMENTATION RELATIONSHIPS IN THE m-dy COMPLEX OF
DROSOPHILA MELANOGASTERl
GORDON L. DORN2 AND ALLAN B. BURDICK
Department of Biological Sciences, Purdue University, Lafayette, Indiana
Received September 1, 1961
HE unit of genetic structure and the unit of genetic function are ascertained by different experimental operations. Structural elements are resolved by criteria that are essentially unrelated to the criteria used in resolving functional elements. “Allelism” is said to exist-in one or the other of these senses-when two elements can not be resolved by the operation used to reveal their relation- ship. Allelism, therefore, is a state of the asympote of our resolving technique, a structural state that is approached as we test elements that are closer and closer together in the genetic sequence, or a functional state approached in elements with more and more similar biological effect ( PONTECORVO 1956).
In many organisms it appears that the members of an allelic system when subjected to more rigorous resolving techniques can be separated into distinct units. The classical work of LEWIS (1955) has
led
to the concept of “position pseudoallelism”. Whenever two recessive mutants of independent origin produce a mutant phenotype in the trans configuration ( a ,+/+
a,) and a normal pheno- type in the corresponding cis configuration (a, as/+ +),
they are said to be pseudoallelic to each other. In general, mutants showing this phenomenon have been found to be closely linked although the converse does not necessarily follow. Most definitions of the gene allude to three operationally defined properties of the hereditary unit, function, recombination, and mutation ( STADLER 1954).BENZER
(1957) has defined the cistron in terms of the LEWIS cis-trans test as the unit of genetic function and has shown that the cistron is divisible by recombina- tion into many subunits, the smallest of which he would call the recon, or the unitof genetic recombination. In addition, he has suggested the term muton for the smallest unit which when altered gives rise to a mutant phenotype. The cistron, then, is a region of contiguous genetic elements all of which in the cis-trans test are noncomplementary to one another. Two mutants are said to be complemen- tary (and in different cistrons) if they produce the wild-type phenotype in both cis and trans configurations.
Recently, several attempts have been made to compare recombination and complementation maps for a given locus. Several investigators (WOODWARD,
PARTRIDGE, and GILES 1958; CASE and GILES 1960; LACY and BONNER 1961) have 1 Supported in part by Grant No. E-1428 from the National Institutes of Health and a pre-
2 Present address: Genetics Department, The University, Glasgow, Scotland.
doctoral fellowship from the National Science Foundation to the senior author.
5 04 G. L. D O R N A N D A. B. B U R D I C K
been able to separate various loci of Neurospora into distinct units on the basis of complementation and recombination. A comparison of the complementation and recombination maps thus obtained reveals that the linear order of the ele- ments in both maps is in general accord, i.e., mutants widely spaced on the complementation maps were also far apart in terms of recombination values.
S L A T I S and WILLERMET (1954) showed that m (miniature wing) and d y
(dusky wing-phenotype almost identical to m), which were known to be com- plementary yet very closely linked on the Drosophila melanogaster sex chromo- some at positions 36.1 and 36.2, respectively, would recombine in trans heter- ozygotes. The distribution of outside markers in the recombinants indicated that m was to the left of d y .
Colinearity of the recombination and complementation maps does not obtain for the dumpy locus on the second chromosome of Drosophila melanogaster
(CARLSON 1959). WELSHONS and VON HALLE (1960 and personal communica- tion) find that there are inconsistencies with colinearity among the visible mu- tants at the Notch-split-facet locus of the first chromosome of D. melanogaster.
We will report here recombination and complementation analyses of the mini- ature-dusky complex of D. melanogaster. Evidence will be presented which sug- gests that the elements of this complex can be separated into a colinear array on the basis of complementation and recombination. Unexpected recombinants were observed between Df (1)259-4, a deficiency for the miniature mutants, and the miniature mutants.
M A T E R I A L S A N D M E T H O D S
The mutants in the miniature-dusky complex are characterized by a reduc- tion in wing size usually accompanied by a darkening of the wing epithelium. The various mutants can be roughly subdivided by the cis-trans test into what at first appears to he two separate cistrons, namely, the miniature and the dusky cistron. Refined complementation analysis tends to show that the m and d y mu- tants may be considered to be in the same functional group. The following minia- ture and dusky mutants were used in this investigation: m59, msO, m, m57, m”, d y , dy“, and dy58. Df(2)259-4, a deficiency of the salivary gland chromosome bands from 1OC 1-2 through 10E 1-2, was also in a series of complementation and re- combination experiments. Throughout this paper the letter of the month has been dropped from the mutant symbol; Df(1)259-4 will be referred to simply as O f (1).
The miniature mutant m (1-36.1) was discovered by MORGAN (1910); the standard dusky mutant d y (1-36.2) was reported by BRIDGES (1 925). BURDICK
(1961) reported the mutants m59 and dy58. All of the above mutants are believed to have arisen as spontaneous mutations. MAYO (1958) recovered m57 from X-rayed Canton3 sperm. The two mutants moo and d y s f were discovered by IVES
MINIATURE-DUSKY 505 effect with all the miniature but none of the dusky mutants. (References are to BRIDGES and BREHME 1944 and Drosophila Information Service.)
All progeny observed in recombination experiments were raised on a cornmeal- molasses-agar medium at a controlled temperature of 74-78°F. In every instance three-pair matings were made. The nonrecombinant population sizes were esti- mated by weighing rather than counting. The total population minus the recom- binants was collected in petri dishes filled with ethyl alcohol. These were then placed in a drying oven set to operate at approximately 150’F with a relative humidity of 20 percent. At the end of six days the petri dishes were removed and five random samples of 20 flies were taken from each dish and weighed on a Met- tler micro balance. The remainder of the flies were then weighed, and the num- ber present was estimated by dividing the total weight by the mean weight per fly. The standard deviations are between one and two percent of the total weight; the significant digits in the weight calculations are three or four, so the totals are rounded to the nearest 100 flies.
All recombinant types were mated to verify their wild-type constitution and, in the case of female recombinants, to determine the assortment of the outside markers. Mutant m or d y males were used in the critical matings in order that types arising from nondisjunction would be classified as nonrecombinants.
The mutants vermilion (1-33.0) and garnet (1-44.4) were used to mark the regions on either side of the miniature-dusky complex in most of the recombina- tion experiments. This was done in order to detect element order, back mutations, and/or negative interference. A preliminary investigation was conducted without outside markers
(DORN
1960).All experiments involving the measurement of wing lengths were conducted under the same conditions. The flies were reared in a uniform environment chamber on identical media. The temperature (78 f 0.5”F) and the humidity
(62 k 1
%
) were held constant. The equivalent of three-pair matings were made in every case in order that competition for the media might be kept relatively constant. Wing length was measured from the base of the subcostal vein to the tip of the third wing vein. One wing from each of 20 randomly selected flies was measured for each genetic combination. All wings were mounted between a slide and a cover slip in a drop of glycerin. Readings were taken at 40x using an ocular micrometer which was divided into 200 units. At this magnification one unit on the ocular micrometer is equivalent to 0.0187 millimeters.RESULTS
TABLE 1
Recombination data and outside marker assortment for mutant elements in the m-dy complex
Combination'
Type of recombinant Double Double
( U - m (m-g Total Total no. Single region) repon) Triple recomb. flies
1.
+
D f ( l ) +/U mS9+
2 2 4 71,800+
D f ( f ) g / u m59+
2 0 0 0 2 28,500 2.+
D f ( l ) g / u m+
1 0 6 2 9 116,800 3.+
D f ( l ) g / u m57+
0 0 0 0 0 66,600 4.+
D f C l ) g / u mD+
3 0 3 0 6 55,400+
D f ( l ) g / u dr+
3 0 0 0 3 17,400 6.4-
D f C l ) g / u d y S 8 f 7 0 I 0 8 27,500+
D f ( l )+/+
dyS8+
6 6 16,7007.
+
D f / l ) g / u+
+
0 0 0 0 0 33,2008.
+
D K l I g/+4-
1 0 1 34,6009.
+
D f ( l ) g / u ay6*4-
2 0 0 0 2 11,800 IO.+
m g / u m59+
1 0 0 0 1 36,600+
m+/+
m59+
1 1 13,@O11.
+
m59 + / U m57+
0 0 0 71,30012. U m59
+/+
mDg 5 0 0 0 5 73,30013. U m59
+/+
d y g 3 0 0 0 3 29,000 14. U m59+/+
dy58g 3 0 0 0 3 12,50015.
+
dye1 +/U m59+
1 0 1 14,20016. U m57
+/+
m g 0 0 0 0 0 65,00017. U m + / + m D g 3 0 1 0 4 64,600
+
m g / u mD+
1 0 1 0 2 29,400+
m+/+
m D+
3 3 43,80018. + m g / U d y + 0 0 0 0 0 1 1,400 U m + / + d y g 1 0 0 0 1 18,200 5.
+
D f ( l ) g/+ dy+
2 0 2 10,000+
mS9+/+
d y S 8+
3 3 12,1004- m
+/+
d r+
0 0 21,400 19. U m+/+dy58+ 2 0 2 12,100U m
+/+
dys8 g 2 0 0 0 2 14,000+
m+/+
d~~~+
2 2 12,30020. U m57
+/+
mD g 1 0 0 0 1 53,200+
mS7+/+
mD+
0 0 36,00021. U m5'+/+dyg 2 0 0 0 2 57,700
22. U m57
+/+
dy58 g 1 0 0 0 1 34,60023. U mD
+/+
d y g 0 0 0 0 0 37,000+
m D+/+
dY+
0 0 41,70024.
-+
mD g / u dy58+
0 0 0 0 0 43,000+
m Dt/+
d y S 8 i- 0 0 39,700 25. U mD+/+dy61g 0 0 0 0 0 13,200 26. U dy58+/+
d y g 0 0 0 0 0 47,200+
dY58+/+
dY+
0 0 27,500 27. U d ~ 5 ~ + / + d y ~ l g 0 0 0 0 0 50,200 28. + m + / + m + 0 0 30,00029.
+
m57+/+
m57+
0 0 24,40030.
+
d r+/+
d r+
0 0 24,800 31.+
d ~+/+
5 ~dy58+
0 0 23,700Grand total 80 1,640,900
+
m5?+/+
d~~~+
1 1 12,100- _ _ _
MINIATURE-DUSKY 507
view that these wild-type individuals are the result of classical reciprocal crossing- over. Since garnet is approximately nine units from the miniature-dusky region, a few double crossovers might be expected. The cross involving the mD/m heter- ozygote yielded two such double crossovers (along with seven singles), but there were no others from any mutant combinations except those with the deficiency. Because all wild-type individuals bred true in subsequent generations, the possi- bility of autosomal dominant suppressor mutants is eliminated.
The Table 1 column titled, “Type of recombinant” gives a description of the assortment of the outside markers for each recombinant observed. A single re- combinant is one in which the recombination of the two inside elements ( n or
d y ) is accompanied by a simultaneous recombination of the outside markers. This is the single crossover of classical reciprocal crossing-over. Two kinds of dou- ble recombination are recorded; one in which the U is not recombined at the same
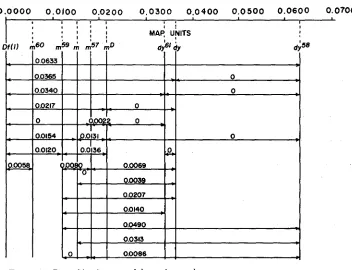
time that the inside elements are (U-m region), and one in which the g is not recombined along with the inside elements ( n - g region). These correspond to the two types of classical double crossing-over. Triple recombination involves simultaneous recombination of inside and outside markers but in such a way that, assuming fixed, linear relationships between the markers, it would require a triple classical crossing-over to produce it. The map distance (Table 2) was obtained by doubling the number of recombinants and dividing by the total population. When an attempt is made to arrange the mutants in a linear order, one finds that a single specific arrangement is consistent with all the results. This arrange- ment along with the individual map distances is illustrated in Figure 1. Because
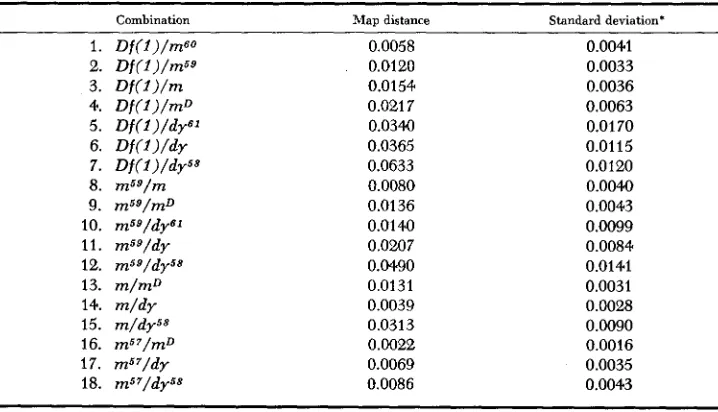
TABLE 2
Recombination map distances between various elements of the m-dy complex with their standard deviations. (Other combinations yielded no recombinants.)
Combination Map distance Standard deviation*
1. Df(l)/mGO 0.0058 0.0041
2. Df(Z)/m59 0.0120 0.0033
3. D f ( l ) / m 0.0154 0.0036
4. Df(l)/mD 0.021 7 0.0063
5 . Df(l)/dy61 0.0340 0.0170
6. D f ( f ) / d r 0.0365 0.0115
7. Df(l)/dybP 0.0633 0.0120
8. m59/m 0.0080 0.0040
10. m59/dy61 0.0140 0.0099
9. m59/mD 0.0136 0.0043
11. msg/dy 0.0207 0.0084
12. m59/dy58 0.0490 0.0141
13. m/mD 0.0131 0.0031
14. m / d y 0.0039 0.00%
15. m/dy58 0.0313 0.0090
16. m5’/mD 0.0022 0.0016
17. ms7/dy 0.0069 0.0035
18. m57/dy58 0.0086 0.0043
508 G . L. DORN A N D A. B. BURDICK
0 0 0 0 0.0100 0 . 0 2 0 0 0.0300 0.0400 0 . 0 5 0 0 0 . 0 6 0 0 0.0700
t L
I t 1 1 t u I
I
I
FIGURE 1 .-Recombination map of the m-dy complex.
of the low number of recombinants and the size of the variance terms (Table 2),
the relationship of mSO with mS9 and that of d y S 1 with d y is uncertain. With the exception of crosses involving D f ( I ) and the m/mD combination, the element order obtained from the recombination data is confirmed by the segregation of the outside markers.
A comparison of the individual values suggests a certain degree of non- additivity in the miniature-dusky region. However, the size of the variances makes it apparent that the possibility of additivity for most of the elements is not ruled out. The relationships between mu and the dy’s, among the dy’s, and between m57 and them’s are not additive.
On the basis of the simplest classical concept of a gene and its deficiency one expects that Df ( I ) would yield no recombinants with the miniature mutants. However, the deficiency recombines with all of the m and dy elements except
m57. The deficiency data are unusual in still another way. On the basis of the
element order given in Figure 1 almost every cross involving D f ( I ) and a miniature shows a preponderance of double and triple recombinants for the outside markers, and no rearrangement of the element order can materially change the situation. Recombinants with the dy’s, on the other hand, are all but one, classical singles.
MINIATURE-DUSKY 509
flies we found none that had miniature wings; such flies would have indicated the separation of the m point mutation from the D f ( 1 ) .
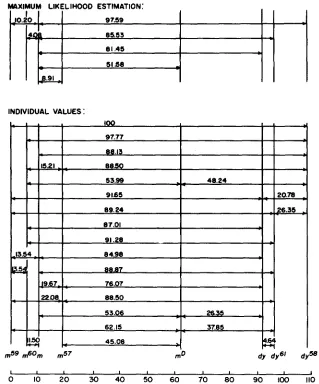
Complementation: The mean wing lengths of all possible combinations of the nine mutants are listed in Table 3. A linearly-ordered complementation map of the miniature-dusky region can be constructed from these data, as shown in Figure 2. We have assumed that the wing length of a given trans heterozygote is determined by ( 1 ) the homozygous effect of each mutant involved and (2) the degree of complementation between the mutants. If two mutants are completely allelic in the functional sense, then the expected wing length of the trans heterozygote is the midparental value of the mutants in question. Allelism o r noncomplementation is assumed to occur whenever the observed minus the ex- pected is equal to or near zero. Deviations from zero are taken to indicate non- allelism. Varying degrees of complementation can be calculated from the posi- tive deviations of the observed minus the expected values. A “positive deviation” means an increase in wing size, reaching wild-type dimensions in certain combinations.
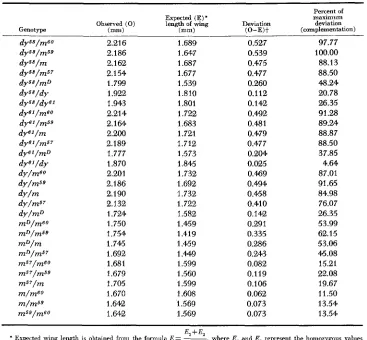
Table 4 gives the expected values of the trans heterozygotes involving mD and the recessive mutants. The standardized values in column 5 of Table 4
represent the percentage of maximum deviation; the dy58/m59 combination is taken to show complete complementation, that is, wild-type wing. A maximum likelihood estimate of the approximate location of the eight mutants has been obtained from these complementation values. When m is set equal to zero, a
negative value indicates that the mutant in question lies to the left of m; a posi- tive value implies that it is situated to the right of m. According to the results obtained, mSg, mSO, msy, mD, d y , dyS1, and dyS8 show --10.20, -4.08, 8.91, 51.58, 81.45, 85.53 and 97.59 percent maximum deviation respectively. In Figure 2, two complementation maps are represented; one is based on the maximum likeli- hood estimation and shows the relative positions of mD and the recessive mutants; the other shows the individual values from which the maximum likelihood map was calculated.
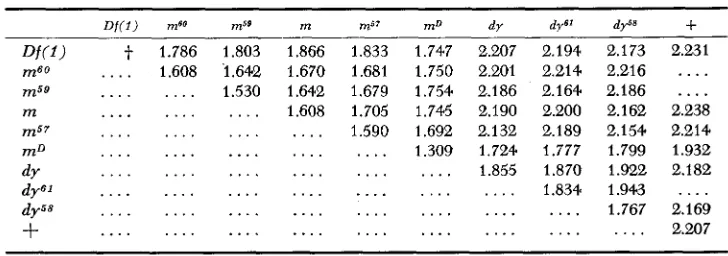
TABLE 3
Observed mean wing length (0) of homozygous and heterozygous
m-dy complex mutants in millimeters*
D f ( 1 ) me0 m59 m m57 m D dy
t
1.786 1.803 1.866 1.833 1.747 2.207. . . . 1.608 ‘1.642 1.670 1.681 1.750 2.201
. . . 1.530 1.642 1.679 1.754 2.186
. . . 1.608 1.705 1.746 2.190
. . . 1.590 1.692 2.132
. . . 1.309 1.724
. . . 1.855
. . .
. . .
. . .
2.194 2.173 2.231 2.214 2.216
....
2.164 2.186....
2.200 2.162 2.238 2.189 2.154 2.214 1.777 1.799 1.932 1.870 1.922 2.182 1.834 1.943 . . . .. . . .
1.767 2.169. . . 2.207
* The pooled variance for these means equals 4.9 X
97.59 I
$0.20 ~ .
ai 85.53
81.45
5158
b
p
&
INDIVIDUAL VALUES
I;
45.08m59 n P m m57 mD dy dy6' dym
I I I 1 I I 1 I I I I 1
0 IO 20 30 40 50 60 70 80 90 100 110
FIGURE 2.4omplementation map of the m-dy complex expressed as the percent of maximum deviation.
a
*
The genetic combinations involving D f ( 1 ) were not included in Figure 2 since there is no way of computing the expected wing lengths of the various combinations. This latter condition arises from the fact that the homozygous deficiency is lethal. When the deficiency data are considered by themselves, however, a linear map can once again be constructed, and the order of the elements is in general accord with that given in Figure 2. The deficiency data further suggest that D f ( l ) is the leftmost element.
M I N I A T U R E - D U S K Y 511 TABLE 4
Complementation in trans heterozygotes of mutants in the m-dy complex, excluding Df (1)
Percent of
Expected (E)' maximum
Observed (0) length of wing Deviation deviation
(complementation)
~~~
Genotype ("1 b" (O-E)t
-
dy58/m60 2.216 1.689 0.527 97.77 2.186 2.1 62 2.154 1.799 1.922 1.943 2.214 2.164 2.200 2.189 1.777 1.870 2.201 2.186 2.1 90 2.132 1.724 1.750 1.754 1.745 1.692 1.681 1.679 1.705 1.670 1.642 1.642 1.647 1.687 1.677 1.539 1.810 1.801 1.722 1.683 1.721 1.712 1.573 1.845 1.732 1.692 1.732 1.722 1.582 1.459 1.419 1.459 1.449 1.599 1.560 1.599 1.608 1.569 1.569 0.539 0.475 0.477 0.260 0.112 0.142 0.492 0.481 0.479 0.477 0.204 0.025 0.469 0.494 0.458 0.410 0.142 0.291 0.335 0.286 0.243 0.082 0.119 0.106 0.062 0.073 0.073 100.00 88.13 88.50 48.24 20.78 26.35 91.28 89.24 88.87 88.50 37.85 4.64 87.01 91.65 84.98 76.07 26.35 53.99 62.15 53.06 46.08 15.21 22.08 19.67 11.50 13.54 13.54 ~ ~~~ ~ ~
E +E2
* Expected rnng length is obtained from the formula E = -I-, where E, and E , represent the homozygous values
t The variance of the values in this column is 7 . 3 X I O 4 .
2 of the mutants involved (see Table 3)
map reverses this order. Likewise, the position of d y with respect to dy6' is re- versed depending on which of the two maps is considered. However, the variance terms are of such magnitude that these apparent differences in the mutant order can not be critically resolved. Thus, it seems that the elements in the miniature- dusky complex can be arranged in linear order both structurally and functionally, i.e., are colinear.
DISCUSSION
512 G . L. DORN A N D A. B. BURDICK
indicate that mS7 does not recombine with any of the mutants to its left, namely, D f ( I ) , m59 and m. In addition, the mutants m”, dy, dy5* and dyG1, insofar as it is known, do not recombine with one another. Therefore, the relative positions of mu, dy, dyol and dy5u can only be determined indirectly, i.e., from a comparison of the amount of recombination between them and the mutants to the left. The results of such a comparison are shown in Figure 1.
The above results indicate that several of the minature and dusky mutants behave as regions of functional and recombinational inactivation. In a classical sense, the presence of minute deficiencies, duplications, or inversions will account for the ohserved inactivations. Each of these chromosomal aberrations would create a poor pairing relationship and, hence, a decrease in recombination. All the mutants showing aberrant recombination except d y were X-ray induced; furthermore they all exhibited good viability. It seems unlikely, therefore, that they were deficiencies. At present, the simplest explanation of the apparent inactivations is that the mutants involved are either minute duplications or inversions.
The proposed structure of the miniature-dusky region as suggested by the recombination data is diagrammed in Figure 3. Point mutations are represented as squares; rectangles have been used to show the boundaries of the inversions or duplications and D f ( 1 ) . An open rectangle indicates that the boundary has not been determined, e.g., the lelt boundary of the mS7 inversion or duplication is not known. As was previously mentioned, the position of mGO and dy61 is not definitely known due to an insufficient amount of data. That is, mS0 could be situated to the right or left of m59, and dy6‘ might lie on either side of dy.
Recombination with Df (1 ) : When the phenotype of a trans heterozygote containing a deficiency and a recessive mutant resembles the homozygous mutant, one assumes that the deficiency involves the loss of the mutant region.
Df ( I ) was thought to be such a deficiency since it yields a miniature phenotype when in combination with each of the miniature mutants. This investigation indicates that such is not the case. The deficiency recombined with four of the five miniature mutants with which it produced a hemizygous effect. The one exception, m57, can be explained on the basis that m57 is an inversion extending into the deficiency. The position of D f ( I ) on the basis of recombination data is to the left of the other mutants (Figure 1 )
.
Assortment of outside markers: In general, the assortment of outside markers (vermilion and garnet) is in accord with the gene order obtained by the re-
m57
MINIATURE-DUSKY 513
combination data (Figures 1 and 3 ) . There are a few exceptions, however, and some attempt will be made to explain them. Since garnet is approximately eight units from the miniature-dusky region, an occasional double crossover involving this marker would be expected. The three double crossovers, two from
U m/mD g and one from D f ( 1 ) g / u dy”, may be explained in this manner.
Most of the recombinants involving D f ( 1 ) and the miniature mutants showed nonclassical assortment for the outside markers. As was noted in the previous section, certain of these crosses yielded a preponderance of double crossovers with the garnet marker. In addition, one genetic arrangement produced two double crossovers involving vermilion; another displayed two triple crossovers. This irregular assortment of outside markers may, in part, be explained on the basis of negative interference.
PRITCHARD (1960) has proposed a model to account for the abnormal re- combination of closely linked markers. According to him, “It is assumed that a necessary condition for recombination (effective pairing) is realized at a particu- lar point on the chromosome in only a small fraction of cells at meiosis. Effective pairing, when it occurs, extends over a short segment of the chromosome and the possibility of a recombination event within an effectively paired region is high. Multiple recombination events are therefore encountered with such segments and appear to be positively correlated as a statistical consequence of the large zero class in which there is no effective pairing, and consequently, no recombination.” How does PRITCHARD’S model explain the presence of negative interference in the D f ( I ) - m recombinants and the lack of negative interference in all other recombinants? Since deficiencies are known to cause a distortion in pairing at meiosis, it seems plausible that the region of nonpairing in the segment which D f ( 1 ) lacks might be accompanied on both sides by effectively paired regions. Then too, the vermilion marker in crosses involving D f ( 1 ) behaves as though it were closer to the miniature region than the reported three units. This results from the fact that
Df(1)
actually represents the loss of a portion of the chromo- some between vermilion and the miniature-dusky complex. We assume that this latter condition would increase the probability of detecting the presence of nega- tive interference. The lack of negative interference in the other crosses could be due to the relatively large distances between the mutants from which recombi- nants were obtained. Unfortunately, where recombination was observed between small distances, either no markers were used or the amount of data was too smal1 to draw any definite conclusions. The concept of negative interference will also account for the decrease in double crossovers as one proceeds away from the deficiency. With regard to the latter, reservations should be maintained because of the small amount of data.514 G . L. DORN A N D A. B. BURDICK
It is quite possible that some cistrons overlap or are intermingled with others
. .
.”
The complementation data for the miniature-dusky region seem to suggest this very phenomenon to which PONTECORVO has referred. For example, at first glance a comparison of the wing lengths of m/m59 or d ~ / d y ~ ~ individuals with those of an m / d y indicates two clearly delineated cistrons; yet, if one resorts to refined methods of measuring wings, a situation resembling a gradient is ob- served. Thus, one is inclined to speak in terms of “degree of normal” rather than “mutant” or “normal.” The degree of complementation varies with the genetic combination. It was on this basis that the linearly-ordered complementation map(Figure 2) was constructed.
A situation similar to that described above may occur in other pseudoallelic systems, for example, the Star-asteroid or Ultrabithorax regions. Here, however, the graded effect may be obscured by the presence of an intermediate metabolic threshold which strictly determines the presence or absence of the mutant character. However, this is obviously not comparable to the complementation relationships found at the dumpy and Notch-split-facet loci ( CARLSON 1959;
WELSHONS
and VON HALLE 1960) where the complementation relationships are not linear and not colinear with the recombination map.A comparison of the recombination and complementation maps reveals small differences in element order. However, in each case, the variance terms of the recombination data are of such dimension that the observed discrepancies in the two maps are not significant. Consequently, the two maps can be taken to be in general agreement with regard to the order of the elements. From a comparison of the respective mutant positions and variance terms of the recombination and complementation maps one can conclude that the most probable element order is: D f ( l ) , mSg, mSO, m, mS7, mD, d y , dy6’ and dys8.
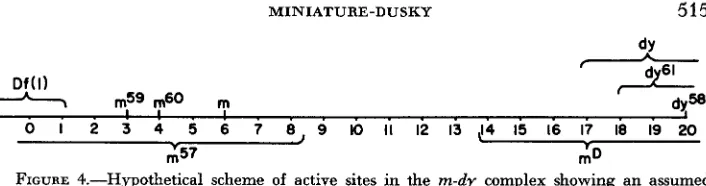
At this point two problems present themselves. First, is there any way to account for the increase in complementation with a corresponding increase in recombination distance? Secondly, why do the suggested inversions or duplica- tions (Figure 3) on the recombination map behave as “points” on the comple- mentation map? With the aid of suggestions from LOCKINGEN and DEBUSK
(1955) and WOODWARD, PARTRIDGE and GILES (1958) we have constructed a unifying model of the recombination and complementation data. I n this scheme those mutants which show recombinational inactivation have been treated as inversions; a similar scheme involving duplications can also be constructed. This model is based on the supposition that the DNA helices as proposed by WATSON and CRICK (1953) are responsible for the production of RNA and that the RNA chains move to the cytoplasm where they govern the formation of protein and other substances involved in the production of the observed phenotype.
MINIATURE-DUSKY 515
A Df(l)
--A7
m59 m60 m0 I 2 3 4 5 6 7 8 9 IO II 12 13 ,!4 15 16 I7 18 19 20
I 3 7 r 3
FIGURE 4.-Hypothetical scheme of active sites in the m-dy complex showing an assumed
location of inactivation or inversion for each of the mutant elements.
shown as inversions of four or more sites. The extent of these inversions and
D f ( l ) is indicated by brackets.
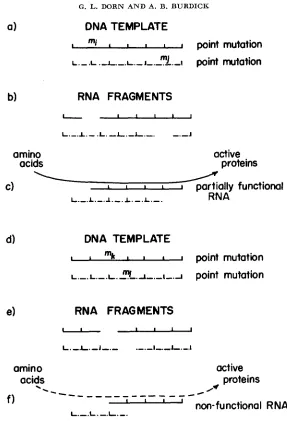
Diagrams have been provided to illustrate how each of the two basic types of alterations, namely point mutations and inversions, might operate in a comple- mentation experiment. Figure
5
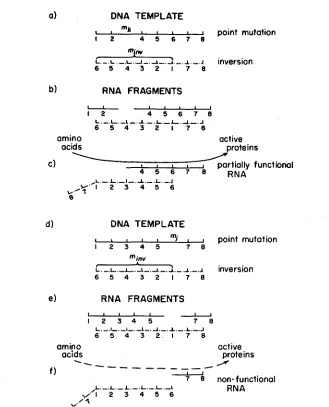
shows how complementation involving two point mutations occurs. It is assumed that two RNA molecules are being con- structed along the DNA homologues which act as templates (Figure 5a). The mutant sites, however, prevent the formation of intact molecules and only RNA fragments are formed. These are ejected from the template (Figure 5b). Only the two larger fragments are complementary and, if they should come into close proximity with one another, hydrogen bonds might be formed, resulting in the construction of a functional RNA molecule. This molecule could then govern the production of compounds specific for normal phenotype (Figure 5c). Figures 5d,e,f show the same basic model with the exception that the two mutant ele- ments are more closely linked. This results in the production of different types of RNA fragments (Figure 5e). This difference is of great importance since the particular arrangement necessary for the formation of a complementary mole- cule has less stability than that in Figure 5c. This reduction in stability is due to the decrease in the number of possible hydrogen bonds which can be formed between the two fragments. A lowered production of substances necessary for wing development accompanies this instability. Thus, the closer the mutants are to one another, the less is the complementation.Figure 6 illustrates how the model operates when one of the mutants is an inversion and the other is a point mutation which involves a site within the region covered by the inversion. In this case, only three RNA chains are produced, i.e., two fragments and an inverted segment. The inverted segment, though intact, is nonfunctional because the order of its elements is disarranged. Once again, however, there is only one combination which will produce a normally arranged strand. Furthermore, the number of positions available for hydrogen bonding increases with distance. It should also be noted that the inversion behaves as a point mutation whose position is identical with the rightmost end of the inversion. Similar conclusions are reached for the crosses involving two inversions or an inversion and a point mutation outside the inversion.
516 G . L. DORN A N D A. B. BURDICK
a)
b)
amino acids
DNA TEMPLATE
, m i , I 1 I point mutation
I-.-
.L .,L.-.L.,L.-~L.,I point mutationRNA FRAGMENTS
active proteins
d)
e)
DNA TEMPLATE
I ' I I 1 point mutation
~ . - . I . - . ~ . ~ - . ~ - . - I - . ~ point mutation
RNA FRAGMENTS
amino active
acids proteins
,*
--
- _ _ _ - - - -
- - - /---
non-functional RNA
f)
-
L.-.L.-.L.,.
FIGURE 5.-Complementation model for two point mutations
located at 8, 14, 17, and 18, respectively (Figure 4). Hence, a correlation of the recombination and complementation maps (Figures 1 and 2) is made possible through the utilization of this model.
M I N I A T U R E - D U S K Y 517
a) DNA TEMPLATE
b)
1 0 m k , , , I , point mutation
1 2 4 5 6 7 8
minv
~.-.L.-.L.-I-.~-.;.-.I.-.J inversion 6 5 4 3 2 I 7 8
RNA FRAGMENTS
-
, 1 1 11 2 4 5 6 7 8
L . - . L . - L , . 1 . - . 1 . - 1 . ~ . - . J 6 5 4 3 2 1 7 8
amino active
acids proteins
C) e r t 4i 5 6a 7 l8 iRNA functional y
, L . - . L . - I - . - I . - . I . - J
W . 1 2 3 4 5 6
b.0 1 9
d) DNA TEMPLATE
1 1 1 1 1 mi
,
point mutation1 2 3 4 5 7 8
minv
-
L.-.L.-L.-L-.-I.,.~.-.I,-.J inversion
6 5 4 3 2 1 7 8
e) RNA FRAGMENTS
I I L I I
-
1 2 3 4 5 7 8
L.-.I-.-I-.-L-.-I.-.l._.l.-.~.-.J
6 5 4 3 2 1 7 8
amino active
acids proteins
f
----
- - - - _ _ _
-
-
7 8 non-functional
f )
RNA
FIGURE 6.-Complementation model for a point mutation and an inversion.
have an effect on the RNA template and, consequently, the enzyme which it forms, Such an effect might result in an alteration of certain physical character- istics of the enzyme. However, the enzyme molecule might still be functional since its basic sequence is intact. Thus, this model will also account for differences in properties of a functional enzyme produced by various interallelic elements such as the a d 4 mutants which PARTRIDGE (1960) investigated.
S U M M A R Y
518 G. L. DORN A N D A. B. B U R D I C K
recombination data a linearly-ordered map was constructed. Present evidence indicates that d7, mD, dy, and dy6I may actually be minute inversions. Df(1)259-4, a deficiency which uncovers the miniature but not the dusky mutants, recombines with three of the four available miniature mutants. Re- combinants from these latter combinations showed aberrant segregation of the outside markers. Complementation studies were made on the basis that wing length varies with different genetic combinations of the mutants available. A
linearly-ordered complementation map was constructed on the assumption that wing length is determined by ( 1 ) the homozygous effect of each mutant involved and (2) the degree of complementation between the mutants. Within the range of experimental error, the recombination and complementation data are in com- plete agreement. These results suggest that the miniature and dusky mutants can best be represented as a functional continuum, subdivisible by recombination and graduated by complementation.
L I T E R A T U R E C I T E D
BENZER, S.. 1957 The elementary units of heredity. pp. 70-93. The Chemical Basis of Heredity.
Edited by W. D. MCELROY and B. GLASS. The Johns Hopkins Press. Baltimore, Maryland.
BRIDGES, C. B., and K.S. BREHME, 1944 The Mutants of Drosophila melanogaster. Carnegie Inst. Wash. Publ. 552.
CARLSON, E. A., 1959 Allelism, complementation, and pseudoallelism at the dumpy locus in
Drosophila melanogaster. Genetics 44 : 347-373.
CASE, M. E., and N. H. GILES, 1960 Comparative complementation and genetic maps of the
pan-2 locus in Neurospora crassa. Proc. Natl. Acad. Sci. U.S. 46: 659-676.
DORN, G. L., 1960 Recombination and complementation i n the cistrons of the miniature dusky complex in Drosophila melanogaster. Master’s Thesis. Purdue University. Lafayette, Indiana. LACY, A. M., and D. M. BONNER, 1961 Complementation between alleles at the Td locus in
Neurospora crussa. Proc. Natl. Acad. Sci. U.S. 47: 72-74. LEWIS, E. B., 1955
LOCKINGEN, L. S., and A. G. DEBusK, 1955
PARTRIDGE, C. W. H., 1960
Some aspects of position pseudoallelism. Am. Naturalist. 89: 73-89.
A model for intercellular transfer of DNA speci- ficity. Proc. Natl. Acad. Sci. U.S. 41 : 925-934.
Altered properties of the enzyme, adenylsuccinase, produced by interallic complementation at the ad-4 locus i n Neurospora crussa. Biochem. Biophysical Research Commun. 3: 613-619.
PONTECORVO, G., 1956
PRITCHARD, R. H., 1960
Allelism. Cold Spring Harbor Symposia Quant. Biol. 21: 171-174 The bearing of recombination analysis at high resolution on the genetic structure in Aspergillus nidulans and the mechanism of recombination in higher organisms. 10th Symposium Soc. Gen. MicroBiol. Pp. 155-180.
The miniature complex in Drosophila melanogaster.
Genetics, 39 : 45-58.
SLATIS, H. M., and D. A. WILLERMET, 1954
STADLER, L. J., 1954 The gene. Science. 120: 811-819
WATSON, J. D., and F. H. C. CRICK, 1953 Molecular structure of nucleic acids. Nature 171:
737-738.
WELSHONS, W. J., and E. S. VON HALLE, 1960
WOODWARD, D. O., C. W. H. PARTRIDGE, and N. H. GILES, 1958
Further studies of pseudoallelism at the Notch
Complementation at the ad-4
locus of Drosophila. (Abstr.) Genetics 45: 1017.