Volume 2010, Article ID 724260,11pages doi:10.1155/2010/724260
Research Article
A Baseband Signal Processing Scheme for Joint Data Frame
Synchronization and Symbol Decoding for RFID Systems
Yung-Yi Wang
1and Jiunn-Tsair Chen
21Department of Electrical Engineering, Chang Gung University, Taoyuan 33302, Taiwan
2R&D Group, Railink Technology Corporation, 5F, No. 36, Tai-Yuen Street, Jhubei City HsinChu Hsien 302, Taiwan
Correspondence should be addressed to Yung-Yi Wang,[email protected]
Received 25 January 2010; Revised 19 April 2010; Accepted 26 April 2010
Academic Editor: Sangjin Hong
Copyright © 2010 Y.-Y. Wang and J.-T. Chen. This is an open access article distributed under the Creative Commons Attribution License, which permits unrestricted use, distribution, and reproduction in any medium, provided the original work is properly cited.
We proposed a novel Viterbi-based algorithm using jiggling substates for joint data sequence detection, symbol boundary self-calibration, and signal frame synchronization for the EPC-Global Gen-2 system. The proposed algorithm first represents the data-encoded scheme as a trellis diagram, and then, as a consequence; the data sequence estimation can be carried out through the Viterbi algorithm. Moreover, time duration of the symbol waveform is iteratively adjusted to generate two substates in the Viterbi algorithm so as to trace and calibrate the symbol boundary on the fly. Compared with conventional approaches, the proposed Viterbi-based algorithm can significantly improve the system performance in terms of data detection accuracy due to its full exploitation of the baseband signal structure combining with the developed substate technique.
1. Introduction
Radio frequency identification (RFID) technology has
become popular as an effective, low-cost solution for tagging
and wireless identification. As RFID technology becomes cheaper, it is becoming increasingly prevalent in many applications, including asset tracking, passports, and mobile
payment. Figure 1 presents a block diagram of a RFID
system. It typically consists of tags (or transponders) and interrogators (or readers), between which information and commands are exchanged under a specific communication protocol. Depending upon the sources of the operating power, tags are generally classified into three categories: passive, semipassive, and active [1,2].
Recent research on RFID systems mainly focuses on RF circuit design issues such as sensitivity improvement of
the tag’s antenna [3,4] and long-range transmitter circuit
design [5, 6]. Very few studies are aimed at the design
of optimal baseband signal processing algorithms. As both antenna design and transmitter circuit realization pose major
challenges in improving power efficiency, baseband signal
processing that further boosts RFID system performance with high signal integrity is an interesting topic to explore.
Conventional RFID interrogators use either a matched filter
or an edge detector [7, 8] to detect encoded data. The
matched filter (also known as the correlator) compares the received waveform with the prescribed data-encoded signals by using a set of integral and dump circuits for each symbol duration and then selects the most likely one as its decision
output. On the other hand, the edge detector [8] uses the
edge transition imposed on each data-encoded baseband signal as its decoding criterion. Assuming perfect symbol period estimation, the matched filter achieves high accuracy on data decoding at the expense of complex hardware implementation whereas the edge detector is vulnerable to noise perturbation due to its simple circuit structure.
of conventional RFID systems to environments with low throughput and moderate data rate transmission. However, in a high data rate system with a large amount of information being organized into several signal frames, the accumu-lation of symbol period biases severely degrades system performance in terms of data detection reliability and signal frame synchronization. To overcome this problem, this study
proposes a novel Viterbi-based [9–11] algorithm, called
the jiggle-Viterbi with substate selection (JVSS) algorithm, which flexibly uses extended substates for joint symbol period compensation, data sequence estimation, and signal frame synchronization.
The proposed JVSS algorithm is applicable to systems that use structured waveforms to represent encoded data. In this paper, the FM0 baseband signal, employed in backscatter communication of the EPC-Global Generation-2 standard
[8], is adopted as an example to illustrate the proposed
algorithm. By decomposing the FM0 baseband signal on a half-cycle basis, we first represent the data-encoded FM0 baseband signal by a four-state Moore machine, and then the associated data detection in the interrogator can be carried out in a maximum likelihood sequence estimation (MLSE) manner which is practically attainable through the use of the Viterbi-based algorithm with acceptable computational complexity. To cope with the symbol period bias, the duration of the basis waveforms of the FM0 baseband signals is dynamically inflated/deflated by a prescribed step size in the execution of the proposed JVSS algorithm. This makes it possible to trace the symbol boundary on the fly. It is then possible to simultaneously confine the signal frame boundary within a single step size while performing data detection and signal frame synchronization. Compared to conventional approaches, in addition to significantly improving the accuracy of data detection, the proposed
JVSS algorithm can effectively perform signal frame
syn-chronization because it fully exploits the structure of the baseband signals of RFID systems. The proposed algorithm is therefore particularly useful in advanced RFID systems that transmit a large amount of information at a high data rate.
The rest of this paper is organized as follows.Section 2
introduces the system model of the backscatter modulation;
Section 3 reviews the matched filter and the edge detector for baseband signal detection techniques of conventional
RFID interrogators;Section 4introduces the proposed JVSS
algorithm for joint data sequence detection and signal frame
synchronization; Section 5 presents computer simulation
results to support the validity of the proposed algorithm;
Section 6summarize the paper.
2. System Model
The communication protocol of the EPCglobal system is classified into a physical layer (PL) and a tag identification layer (TIL). The PL includes the employed data coding scheme and modulation waveforms whereas the TIL desig-nates the regulation required to establish the communication link between interrogator and tags. The operation of a
Continuous wave
Tag
Data
Tx.
Rx.
∼ OSC.
Baseband processing (J-Viterbi) Interrogator
Figure1: The block diagram of a RFID system.
RFID system begins with an inventory round in which fundamental parameters for the communication link, such as the symbol period and modulation scheme, are determined. Specifically, tags estimate the symbol period by measuring the temporal support of the training signal sent by the inter-rogator during the initiation of the inventory round. This training signal also provides the power source required by the circuit on passive tags to backscatter their reply messages via antennas. In this paper, we refer the communication mode from tags to interrogator as the backscatter mode. All information transmitted in the link is first processed by a baseband data-encoded scheme and then modulated by either the amplitude-shift keying (ASK) or the phase-shift keying (PSK). The backscatter mode of the EPCglobal system supports two types of the baseband data-encoding schemes: (1) The FM0 baseband scheme and (2) the Miller modulation. Both schemes employ the same baseband basis
functions but have different data-encoding rules to represent
the output data stream. Since the proposed JVSS algorithm is applicable to both baseband data-encoding schemes, this study uses the FM0 baseband scheme as the study case to describe the proposed JVSS algorithm.
2.1. The FM0 Baseband Signals. Figure 2(a)depicts the basis
functions and the state diagram representing the rule of the FM0 baseband data-encoding scheme. The key feature of the FM0 scheme is that it inverts the baseband signal phase at every symbol boundary. With this feature, during
each symbol period estimate T, tags use both s1(t) and
its inversion s4(t) −s1(t) to represent data-1 and both
s2(t) and its inversion s3(t) −s2(t) to represent
Basis waveforms: FM 0 symbols:
s1(t)
1
T t
s2(t)
1
−1
T t
s3(t)= −s2(t) s4(t)= −s1(t)
0
S2
0
S3
1
S1
1 S4
0
S2
S3
0
1
S4
0 1
1 0
S1
1
(a)
00
01
10
11
00
01
10
11 ˆ
T Tˆ
(b)
S1 S1
S2 S2
S3 S3
S4 S4
Data-1 Data-0
(c)
Figure2: (a) The basis functions and the state diagram of the FM0 baseband data-encoding scheme. (b) Examples of FM0 baseband signals for two-bit data sequences. (c) The trellis representation of the FM0 data encoding scheme.
with phase inversion at symbol boundary, the FM0 baseband scheme can be equivalently represented as a hidden Markov information source, as illustrated by the state diagram of the
Moore machine in Figure 2(a).This state diagram defines
four states, {S1,. . .,S4}, to represent the corresponding
baseband signals{s1(t),. . .,s4(t)}whereas the directed-links
between states denote the transition with the associated
triggering data-symbols. Figure 2(b) shows an example of
the modulated baseband signals of all possible two-bit data sequences. Complying with the boundary phase inversion, there are two possible baseband signals for each two-bit data sequence. Next, to conveniently illustrate the proposed
JVSS algorithm, the state diagram inFigure 2(a)can also be
2.2. The Received Signal at the Interrogator. In a large space, such as an airport or warehouse, where interrogator and tags are of several to several tens meters apart, electromagnetic waves transmitted between tags and interrogator experience
multipath propagation due to the reflection/diffraction
caused by the surrounding objects. The response of a wireless multipath channel can be expressed as
h(t)= l
alδ(t−τl), (1)
wherealdenotes the fading amplitude of thelth multipath
andτl represents the propagation delay. In the backscatter
communication mode, a signal propagating through the wireless multipath channel and received at the interrogator can be represented as
r(t)= N−1
k=0
st−kT∗h(t) +n(t), (2)
where s(t) ∈ {si(t)}4i=1, T denotes the symbol period
estimated at the tag and N is the number of data bits in
a signal frame. The additive noisen(t) is assumed to be a
white Gaussian process with zero mean and two-side spectral densityN0.
With a nominal symbol period T, the interrogator
recovers the backscatter data symbols from the receive signal. In this process, there are two key factors that dominate the accuracy of the recovered data. (1) Since precise clock
generators are generally not affordable for low-cost tags, and
especially passive tags, a symbol period bias T = T −
T always exists between tags and the interrogator; (2) the
channel responseh(t) will spread the waveform of each data
symbol in time if the bandwidth of the channel is less than that of the baseband signal s(t).Specifically, the effects of these two factors become obvious in advanced systems where a large amount of data symbols is transmitted at a high
data rate.Consequently, without handling these two factors
well, conventional RFID interrogators limit themselves to scenarios with low data rates and relatively less information being sent. The following subsection briefly reviews two conventional data detection approaches, the matched filter and the edge detector. Both of these approaches are symbol-based algorithms and are widely used in current RFID systems. The subsequent section introduces the proposed sequence-based JVSS algorithm.
3. Conventional Interrogators
The matched filter uses a set of correlators each adopting a delayed basis function as its template to match the received signal over each symbol period. Each correlator consists of a multiplier and an integral and dump circuit. The output
signal, denoted as the correlation coefficient of the ith
correlator, can be expressed as
mi[l]= (l+1)T
lT r(t)si(t−lT)dt, i=1,. . ., 4. (3)
Accordingly, thelth data symbol can be decoded as the one
mapped to the most likely estimate of basis function with the
maximal correlation coefficient,
s[l]=arg max
si(t)
mi[l], (4)
wheres[l] denotes the basis function estimate during time
interval [lT, (l + 1)T]. Note that the integration for each
correlator is taken over the nominal period T = T +T,
which means that the performance of the matched filter
is greatly affected by the accumulated symbol period bias
(ASPB),{lT}l≤N. In other words, with anT, the matched
filter can survive only when the size of the signal frame,N, is limited to yield a trivial ASPB.
The other existing RFID signal detection approach is the edge detector, which senses the occurrence of the transition
edge on r(t) over each symbol time period to carry out
data detection.Figure 2(a)shows that the waveform of the
data-0 has a transition edge imposed at the middle point of the symbol period whereas the waveform of the data-1 remains constant. Compared to the matched filter, the edge detector is relatively easily implemented since it uses only a single integrator to sense the occurrence of the transition edge. However, the main drawback of the edge detector is its extreme sensitivity to noise perturbation, even if there is no symbol period bias.
Apparently, without handling the ASPB or the waveform distortion induced by the wireless channel, both the matched filter and the edge detector are not applicable to advanced RFID systems transmitting a large amount of information at a high data rate. To this end, by fully exploiting the structure of the FM0 basis functions, the following section proposes a maximum likelihood sequence estimation-based (MLSE-based) algorithm for joint data detection, symbol boundary self-calibration, and signal frame synchronization. This algorithm can optimally solve the stringent problems encountered by an RFID interrogator.
4. The Optimum Interrogator
4.1. The Viterbi Algorithm. The Viterbi algorithm [9, 10], with practically acceptable complexity, is used to find the most likely sequence of hidden states that results in a sequence of observed events, especially in the context of Markov information sources. The algorithm makes a number of assumptions. (1) Both the observed events and hidden events must be in a time sequence; (2) these two sequences must be aligned, and an instance of an observed event must correspond to exactly one instance of a hidden event; (3) computing the most likely hidden sequence up to a certain
stage n must depend only on both the observed event at
stage nand the most likely sequence at the previous stage
n−1. Obviously, all the above conditions are satisfactory to
the signal sequences generated by the FM0 data encoding
scheme as Figure 2(a) illustrates. The following section
briefly reviews the Viterbi algorithm and then presents the JVSS algorithm as an extension of the Viterbi algorithm.
Given the received signal r(t) in (2) and assuming
problem can be expressed as optimization of the posteriori probability
max
s P(r(t)|s), (5)
wheresdenotes the signal vector defined as
s= ⎡ ⎢ ⎢ ⎢ ⎢ ⎢ ⎢ ⎣
s(t) s(t−1)
.. . s(t−(N−1)T)
⎤ ⎥ ⎥ ⎥ ⎥ ⎥ ⎥ ⎦
. (6)
With white Gaussian noise contamination and a suffi
-ciently broad channel bandwidth, and by taking logarithmic operation, (5) can be rewritten as
min
s
−logP(r(t)|s)=min
s
⎧ ⎨ ⎩−
N−1
l=0
logP(rl|s(t−lT)) ⎫ ⎬ ⎭,
= N−1
l=0
max
s(t−lT) (l+1)T
lT r(t)s(t−lT)dt,
(7)
whererl r(t),t ∈ [lT, (l+ 1)T) is the receive waveform
segment during the lth symbol time period and s(t −
lT)∈ {si(t−lT)}4i=1. Apparently, solving (7) through brute
force exhaustive signal sequence searching is impractical due to its formidably high computational complexity, which
grows exponentially with the block length N. The Viterbi
algorithm provides an alternative way to reduce the overall complexity by recursively updating the sequence searching metrics during its execution.
The Viterbi algorithm can be represented in a finite-state trellis structure with weighted branches connecting the
states between time stages of execution. Figure 2(c) shows
that each state has two incoming branches from the dedicated initiating state of the previous time stage and two outgoing branches to the destination states of next time stage. For
convenience, we define Ψi as the set of initiating states,
with stateias their destination. For instance,Ψ1 = {2, 4},
andΨ3 = {1, 3}.In each time stage, each state recursively
updates the cumulative branch metric (CBM) of its incoming branches and retains the one with the largest CBM as the
survival branch. The CBM of the survival branch of statei
at time stagelis defined as
Vi[l]=max j
Vj[l−1] +mi[l]
; j∈Ψi, l=1,. . .,N−1.
(8)
The above process is iteratively repeated until the end of the signal frame. A survival path is then decided by choosing
the path contributing the largest CBM, arg maxiVi[N−1],
in the final time stage. Accordingly, the data sequence can be collectively determined by tracing the causes of branches on the survival path.
Although the decoding of the FM0 signal sequences, via the Viterbi algorithm, can be carried out in the sense of
Initialization:Tj[0]=T,∀j
S+1 s+
1(t)
S+2
s+2(t)
S−1
s−1(t)
s−2(t) S−2
Tj[l−1]−μT
Tj[l−1]
Tj[l−1] +μT
Tj[l−1]−μT
Tj[l−1]
Tj[l−1] +μT
Figure 3: Basis waveforms with dynamically adjusted temporal supports for generating the substates of the JVSS algorithm.
the MLSE, which reaps a power gain over the conventional symbol-based approaches such as the matched filter and the edge detector. However, the presence of symbol period bias can not be alleviated by simply applying the traditional Viterbi algorithm. To solve this problem, the next subsection proposes a novel Viterbi-based algorithm that can simul-taneously perform MLSE, symbol boundary compensation, and data frame synchronization using the proposed jiggling substate technology.
4.2. The Jiggle-Viterbi Algorithm with Substate Selection (JVSS). To trace and compensate for the symbol boundaries simultaneously, we propose a state jiggling technique in which each state of the aforementioned Viterbi algorithm is extended to a group of two substates, including a dilated and a shrunk substate, each of which corresponds to a variant FM0 baseband signal. These variant FM0 baseband signals are defined by extending FM0 signals with adjustable
dynamic symbol periods (DSPs). The DSP of group i at
time l is denoted by Ti[l], which is iteratively adjusted to
trace the symbol period bias.Besides the DSP, in every time
stage of execution, the JVSS algorithm equips each group
with a symbol boundary indicator (SBI), denoted as Δi[l]
for group i.In addition to catching the symbol boundary
difference, both the DSP and SBI help the JVSS algorithm
to restrict the deviation of the data frame boundaries within
a single step size μT, making it possible to achieve data
frame synchronization.Figure 3illustrates the variant FM0
baseband signals and their corresponding substates. By using an increment step sizeμT, the dilated substateS+i inFigure 3
uses the dilated basis function s+
i(t), with period Ti[l] =
calculation. On the other hand, the shrunk substate S−i
in Figure 3 uses s−i(t), with period Ti[l] = Tj[l−1] −
μT, as the reference basis function. Note that the dynamic
symbol period in timelis iteratively updated according to its
previous value,Tj[l−1] withj∈Ψi.With this arrangement,
the temporal support of the basis functions used in this study may vary greatly. This allows the JVSS algorithm to trace the symbol period bias. The basic idea behinds the JVSS algorithm is to take advantage of the substates, in conjunction with the adjustable DSP and the SBI to jointly detect the data sequence and trace the symbol boundaries on the fly.
The execution of the JVSS algorithm is controlled by (1) the survival substate determination of each group;
(2) the decision of the DSP Ti[l]; (3) the modification
of the SBI Δi[l]. Figure 4 illustrates the execution using a
modified trellis diagram, in which, for easy identification, the substates of each group are enclosed by a dashed rectangular box whereas survival branches being of solid arrows. This figure shows that, starting from the very beginning time stage 0, we assume the dilated substates{Soj[0]}4j=1 = {S+j}4j=1are
the initial substates and the DSPs and SBIs are initialized
toTj[0] = T andΔj[0] = T, for all j.Next, in time stage
1, each group of substates calculates the CBM using the associated basis functions
V+
j,i[1]=m+j,i[1]=
Δj[0]+Tj[0]+μT
Δj[0]
r(t)s+ i
t−Δj[0]
dt,
j∈Ψi,
V−j,i[1]=m−j,i[1]=
Δj[0]+Tj[0]−μT
Δj[0]
r(t)s−i
t−Δj[0]
dt,
j∈Ψi,
(9)
whereV+
j,i[1] represents the CBM of the branch fromSoj[0]
to the substateS+
i at time stage 1, whileVj−,i[1] represents the
CBM of the branch fromSoj[0] toS−i . Notice that the CBMs
in (9) are integrated over the adjustable intervals defined by the SBIΔj[0], the DSPTj[0], and the step sizeμT. According
to these CBMs, within each group of substates, only the survival substate, with the largest CBM, can be retained, and the others are discarded. We denote the largest CBM of groupiat time stage 1 as
Vo
i[1]=max j∈Ψi
V+
j,i[1],Vj−,i[1]
, ∀i, (10)
and the corresponding survival substate can be represented as
So i[1]=
⎧ ⎪ ⎨ ⎪ ⎩ S+
i, ifVio[1]∈
V+ j,i[1]
j∈Ψi,
S−i, ifVio[1]∈
V−j,i[1]
j∈Ψi,
∀i. (11)
For instance, with assumed magnitudes of CBMs, Figure 4
shows thatSo1[1]=S+1andSo2[1]=S−2. Intuitively, instead of
using all the substates within a group to take part the execu-tion of the JVSS algorithm, the determinaexecu-tion of the survival
substate can substantially mitigate the computational com-plexity via reducing the number of working substates.
After the survival substate determination, to help specify the symbol boundary of next CBM calculations, according to Soi[1] the SBI and the DSP in time stage 1 are updated by
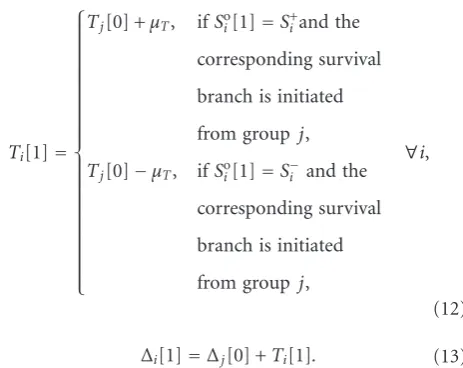
Ti[1]= ⎧ ⎪ ⎪ ⎪ ⎪ ⎪ ⎪ ⎪ ⎪ ⎪ ⎪ ⎪ ⎪ ⎪ ⎪ ⎪ ⎪ ⎪ ⎪ ⎪ ⎪ ⎪ ⎪ ⎪ ⎨ ⎪ ⎪ ⎪ ⎪ ⎪ ⎪ ⎪ ⎪ ⎪ ⎪ ⎪ ⎪ ⎪ ⎪ ⎪ ⎪ ⎪ ⎪ ⎪ ⎪ ⎪ ⎪ ⎪ ⎩
Tj[0] +μT, ifSoi[1]=S+iand the
corresponding survival
branch is initiated
from group j,
Tj[0]−μT, ifSoi[1]=S−i and the
corresponding survival
branch is initiated
from group j,
∀i,
(12)
Δi[1]=Δj[0] +Ti[1]. (13)
Figure 4also shows some updates of the DSPs and the SBIs as time proceeds. The above processes are repeated until the end of the data frame, where, with the maximal CBM, a survival path is determined, and the data sequence is then detected as in the conventional Viterbi algorithm. The final value of the SBI can then be used as the estimate of the signal frame boundary, achieving signal frame synchronization.
The basic idea behind the proposed algorithm is to fix the accumulative symbol period bias (ASPB) problem by using a basis waveform with adjustable temporal support in the calculation of the CBM. In a low noise contamination scenario, the JVSS algorithm can always correctly update its symbol boundary indicator (SBI) and the dynamic symbol period (DSP) at each time stage. An intuitive way for the determination of the step size is that the accumulated value of the SBI at the final stage of the JVSS algorithm must be greater than the accumulated ASPB value
N−1
k=1
kμT ≥Nmax, (14)
wheremaxdenotes the tolerance of symbol period bias of the
JVSS algorithm. Therefore, the step size to generate the basis waveforms of jiggle substates is
μT≥
2max
N . (15)
The overall procedures of the JVSS algorithm are
sum-marized inAlgorithm 1.
The J-Viterbi with substate selection (JVSS)
Stage 0 Stage 1 Stage 2
T1[1]=T4[0] +μT
Δ1[1]=Δ4[0] +T1[1]
T1[2]=T1[1]−μT
Δ1[2]=Δ1[1] +T1[2] S+1 V◦
1[1]
S◦1[1]=S+1 S−1
T2[1]=T2[0]−μT
Δ2[1]=Δ2[0] +T2[1]
S+ 2
S◦2[1]=S−2 S−2 V2◦[1] T3[1]=T1[0] +μT
Δ3[1]=Δ1[0] +T3[1] S+
3 V3◦[1]
S◦3[1]=S+3 S−3
T4[1]=T3[0]−μT
Δ4[1]=Δ3[0] +T4[1] S+4
S◦4[1]=S−4
S−4
V4◦[1]
S+1
S◦1[2]=S−1 S−1 V1◦[2] T2[2]=T2[1] +μT
Δ2[2]=Δ2[1] +T2[2] S+
2 V
◦
2[2]
S◦2[2]=S+2 S−2
T3[2]=T4[1]−μT
Δ3[2]=Δ4[1] +T3[2] S+
3
S◦3[2]=S−3 S−3 V3◦[2] T4[2]=T3[1]−μT
Δ4[2]=Δ3[1] +T4[2] S+
4
S−4 S◦4[2]=S−4
V4◦[2] S◦1[0] :
Δ1[0]=0 T1[0]=T
S◦2[0] :
Δ2[0]=0 T2[0]=T
S◦3[0] :
Δ3[0]=0 T3[0]=T
S◦4[0] :
Δ4[0]=0 T4[0]=T
V4+.1[1]
V2−.2[1]
V3−.4[1]
V3−.4[2]
V1−.1[2]
V+ 2.2[2]
V4−.3[2]
+
+
+
+
+ +
−
+
− −
+ +
−
+
− −
+
− −
+ +
−
+
+ −
+
− −
· · ·
· · ·
· · ·
· · ·
Figure4: Illustration of the JVSS algorithm.
of the succeeding CBM calculation. On the other hand,
adjustable DSPs can effectively alleviate the accumulation of
symbol period bias.
Remark 2. The proposed JVSS is a blind algorithm which
requires no information about the channel response h(t).
Although the fading effect of the wireless channel may reverse
the phase of the transmit signal, the FM0 data encoding scheme, which uses two opposite waveforms to represent a single data symbol, makes itself resistant to the phase reversal.
Remark 3. With the trellis structure shown in Figure 4, the implementation of the JVSS incurs a computational
complexity linearly proportional to the product of the number of employed substates and the number of the elapsed time stages. Since in each time stage half number of totally 8 substates being selected by the substate selection scheme, each of the selected substate will execute 4 CBM calculations for the succeeding time stage. Therefore, the computational
complexity of the JVSS algorithm is about 16N CBM
calculations. However, the computational complexity can
be further reduced if the JVSS algorithm can be fulfilled by using only a portion of the original 4 groups. To do this, note that both s1(t) ands4(t) with phase negation of
the FM0 baseband signals represent a data-1, ands2(t) and
s3(t) are both corresponding a data-0. This implies that the
(1) Initialization: (1a) Let{So
i[0]}4i=1= {S+i}4i=1
(1b) SetVo
i[0]=0,Ti[0]=TandΔi[0]=0, for alli
(2) CBM calculation and survival substate determination for time stagesl≥1: (2a) CBM calculation:
V+
j,i[l]=Vio[l−1] +m+j,i[l]
V−j,i[l]=Vio[l−1] +m−j,i[l], ∀i, j∈Ψi wherem+
j,i[l] denotes the weight of the branch fromSoj[l−1] toS+i, whereas
m−j,i[l] is that of the branch fromSoj[l−1] toS−i; and are calculated as
m+
j,i[l]=
Δj[l−1]+Tj[l−1]+μT
Δj[l−1]
r(t)s+
i(t−Δj[l−1])dt,
m−j,i[l]=
Δj[l−1]+Tj[l−1]+μT
Δj[l−1]
r(t)s−i(t−Δj[l−1])dt.
(2b) Survival substate determination: Determine the largest CBMVo
i[l]=maxj∈Ψi{Vj+,i[l],V−j,i[l]}of groupiat time instancel, and the corresponding survival substate is
So
i[l]= ⎧ ⎨ ⎩
S+
i, ifVio[l]∈ {V+j,i[l]}j∈Ψi,
S−i , ifVio[l]∈ {V−j,i[l]}j∈Ψi, ∀
i.
(3) SBI and DSP modification:
Assuming that the corresponding survival branch is initiated from groupj, for each group the SBI of time instancelis updated by
Ti[l]= Tj[l−1] +μT, ifS
o
i[l]=S+i,
Tj[l−1]−μT, ifSoi[l]=S−i, ∀i; and the DSP is updated by
Δi[l]=Δj[l−1] +Ti[l], ∀i.
(4) Joint data sequence estimation and signal frame synchronization:
Repeat steps 2-3 for each time stage. The survival path is the one with the maximal final CBM max{Vo
i[N−1]}4i=1.Data sequence estimation is performed by
tracing the survival path on the trellis diagram, whereas the final value of the SBI is used to estimate the signal frame boundary.
Algorithm1: The JVSS algorithm.
to 8N CBM calculations by only employing the first two
groups with substates{S+
1,S−1,S+2,S−2}in the JVSS algorithm
and simply discarding the other two groups of substates. In doing so, the associated CBM calculations must be modified to the absolute versions as follows
m+ j,i[l]
=
Δj[l−1]+Tj[l−1]+μT
Δj[l−1]
r(t)s+i
t−Δj[l−1]
dt,
m−j,i[l]
=
Δj[l−1]+Tj[l−1]+μT
Δj[l−1]
r(t)s−i
t−Δj[l−1]
dt,
∀j,i∈ {1, or 2}.
(16)
Remark 4. As an alternative to the data-encoding scheme for the backscatter signals in the EPC-global standard, Miller-modulated subcarrier (or Miller encoding) uses the same basis functions, but with inverted logical meaning, as those of the FM0 scheme. To generate the transmitted waveform, the Miller encoding scheme first generates its baseband data
symbols by the transition diagram as shown in Figure 5,
and then the transmitted waveform is the product of these
baseband data symbols and a square wave at M times the
symbol rate. The valueMis specified in the Query command
that initiated the associated inventory round. Since the proposed JVSS algorithm is essentially applicable to any data encoding scheme directed by a transition diagram, the Miller-modulated subcarrier can thus be decoded via the JVSS algorithm by simply replacing the basis functions in the CBM calculations with the corresponding square-wave-modulated ones. The resultant CBM calculations can be represented as
m±j,i[l]
=
Δj[l−1]+Tj[l−1]+μT
Δj[l−1]
r(t)Π(t)s±i
t−Δj[l−1]
dt,
j,i∈ {1, 2, 3, 4}, (17)
whereΠ(t) denotes the associated square wave atM times
Miller encoding:
s1(t)
Data-0
s2(t)
Data-1
s3(t)= −s2(t) s4(t)= −s1(t)
S2
S3
S4 S1
1
1
1 0
1
0
0
Figure5: The Miller Encoding Scheme.
5. Computer Simulations
This section presents computer simulations to evaluate the performance of the proposed algorithm. Compared with the
conventional matched filter and edge detector, two different
scenarios, corresponding to a regular and a high data transmission rate, are employed to assess the accuracy of data detection and the signal frame synchronization capability of the JVSS algorithm. Both scenarios employ passive tags which backscatter the continuous waveform sent from the interrogator. All the computer simulations are conducted in their equivalent baseband models with the assumption of
zero carrier frequency offset between tags and interrogator
due to the use of backscatter communication. The prescribed
tolerance of the symbol period bias is set to be 2×10⁴ppm
of the nominal symbol time period, that is,max=0.02T.
Example 1 (the regular data rate case). This example uses a typical value of symbol time period of the EPC-Global
Generation 2 standard,T1 = 25μS, which corresponds to
a transmission rate of 40 K bits per second (bps). Consider a wireless channel of two multipaths with delaysτ1=0.8μS
andτ2 = 2.2μS, and the corresponding fading amplitudes
are assumed a1 = 0.88, and a2 = 0.83, respectively. The
wireless channel is thus equivalent to a low pass filter with an approximate coherent bandwidth of 454 KHz, which is significantly greater than that of the signal bandwidth 1/T1=
40 KHz.The symbol period bias is assumed T = 0.01T1,
or equivalently 104ppm. Ten thousands of independent
Monte Carlo trials are conducted, each with signal frame
size N = 20, and N = 500 data symbols, respectively.
For both cases, the step size of the JVSS algorithm is
chosen asμT =3×max/N.With the overestimated symbol
10−5
10−4
10−3
10−2
10−1
100
−5 0 5 10 15 20 25 30
JVSS,N=20 Matched filter,N=20 Edge detector,N=20
JVSS,N=500 Matched filter,N=500 Edge detector,N=500
Figure6: Comparisons of the BERs of the proposed algorithm with regular data rate.
period bias (i.e., T = T1+T), shown in Figure 6is the
comparison of the bit error rate (BER) curves of the proposed JVSS algorithm to that of conventional approaches. It is indicated that, with a moderate number of data symbols
N = 20, all three algorithms can work properly since the
accumulation of the mismatched symbol duration causes
trivial effects on the accuracy of signal detection. Also, the
proposed JVSS algorithm possesses about 4-dB power gain over the matched filter. On the contrary, as the number
of data symbols increases, for the case of N = 500, the
performance of conventional detectors is seriously affected
by the accumulation of symbol period biases. On the other hand, the proposed JVSS algorithm, when dealing with large size of signal frame, is the only survivor due to its superior self-calibration capability on tracing symbol boundaries.
Example 2 (the high data rate case). This example uses
almost the same scenario settings as those inExample 1but
adopts a smaller symbol periodT2 = 1.56μS which
corre-sponds to a frequency bandwidth of 640 KHz. Apparently, this bandwidth is broader than the coherence bandwidth of the wireless channel. The short channel bandwidth gives rise to channel distortion, which smears the transmitted
signals on their temporal supports. Shown in Figure 7 is
the comparisons of BERs of the proposed JVSS algorithm, the matched filter and the edge detector, respectively. This figure shows that the proposed JVSS algorithm can not only
cope with the ASPB effect but also robust to against the
pulse deformation caused by the bandlimited channel. Also as shown in the figure, even in the case of small size of signal
frame,N = 20, the conventional approaches are seriously
10−4
10−3
10−2
10−1
100
−5 0 5 10 15 20 25 30
JVSS,N=20 Matched filter,N=20 Edge detector,N=20
JVSS,N=500 Matched filter,N=500 Edge detector,N=500
Figure7: Comparisons of the BERs of the proposed algorithm with high data rate.
10−4
10−3
10−2
10−1
MSE
(
T
)
−5 0 5 10 15 20 25 30
SNR (dB)
N=20
N=500
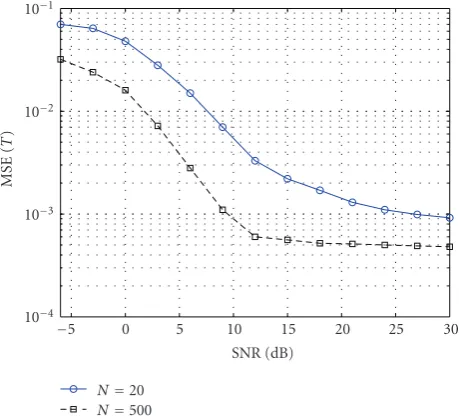
Figure8: The synchronization error of the JVSS algorithm with various frame sizes,N=20 andN=500, respectively.
Figure 8shows the performance evaluation of the JVSS algorithm for signal frame synchronization. As the mea-sure criterion, the mean square error (MSE) of the sig-nal frame boundary is defined as the averaged absolute
difference between SBI and its nominal value, MSE =
(1/K)Ki=1|Δsi[N−1]−(N−1)T2|/T2, in whichΔsi[N−1]
denotes the final value of SBI on the survival path of theith
trial, and K = 1000 is the total number of Monte Carlo
trials. As shown in the figure, for both cases of N = 20
andN = 500, the proposed approach can effectively trace
the symbol boundaries and make the symbol frame being
synchronized within the scale of step size μT. In addition,
the synchronization error of the signal frame of the JVSS algorithm can be mitigated with an increased sequence
lengthN.Compared to conventional approaches, due to the
ASPB, both the matched filter and the edge detector have a
synchronization error ofNεT that remains constant and is
therefore not illustrated inFigure 8for simplification.
6. Conclusions
This paper proposes a novel MLSE-based algorithm for joint signal frame synchronization and data detection in an RFID system. The proposed algorithm fully exploits the structure of the baseband signal of the EPC-Global Gen-2 standard to develop a trellis representation of the FM0 data encoding scheme which makes the realization of the Viterbi algorithm on the FM0 scheme feasible. In addition, by inflating or deflating the waveform of FM0 baseband signals, the
JVSS algorithm can effectively trace the boundaries of data
symbols during its execution. Computer simulations show that, compared to conventional approaches, the proposed JVSS algorithm has significantly higher accuracy in data detection, superior capabilities in signal frame synchroniza-tion and is robust against bandlimited channel distorsynchroniza-tion. With these features, we conclude that the proposed algorithm is particularly useful to RFID systems with large amount information to be sent in high transmission data rate.
References
[1] V. Chawla and D. S. Ha, “An overview of passive RFID,”IEEE Applications and Practice, vol. 45, no. 9, pp. 11–17, 2007. [2] S. Preradovic, N. C. Karmakar, and I. Balbin, “RFID
transpon-ders,”IEEE Microwave Magazine, vol. 9, no. 5, pp. 90–103, 2008.
[3] J. L. M. Flores, S. S. Srikant, B. Sareen, and A. Vagga, “Performance of rfid tags in near and far field,” inProceedings of the 7th IEEE International Conference on Personal Wireless Communications (ICPWC ’05), pp. 353–357, January 2005. [4] S. R. Aroor and D. D. Deavours, “Evaluation of the state of
passive UHF RFID: an experimental approach,”IEEE System Journal, vol. 1, no. 2, pp. 168–176, 2007.
[5] I. Mayordomo, R. Berenguer, A. Garcia-Alonso, I. Fernandez, and ´I. Gutierrez, “Design and implementation of a long-range rfid reader for passive transponders,”IEEE Transactions on Microwave Theory and Techniques, vol. 57, no. 5, pp. 1283– 1290, 2009.
[6] A. Safarian, A. Shameli, A. Rofougaran, M. Rofougaran, and F. De Flaviis, “RF identification (RFID) reader front ends with active blocker rejection,”IEEE Transactions on Microwave Theory and Techniques, vol. 57, no. 5, pp. 1320–1329, 2009.
[7] K. Finkenzeller,RFID Handbook: Fundamentals and Applica-tions in Contactless Smart Cards and Identification, John Wiley & Sons, New York, NY, USA, 2nd edition, 2003.
[8] EPCglobal, “EPCTM Radio-Frequency Identity Protocols Class-1 Generation-2 UHF RFID Protocol for Communica-tions at 860 MHz–969 MHz Version 1.1.0,” December 2005. [9] A. J. Viterbi, “Convolutional codes and their performance in
[10] S. Lin and D. J. Costello,Error Control Coding: Fundamentals and Applications, Prentice-Hall, Englewood Cliffs, NJ, USA, 1983.