IAIN D. LEIGHTON, JOHN F. HIEMSTRA AND CHRISTOPH T. WEIDEMANN
Leighton, I. D., Hiemstra, J. F. & Weidemann, C. T. 2013 (April): Recognition of micro-scale deformation structures in glacial sediments – pattern perception, observer bias and the influence of experience.Boreas, Vol. 42, pp. 463–469. 10.1111/j.1502-3885.2011.00246.x. ISSN 0300-9483.
It is a scientist’s mission to try to remain unbiased. However, certain factors play a role in scientific analyses that are not controlled by conscious thought. These factors are potentially very important in areas of science where interpretations are based on a scientist’s ability to identify patterns or structures. One such area is the micromor-phology of glacial sediments. In this paper we investigate the role of an analyst’s experience in relation to pattern perception with specific reference to turbate microstructures in glacial diamictons. An experiment was conducted on 52 participants, which demonstrated that, as may be expected, more experienced (glacial) micromorphologists tend to exhibit a higher sensitivity-to-signal, but that complete novices, if given clear instructions, can reach levels of sensitivity similar to those of experts. It also showed, perhaps more surprisingly, that response bias does not decrease with experience. We discuss psychological factors, such as the drive for success and consistency, that may have contributed to these results and investigate their possible implications in the micromorphological analysis and interpretation of glacial sediments.
Iain D. Leighton (e-mail: [email protected]) and John F. Hiemstra (e-mail: [email protected]), Department of Geography, College of Science, Swansea University, Singleton Park, Swansea SA2 8PP, UK; Christoph T. Weidemann (e-mail: [email protected]), Department of Psychology, Swansea University, Singleton Park, Swansea SA2 8PP, UK; received 23rd September 2011, accepted 22nd December 2011.
The subglacial environment still presents glaciologists and glacial sedimentologists with a great challenge. Owing to its inaccessibility, the understanding of proc-esses operating at the ice-bed interface and within the glacier substrate is still incomplete, and – as a conse-quence – how, and to what extent, such processes control ice dynamics can sometimes only be guessed at. Given the lack of in situ observations and measure-ments from modern glacial environmeasure-ments, palaeoglaci-ologists have tried to draw inferences from past glacial sedimentary records. A technique that has been very successful in the interpretation of such palaeorecords is micromorphology, or the study of thin sections (cf. Hiemstra 2006). Micromorphology has proved particu-larly successful in distinguishing between different glacial diamictons, particularly between those that, when viewed with the naked eye, appear identical. When viewed through the microscope, however, many of these apparently massive diamictons show micro-scale features that are indicative or even diagnostic of certain processes, thus allowing interpretations to be made.
Within this approach it is imperative that observa-tions are accurate and that the micro-scale features referred to are identified for what they are or represent. One micro-structure that is generally taken as compel-ling evidence for (subglacial) deformation of glacial diamictons is the turbate micro-structure. It consists of a circular (or partly circular) arrangement of often silt- or sand-sized grains. Long axes of these fine grains may be aligned with the overall circular shape, while the
structure may or may not contain a coarser ‘core’ grain in its centre. Turbate structures, often hundreds of micrometres, and occasionally up to several millimeters, in diameter, are thought to reflect micro-scale rotational movements of rigid elements within a deforming plastic or viscous sediment that re-align small grains in their vicinity (van der Meer 1993, 1997). Studies that have referred to turbate micro-structures in this context include but are not limited to Hiemstra & Rijsdijk (2003), Carret al. (2006), Hart (2006), Phillips (2006), Larsen et al. (2007), Kilfeather et al. (2010), Menzies
et al. (2010) and Menzies & Ellwanger (2011).
There is an inherent human element associated with micromorphological analysis. Although there have been attempts to quantify or automate certain aspects (see Stroeven et al. 2005; Zaniewski & van der Meer, 2005; Larsenet al. 2007; Phillipset al. 2011; Reinardy
et al. 2011), informed judgments by an observer or observers remain the basis of the method. It is there-fore crucial to consider to what extent these judgments may be skewed by limitations of human perception, decision-making or categorization, and to what extent such limitations may be mitigated by experience.
Performance in detection tasks can be evaluated with respect to the observer’s (or analyst’s) sensitivity-to-signal (i.e. the ability to discriminate the presence versus the absence of a signal) and specificity or response bias (i.e. the general tendency to make a posi-tive response when asked to carry out a survey task). In the case of human observers, both of these aspects could, in principle, change with experience. For
DOI 10.1111/j.1502-3885.2011.00246.x © 2012 The Authors
example, sensitivity may increase with experience, or experience may lead to an increasingly neutral response bias (see below). In the present study, we test human observers’ ability to detect turbate micro-structures (the signal, or stimulus) in photomicrographs (the trials) of glacial diamictons and evaluate how this ability is influenced by experience. In an effort to fully characterize detection performance, we go beyond simply investigating detection accuracy by characteriz-ing observers’ performance in terms of sensitivity and response bias.
Signal detection theory and
glacial micromorphology
Responses in (visual) detection tasks can be classified as ‘hits’ (correct detections of a signal), ‘misses’ (failures to detect a signal), ‘false alarms’ (erroneous detections, i.e. positive responses in the absence of a signal) and ‘correct rejections’ (negative responses in the absence of a signal). In detection experiments, as routinely used in the field of psychology, the total proportion of trials containing the signal is known, and thus detection per-formance can be fully described with only one of the response proportions from trials with and without a signal (usually, hits and false alarms). Deriving indices of sensitivity and response bias from hits and false alarms requires assumptions about relevant perceptual and response processes. Signal Detection Theory (SDT; Green & Swets 1966) represents a popular framework for evaluating performance in detection tasks in terms of sensitivity and response bias. Although it has not been without critics (see Mueller & Weidemann 2008, for a review), it is well suited to the present study. In a
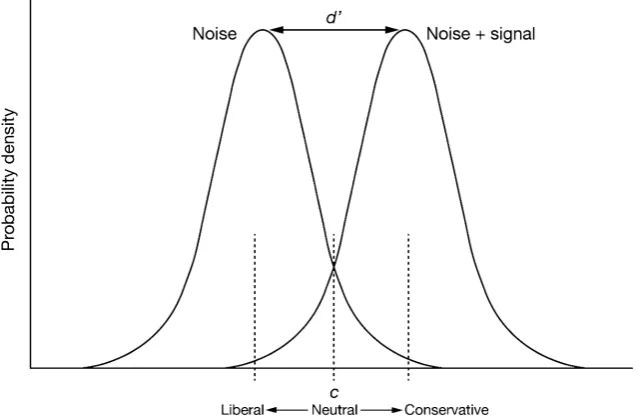
nutshell, SDT assumes that perception is noisy, such that multiple presentations of identical sensory input are likely to generate (slightly) different percepts (ance in sensory inputs further increases perceptual vari-ance). Thus trials containing a signal (plus noise) give rise to a distribution of percepts that can overlap with the distribution of percepts from trials without a signal (noise alone; Fig. 1). In its simplest form, SDT assumes that percepts for trials with and without a signal are distributed normally with equal variance along a rel-evant dimension in perceptual space. A response crite-rion (cin Fig. 1) then maps percepts to responses and the placement of this response criterion determines the specificity, or response bias. A liberal response criterion leads to many positive responses and therefore ensures a high hit rate (at the cost of a high false alarm rate). In this scenario one would expect a larger number of signals (in our experiment: turbate micro-structures) to be identified, both correctly and incorrectly. A con-servative response criterion, on the other hand, leads to few positive responses, thus reducing the number of false alarms, but also reducing the number of hits. In other words, the total number of identified turbate micro-structures would be low, minimizing the mis-taken classification of samples that do not contain such micro-structures. However, in this case, the analyst also runs the risk of dismissing crucial evidence when it comes to the interpretation of the sediment in question and is likely to miss turbate micro-structures in the sample. How hits and false alarms trade off across different placements of the response criterion is deter-mined by the overlap between the sensory distributions for trials with and without a signal. In short, the observ-er’s sensitivity increases as the overlap between these distributions decreases (Fig. 1; Green & Swets 1966).
that the calculation ofd⬘consists of taking the inverse normal transformation of the hit and false alarm rates and subtracting the latter from the former, as shown in Equation (1):
′ =
( )
−( )
d Z H Z F , (1)
whereZ(x) denotes the inverse normal (‘Z’) transfor-mation andHandFdenote the hit and false alarm rates respectively.
This measure gives the distance between the two perceptual distributions (for trials with and without signal; see Fig. 1) in units of their standard deviation. In other words, ad⬘score of 1 implies that the mean of the distribution of percepts corresponding to observa-tions containing a signal (e.g. turbate micro-structures) is one standard deviation larger than that correspond-ing to observations not containcorrespond-ing a signal. The greater the distance between these distributions (d⬘), the smaller their overlap and hence, all else being equal, the smaller the proportion of misclassified samples. The exact proportions of hits and false alarms are then determined by the placement of the decision criterion
c(Fig. 1). Effectively,ccan be thought of as a thresh-old on the strength of the percept such that every time a percept exceeds this threshold (loosely corresponding to it ‘looking enough’ like a signal), the corresponding sample is classified as containing the signal. The crite-rion c is calculated by multiplying the sum of the
Z-transformed hit and false alarm rates by -0.5, as shown in Equation (2):
c= −0 5.
{
Z H( )
+Z F( )
}
, (2)whereZ(x) denotes the inverse normal (‘Z’) transfor-mation and H and F denote the hit and false alarm rates respectively.
The criterioncmeasures the response bias relative to an ideal observer: a neutral value of 0 implies that equal priority is given to the minimization of misses and false alarms (Fig. 1). Negative values for c correspond to liberal observers and imply that misses are dispropor-tionately reduced at the cost of higher false alarm rates (Fig. 1). Conversely, positive values for c indicate a conservative response bias that reduces false alarms at the cost of more misses (Fig. 1). Further comprehensive reviews on signal detection and measures of sensitivity and response bias are offered by Green & Swets (1966), Macmillan & Creelman (1990), McNicol (1972) and Monk & Eiser (1980).
either containing turbate micro-structures (signal plus noise) or not (noise alone).
Participants
Fifty-two participants were recruited through word of mouth. Participants were asked to rate their own expe-rience levels, differentiating between microscopic work in general and the analysis of turbate micro-structures in particular. Relative four-point scales were used, with ‘1’ indicating ‘no experience’ and ‘4’ indicating ‘a high level of experience’. We added up the scores from these ratings to obtain an overall measure of experience. Par-ticipants were subsequently grouped as follows: those with ‘No experience’ (complete novices, 2 points, 12 participants), ‘Beginners’ (3–4 points, 20 participants), those with ‘Moderate’ levels of experience (5–6 points, 12 participants), and those with high levels of experi-ence (referred to as the ‘Expert’ group hereafter; 7–8 points, 8 participants).
Trials
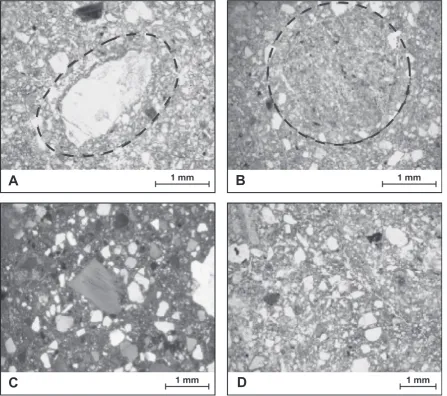
The selection of trials for the experiment occurred fol-lowing a process in which five people with various levels of experience (and who did not participate further in the experiment) were asked to establish for ~80 phot-omicrographs whether they contained a signal or not. Only those trials for which there was unanimous agree-ment among the five observers were included in the study. This procedure resulted in a set of 45 trials – 21 with a turbate micro-structure (noise plus signal) and 24 without a turbate micro-structure (noise alone, no signal). The 45 photomicrographs were presented in a standard rectangular format (same aspect ratio for all). Figure 2 shows examples for both categories.
Procedure
significantly, while the number of satellite grains is irrelevant. The only requirement is that long axes of most satellite grains describe a circular or elliptical pattern and/or show positions parallel to the surface of the core.’
Following the instruction, photomicrographs were presented one at a time, and participants were asked to indicate on a form whether or not the respective photomicrograph contained a turbate micro-structure before the next photomicrograph was shown. The order of photomicrographs was determined by random number generation (Haahr 1998) and was kept the same for all participants.
Results
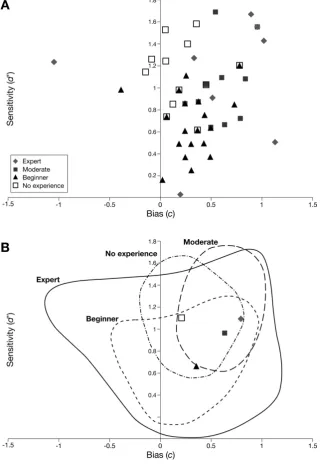
Figure 4A shows sensitivity and bias data for indi-vidual participants. Figure 4B shows the envelopes encompassing clouds of data points per experience group. Also indicated in Fig. 4B are the means per experience group (calculated using absolute values ofc; see Table 1). In the beginners group, two participants
A
B
C
D
Fig. 2. Examples of photomicrographs used in the experiment. Turbate micro-structures in images A and B are indicated (trials with signal and noise – annotations not in original images). Images C and D are examples of trials without signal (just noise, no turbate micro-structure).
scored negatived′-values. Given that chance
perform-ance (i.e. pure guessing) would correspond to ad′-value
of 0, a negative value may be expected to represent either a capable participant’s deliberate attempt to perform poorly, or a participant’s misunderstanding
of instructions. In any case it indicates a lack of com-pliance with the instructions, which is why the data from these two participants were excluded from the analyses.
The second thing to note is that in the Expert group, one participant showed a particularly low (negative)c-value, that is, a very liberal response bias. This is an interesting result that will be discussed further below.
To assess whether the respective experience groups differed statistically in sensitivity d′and bias c, sepa-rate analyses of variance (ANOVAs) were conducted for these two dependent variables (we adopted the common significance level ofa=0.05 for all tests). It was
Fig. 4. Biascversus sensitivityd′. A. All data. B. Envelopes highlight the ranges within experience groups. Also indicated are the absolute means. For further explanation see text.
Table 1. Mean and standard deviation: bias, sensitivity and absolute bias per experience group (mean and standard deviation).
Group d⬘ c |c|
found that sensitivity and bias differed significantly across levels of expertise (F[3, 46]=5.709,MSE=0.709,
p=0.002 and F[3, 46]=2.997, MSE=0.369, p=0.040, respectively). By investigating absolute bias, which also differed significantly between groups (F[3, 46]=11.434,
MSE=0.586, p<0.001), it was confirmed that the
observed differences in ‘raw’ bias were not solely the result of differences in the bias ‘direction’. Sensitivity and absolute bias |c| also differed significantly be-tween groups that had any experience (i.e. when the No experience group was excluded; F[2, 35]=5.130,
MSE=0.691,p=0.011 andF[2, 35]=11.373,MSE=0.596,
p<0.001, respectively), and the difference in raw bias
between groups with any experience fell just short of statistical significance (F[2, 35]=2.487, MSE=0.351,
p=0.098).
Table 1 and Fig. 4 reveal that sensitivity was nomi-nally higher for the No experience group than for the Experts, but this difference was not found to be signifi-cant (t[18]=-0.280,SE=0.193,p=0.783; allp-values for
t-tests reported here are two-sided without corrections for multiple comparisons). Significant differences in sensitivity between pairs of groups were found to exist between the Experts and the Beginners (t[24]=2.680,
SE=0.161, p=0.013), between the Moderately experi-enced and the Beginners (t[28]=3.063, SE= 0.111,
p=0.005), as well as between the Beginners and the No experience group (t[24]=-4.624, SE=0.105, p<0.001). Raw bias only differed significantly between the Moderately experienced group and the two less experi-enced groups (t[22]=3.882, SE=0.095, p=0.001 and
t[28]=3.579, SE= 0.083, p=0.001 for the comparisons with the No experience group and the Beginners, respectively), whereas absolute bias differed signifi-cantly between the Experts and the No experience group (t[18]=4.109, SE=0.222, p<0.001), the Experts
and the Beginners (t[24]=4.332,SE=0.183,p<0.001), as well as between the Moderately experienced group and the Beginners (t[28]=3.746,SE=0.083,p<0.001).
Discussion
Figure 4B and Table 1 suggest a trend in sensitivity-to-signal d′ with increasing experience (Beginner – Moderate – Expert), as may be expected. This trend is confirmed to be statistically significant. However, there is also an apparent and statistically corrobo-rated increase of absolute bias (i.e. deviations from neutral) with experience, with particularly high inter-individual variability among the Experts.
Very interesting to note are the sensitivity and bias data for the complete novices (the No experience group). While the mean bias is nominally the lowest of all groups, the mean sensitivity value is nominally even higher than that of the Experts. Although one Expert showed an exceptionally low sensitivity (see Fig. 4A),
which obviously pulled down the mean of the entire group (Fig. 4B), the excellent performance of the com-plete novices is still noteworthy, particularly when compared with that of the Beginners and the group of Moderately experienced analysts. We postulate that the high sensitivity for the group without relevant experience is due to members of this group frequently referring back to the instructions – a strategy that may have mitigated and compensated for the lack of expe-rience. Informal questioning of participants after the experiment suggested that participants from this group indeed relied more heavily on the instructions during the course of the experiment. Following this reason-ing, participants with more experience may have over-estimated their abilities and not have ‘relied on’ the instructions to the same extent.
Participants showed a tendency to be conservative in their detection judgments. Across all experience levels, false alarm rates were in most cases significantly lower than miss (i.e. 1-hit) rates, which translated to positive values of bias, almost across the board. This overall conservative response bias might reflect participants’ evaluation of consequences of different types of error. We speculate that participants generally err on the side of caution, because they perceive that erroneously detecting a non-existent signal is worse than failing to detect a signal that is actually there. Only four partici-pants (see Fig. 4A) showed a negative (i.e. liberal) response bias. We did not find response criteria to be ‘more neutral’ for Experts than for participants with less experience. In fact, all participants with a near-neutral response bias were from either the No experi-ence or the Beginner group.
Participants from the Expert group exhibited both the most conservative and the most liberal response biases. This suggests that, in addition to the aforemen-tioned ‘cautious’ response, which seems to apply irre-spective of experience level, there are other factors that play a more prominent role with increasing experience. We propose that the heterogeneity of the learning history is one of these. Russo et al. (2008) demon-strated that a drive for consistency can be a primary forcing in the development of a preference or bias. Similarly, it has been shown by Holyoak & Simon (1999) that processes of subconscious human reasoning can lead to a positive reinforcement of an initial premise.
Conclusions
This study highlights the role that experience may play in the interpretation of thin sections of (glacial) sedi-ments. The results of our experiment suggest that expe-rience increases an observer’s sensitivity or ability to detect structures (here: turbate micro-structures). The experiment also demonstrates that expert levels of sen-sitivity can be obtained by complete novices, if they are provided with detailed instructions to which they can refer back during the identification process.
The results of the experiment suggest that decision-making can be controlled by psychological factors, including cautiousness – which would explain the obse-rved overall conservative response bias – and the drive for consistency. The results also suggest that the re-sponse bias may be amplified by previous experiences such as the learned base-rate of samples containing signals. Dependent upon how such experiences are pro-jected onto new detection tasks, and how an observer’s preference is developed, this may well lead to a distinctly conservative or liberal (i.e. non-neutral) response bias.
Whereas the outcome of our study is encouraging in that it confirms the prominent role of experience (and training) in improving detection performance, it also carries an implicit warning in that several psychological factors can affect an analyst’s perception of structures and detection judgments. Obviously, in the context of glacial micromorphology, a non-neutral response bias would lead to a higher number of erroneous interpre-tations of sediments than would be necessary based on the perceptual limits. We recommend therefore that, where possible, sediments are investigated by more than one analyst, and also that, rather than single micro-structures, a set of multiple micro-structures should serve as the basis for any interpretation.
Acknowledgements. –We would like to thank Irene Reppa for initial help in navigating the complex world of psychology. We also thank all participants in the experiment, as well as the people who helped to create the survey. Finally, we thank Jaap van der Meer and an anonymous reviewer for their comments on the first draft of this paper.
References
Carr, S. J., Holmes, R., van der Meer, J. J. M. & Rose, J. 2006: The Last Glacial Maximum in the North Sea Basin: micromorphologi-cal evidence of extensive glaciation.Journal of Quaternary Science 21, 131–153.
Hiemstra, J. F. 2006: Micromorphology of glacial sediments. In Elias, S. A. (ed.):Encyclopedia of Quaternary Science, 945–954. Elsevier, Amsterdam.
Hiemstra, J. F. & Rijsdijk, K. F. 2003: Observing artificially induced strain: implications for subglacial deformation.Journal of Quater-nary Science 18, 373–383.
Holyoak, K. J. & Simon, D. 1999: Bidirectional reasoning in decision making by constraint satisfaction. Journal of Experimental Psychology-General 128, 3–31.
Kilfeather, A. A., Ó Cofaigh, C., Dowdeswell, J. A., van der Meer, J. J. M. & Evans, D. J. A. 2010: Micromorphological char-acteristics of glacimarine sediments: implications for distinguishing genetic processes of massive diamicts. Geo-Marine Letters 30, 77–97.
Larsen, N. K., Piotrowski, J. A. & Menzies, J. 2007: Microstructural evidence of low-strain, time-transgressive subglacial deformation. Journal of Quaternary Science 22, 593–608.
Macmillan, N. A. & Creelman, C. D. 1990: Response bias – charac-teristics of detection theory, threshold theory, and nonparametric indexes.Psychological Bulletin 107, 401–413.
McNicol, D. 1972: A Primer of Signal Detection Theory. 240 pp. George Allen & Unwin, London.
Menzies, J. & Ellwanger, D. 2011: Insights into subglacial processes inferred from the micromorphological analyses of complex diamic-ton stratigraphy near Illmensee-Lichtenegg, Hochsten, Germany. Boreas 40, 271–288.
Menzies, J., van der Meer, J. J. M., Domack, E. & Wellner, J. S. 2010: Micromorphology as a tool in the detection, analyses and inter-pretation of (glacial) sediments and man-made materials. Proceed-ings of the Geologists Association 121, 281–292.
Monk, A. F. & Eiser, J. R. 1980: Simple, bias-free method for scor-ing attitude scale responses.British Journal of Social and Clinical Psychology 19, 17–22.
Mueller, S. T. & Weidemann, C. T. 2008: Decision noise: an expla-nation for observed violations of signal detection theory. Psycho-nomic Bulletin and Review 15, 465–494.
Phillips, E. R. 2006: Micromorphology of a debris flow deposit: evidence of basal shearing, hydrofracturing, liquefaction and rota-tional deformation during emplacement. Quaternary Science Reviews 25, 720–738.
Phillips, E. R., van der Meer, J. J. M. & Ferguson, A. 2011: A new ‘microstructural mapping’ methodology for the identification and analysis of microfabrics within glacial sediments. Quaternary Science Reviews 30, 2570–2596.
Reinardy, B. T. I., Hiemstra, J. F., Murray, T., Hillenbrand, C. D. & Larter, R. D. 2011: Till genesis at the bed of an Antarctic Peninsula palaeo-ice stream as indicated by micromorphological analysis. Boreas 40, 498–517.
Russo, J. E., Carlson, K. A., Meloy, M. G. & Yong, K. 2008: The goal of consistency as a cause of information distortion.Journal of Experimental Psychology-General 137, 456–470.
Stroeven, A. P., Stroeven, P. & van der Meer, J. J. M. 2005: Micro-fabric analysis by manual and automated stereological procedures: a methodological approach to Antarctic tillite.Sedimentology 52, 219–234.
van der Meer, J. J. M. 1993: Microscopic evidence of subglacial deformation.Quaternary Science Reviews 12, 553–587.
van der Meer, J. J. M. 1997: Particle and aggregate mobility in till: microscopic evidence of subglacial processes.Quaternary Science Reviews 16, 827–831.