https://doi.org/10.5194/nhess-18-3145-2018 © Author(s) 2018. This work is distributed under the Creative Commons Attribution 4.0 License.
Brief Communication: Measuring rock decelerations and rotation
changes during short-duration ground impacts
Andrin Caviezel1and Werner Gerber2
1WSL Institute for Snow and Avalanche Research SLF, 7260 Davos Dorf, Switzerland
2Swiss Federal Institute for Forest, Snow and Landscape Research WSL, 8903 Birmensdorf, Switzerland Correspondence:Andrin Caviezel ([email protected])
Received: 28 March 2018 – Discussion started: 16 May 2018 Accepted: 13 November 2018 – Published: 23 November 2018
Abstract. Rockfall trajectories are primarily influenced by ground contacts, causing changes in acceleration and rock ro-tation. The duration of contacts and its influence on the rock kinematics are highly variable and generally unknown. The lack of knowledge hinders the development and calibration of physics-based rockfall trajectory models needed for haz-ard mitigation. To address this problem we placed three-axis gyroscopes and accelerometers in rocks of various sizes and shapes with the goal of quantifying rock deceleration in natu-ral terrain. Short ground contacts range between 8 and 15 ms, longer contacts between 50 and 70 ms, totalling to only 6 % of the runtime. Our results underscore the highly nonlinear character of rock–ground interactions.
1 Introduction
A detailed understanding of object penetration into matter is essential from both a fundamental physics and geophys-ical point of view. The relevant timescale spans from high-speed impacts of kilometers per second in planetary science to centimeters per second or millimeters per second in lab-oratory experiments of intruder sinking into granular beds. There are many studies on penetration of objects into gran-ular media or coefficients of restitution (see Altshuler et al., 2014; Asteriou et al., 2012, and references therein). However, there is little understanding of processes arising from altered impact conditions, such as deviations from normal impact configurations, high rotational speeds of the impacting ob-ject, etc. Consequently, the understanding of the mechanics of rock–ground interactions poses a longstanding problem in rockfall engineering. This interaction defines the speed, jump
height and dispersion of falling rocks in natural terrain. Be-cause ground interaction controls rockfall runout distances and energy levels, it is the core problem when developing physics-based dynamic models for rockfall hazard mitigation and planning (Leine et al., 2014).
One approach to address the impact problematic is to use dendrogeomorphic techniques to asses rockfall frequency and distribution (Trappmann and Stoffel, 2015; Corona et al., 2017) and/or trajectory reconstruction via impact analysis (Paronuzzi, 2009; Saroglou et al., 2018). Hardly any data exist that directly measure rock–ground interactions during a rockfall event. A possible method to characterize ground impacts is to study surface scars left by falling rocks. For example, translational rock velocities can be determined by measuring the distance between ground contacts and the rel-ative slope angle between the contact points. For an initial estimation it can be assumed that the jump height will be about 1/10 of the jump distance on the slope. Based on such an assumption, a flight parabola is determined and the rele-vant velocities can be calculated (Gerber, 2015). If different jump heights are assumed, e.g., 1/8 or 1/12, the maximum velocities shortly before ground impact will change by less than 10 %. In many cases, this method suffices to obtain a rough estimate of the dissipative character of the ground in-teraction.
especially if the rock is “skipping” on the ground surface. Moreover, the analysis of rockfall traces provides little infor-mation of the mechanics of ground interaction, particularly if the relationship between the translational and rotational kine-matics of the rock are unknown.
Newer studies in penetration studies make use of emerg-ing microelectronic mechanical sensors to directly track the occurring motion (Sanchez-Colina et al., 2014; Gronz et al., 2016). Note that to date the major drawback of available multi-degree-of-freedom inertial measurements units (IMUs) is the range restriction to low accelerations (few tens ofg). Because the major application for such IMUs is unmanned aerial vehicle (UAV) flight control, resistance to and mea-surement capabilities of heavy impacts is not the main focus of chip makers.
In this paper, we present novel and detailed in situ mea-surements of high-impact ground interaction contact times, decelerations and changes in rock rotations using sensors in-serted inside the rock. The resulting three-dimensional mea-surements yield detailed insights into how rocks behave, both in flight and upon contact with the ground. The measure-ments guide towards how experimental field campaigns can be constructed to obtain the necessary data needed to cali-brate constitutive relationships for dynamic rockfall models. However, before any conclusions can be reached or any further calculations made based on the results, the measure-ments must be subjected to a quality check and verified. At present we have little idea of the degree of acceleration re-versal and change of rotational speed during impact, mak-ing it difficult to judge the accuracy of the measurements. Simple kinematic requirements must be fulfilled. For exam-ple, the acceleration measurements at rest must correspond to the value of gravitational acceleration and indicate a value of zero in free flight. The purpose of this brief communi-cation is therefore to elaborate on measurement frequencies and methods needed to capture the physical information re-quired to study rock–ground interaction in natural terrain. We believe this information is necessary to develop better trajec-tory models for rockfall hazard mitigation.
2 Methods of measurement and evaluation 2.1 Field studies
The rockfall tests were performed in natural terrain. The test site, located near Tschamut in the canton of Grisons, is a slope 50 m high with a maximum inclination of 42◦, run-ning down to a horizontal surface. The surface vegetation consists mainly of grass, with a few scattered shrubs in the upper, steeper part of the slope. The absence of tall vegeta-tion and relatively smooth terrain allow a clear observavegeta-tional view and make the Tschamut site ideal for conducting rock-fall experiments and filming the rocks’ movements. A release point at the top of the slope was selected, measured and used
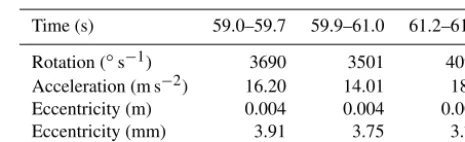
Table 1.Mean values of absolute rotational and acceleration data for calculating eccentricities.
Time (s) 59.0–59.7 59.9–61.0 61.2–61.9
Rotation (◦s−1) 3690 3501 4098
Acceleration (m s−2) 16.20 14.01 18.9
Eccentricity (m) 0.004 0.004 0.004
Eccentricity (mm) 3.91 3.75 3.70
to release the rocks by simple dropping (no or little initial translational velocity and initial spin). The release point was selected to accommodate the transport of rocks, facilitating experimental data sets of more than 50 releases on a single day (i.e., with the same ground conditions including temper-ature and moisture content).
We present the results of one out of more than 50 trajec-tories captured in a test series specifically designed to inves-tigate the role of rock shape on runout and dispersion; see Caviezel et al. (2018c, a). In this particular measured run, an artificially manufactured concrete block with an 0.3 m edge length and a mass of 44 kg was released. The symmet-ric and well-defined block shape was used as a control ge-ometry in the rockfall experiments. The rock’s corners and edges were pared back a quarter to make the block less dice shaped. A hole 68 mm in diameter was drilled through the block to accommodate the sensor. The block’s mass and vol-ume (0.019 m3) make it equivalent to a sphere with a radius of 0.165 m and a circumference of 1.04 m with a rock density of 2315 kg m−3.
2.2 Sensor
(a) (b)
(c) (d)
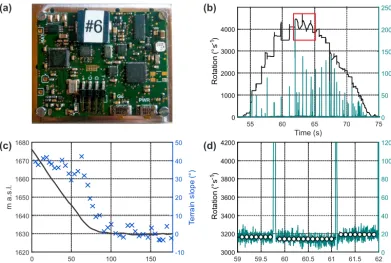
Figure 1. (a)An exposed micro-controller board hosting all the MEMS sensors, microSD card and a USB connector powered by a 1100 mA h
battery (both covered by the board).(b)Sensor data stream showing absolute rotational velocities and acceleration values during the 20 s
movement phase (from 54 to 74 s), the rectangle indicating range with one saturated axis.(c)Slope distance of the projected trajectory of
the stone with its location and slopes.(d)Absolute rotational velocities and acceleration values, plus mean acceleration values within the
intervals of impacts (white dots) for calculating eccentricity.
2.3 Quality analysis
Before the measurements can be processed, the raw data need to be verified. Assuming that the sensors are functioning properly, the raw data should be checked for the following criteria:
– The measuring range of each individual sensor should not be exceeded.
– When at rest, the rotational velocity should equal zero and the acceleration values should equal 1, correspond-ing to gravitational acceleration.
– During free fall, the rotational velocity should remain constant, with zero absolute acceleration; this analysis must be performed when there is relatively little rota-tion, the influence of centripetal acceleration will grow at higher rotational velocities.
– Theoretically, when rotational velocity is constant, if there is an offset with the sensors and the center of mass, the phenomenon of centripetal acceleration should re-sult in the measurement of higher values.
During free fall, the rotational velocities and acceleration values can then be correlated, representing the eccentrically
fitted sensor as the rock’s center of gravity. In physical terms, this relationship can be expressed by the formula Eq. (1):
Re=
aZ
ω2, (1)
whereReis the sensor’s eccentricity (m),aZthe centripetal acceleration (m s−2) andωangular velocity (rad s−1). In the-ory, rotational differences should result in the same eccen-tricities.
3 Results 3.1 General
Ground contacts are very clearly indicated by sharp peaks in the acceleration measurements and changes in rotational velocities. In steeper terrain, higher velocities and larger jump lengths lead to significantly fewer ground contacts than in the runout zone with roll-out behavior. Absolute rotation increases from an initial value of zero to 40500 degrees per second (◦s−1) before falling back to zero.
The maximum absolute acceleration value measured was 225g(at second 62.0). The rest of the measured values range below 140g, and many were even less than 50g(Fig. 1b).
4 Quality analysis procedure
The absolute rotational velocities and acceleration values were calculated and presented in the preceding section. The peak values of the individual measurements were checked. Due to the symmetry braking caused by the sensor hole, a main rotational axis exists that reaches the saturation limit between 62 and 64.6 s. This causes the resultant trace to pre-dominantly feature the oscillating mode of the two remaining axes highlighted with the box in Fig. 1b.
The sensors are specified to high-resolution capabilities of 0.122◦s−1in the case of the gyroscope and 0.195gfor the accelerometer. These values hold only when maximum sen-sitivity settings are used. In the used case, full-scale range is needed for both sensors; thus the measured deviations in-crease significantly. As described in Niklaus et al. (2017) these main deviations can be corrected via a linear correction functionf (x)=c0+c1·xfor each sensor axis. If applied,c0 is the dominant correction term for the accelerometer in the order of 0.15 to 3g. For the gyroscope,c1is dominant, being of the order of 0.09 % to 0.35 % from the ideal value of 1.0. Note that the measured offsets lie below 1 % of the full-scale range and thus can be neglected. For the presented trajectory the actual sensor offset at rest amounts to 4.5±0.1◦s−1and 1.17±0.48gas opposed to the ideal value of 1g.
The free-fall analysis of the measurements began immedi-ately after the initial motion, at 54.5 s. At this time its rotation is relatively low (180.5◦s−1) and its influence on the accel-eration value small. Equation (1) yields
aZ=Re·ω2=0.165·
180.5 360 ·π
2
=0.41 m s−2. (2) Eccentricity was analyzed between 59.0 and 61.9 s, ignor-ing data from the two intervenignor-ing ground contacts (Fig. 1d). The mean acceleration values within these three intervals are used to feed Eq. (1) and to determine the eccentricity ra-dius, which is virtually identical for all three time intervals, equalling 0.004 m (Table 1).
4.1 Duration of ground contacts
Ground contacts are clearly recognizable from the measured rotational and acceleration values. Very short ground con-tacts last 8–15 ms, medium-length concon-tacts 20–40 ms and
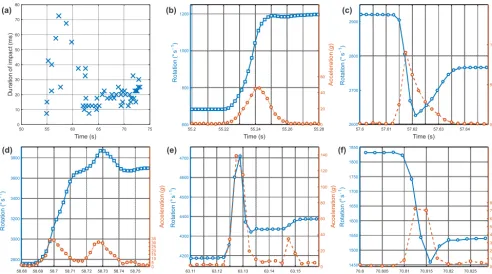
lengthy contacts 50–75 ms. During the first 2–3 s after the rock has been set in motion, the duration of ground contacts increases very quickly to the peak values and then drops back to values of 10–30 ms, remaining at this level on flat terrain (Fig. 2a). This corresponds to the intuitive understanding of more excessive scarring, that is deeper and longer ground penetration, of rocks with higher kinetic energy for a given soil softness. Remarkably, the total contact times that deter-mine the trajectory kinematics amount only to 14 % of the total trajectory time of 21 s, or if the roll-out section after the last recorded impact is excluded, to only 6 % of the total runtime.
4.2 Details of individual ground contacts
Individual results on absolute rotational and acceleration val-ues during ground contacts are presented below. Here, we classified a contact as the temporal evolution between two plateaus in angular velocity. A typical contact during the acceleration phase is shown in Fig. 2b. Rotational veloci-ties increase with almost every – relatively short – ground contact, as at 55.24 s. This contact lasted 42 ms at a maxi-mum acceleration of 45.6gand increased rotation from 683 to 10087◦s−1. This typical behavior in steep terrain implies that the rotation change is a function of the inclination of the slope. Here, the rotation increases with slope angles higher than 38◦and decreases under an inclination lower than 20◦.
The ground contact featured in Fig. 2c (which lasted 28 ms, starting at 57.62 s) exhibits larger accelerations of 90.0g while the rotation tipped from 20921 to 20766◦s−1, indicating an opposed faced obstacle within the acceleration path. Both ground contacts shown above have clear maxima in the accelerometer data. However, some contacts with two or even more maxima were also recorded. A relatively long ground contact occurred at 58.72 s, lasting 68 ms (Fig. 2d). During this time, two main acceleration maxima were mea-sured: 33.4 and 30.4g, respectively. During this ground con-tact, rotation increased steadily from 2758 to 3696◦s−1.
If the angular velocity between two acceleration peaks re-mains constant, neither steadily rising nor falling, it indicates that two separate ground contacts occur, similar to those oc-curring at 63.13 and 63.15 s shown in Fig. 2e. Here, the con-tact times are very short (lasting 13 and 8 ms) and the ac-celeration maxima differ (138.6 and 34.3g). During these two contacts, rotation increased from 40186 to 40387◦s−1, with a constant intermediate value to 40334◦s−1. Interest-ingly, the maximum rotation of 40709◦s−1occurred during the first contact, subsequently decreasing to the intermediate value.
50 55 60 65 70 75 Time (s) 0 10 20 30 40 50 60 70 80 D u ra ti o n o f m p a c t (m s )
55.2 55.22 55.24 55.26 55.28
Time (s) 600 800 1000 1200 R o ta ti o n (° s -1) 0 20 40 60 A c c e le ra ti o n ( g )
57.6 57.61 57.62 57.63 57.64
Time (s) 2600 2800 0 50 100 A c c e le ra ti o n ( g )
58.68 58.69 58.7 58.71 58.72 58.73 58.74 58.75
Time (s) 2800 3000 3200 3400 3600 3800 0 5 10 15 20 25 30 35 A c c e le ra ti o n ( g )
63.11 63.12 63.13 63.14 63.15
Time (s) 4200 4300 4400 4500 4600 4700 0 20 40 60 80 100 120 140 A c c e le ra ti o n ( g )
70.8 70.805 70.81 70.815 70.82 70.825
Time (s) 1450 1500 1550 1600 1650 1700 1750 1800 1850 0 10 20 30 40 50 60 70 80 A c c e le ra ti o n ( g )
(a) (b) (c)
(d) (e) (f)
2700 2900 i R o ta ti o n (° s -1) R o ta ti o n (° s -1) R o ta ti o n (° s -1) R o ta ti o n (° s -1)
Figure 2. (a)Duration of ground contacts.(b)Absolute rotational and acceleration values for the ground contact at 55.24 s lasting 42 ms,
(c)at 57.62 s lasting 28 ms,(d)at 58.72 s lasting 68 ms,(e)a double contact from 63.13 s onward lasting 13 ms and 8 ms,(f)and at 70.81 s
lasting 13 ms. The error on individual measurements is smaller than the plotted marker size.
maximum acceleration for this ground contact was 72.5g
(Fig. 2f).
5 Discussion
Because the acceleration and rotation sensors exhibit very small inherent offsets, a correction is not mandatory – but feasible if desired. The constant offsets being smaller than 0.1 % for the gyroscope and 0.8 % for the accelerometer with respect to the full range capacity of each individual sensor undermines the high-quality sensor stream. An evaluation of the sensor’s centrical installation in the block indicated a very small eccentricity of 4 mm. This shows that a careful manual placement is sufficient for accurate results.
In this experiment, ground contact duration was shown to vary considerably, ranging from a minimum of 8 ms to a maximum of 75 ms. These measurements show that longer contacts occurred on steeper terrain and shorter ones on flat-ter flat-terrain. However, no precise characflat-terization is possible yet because the spatial data cannot be linked to the temporal data within the needed accuracy.
Temporal information on the block’s flight duration be-tween ground contacts can be used to calculate the jump height of the flight parabola (Gerber, 2015). A temporal and/or spatial link could be used to calculate the jump dis-tance on the slope, but no such link has been established yet.
The measurements suggest very different forms of contact, both in terms of acceleration and rotation. For very short con-tacts of less than 10 ms, the individual measurements are not quite as reliable as the quality control purports. To measure such short contacts, the measurement frequency would have to be increased, which is achieved by updating to StoneNode v1.1, which has an increased sampling rate of 1 kHz for the accelerometer and gyroscope (Caviezel et al., 2018c).
6 Conclusions
to quasi-static conditions, that is difference mapping and/or long-term monitoring. Extending these time-of-flight mea-surement techniques to track a rockfall trajectory in real time fails to date due to insufficient range, resolution and/or frame rate capabilities (Horaud et al., 2016). Possible solutions are a high frame-rate, simultaneously triggered multi-camera setup and subsequent stereographic reconstruction of the tra-jectory, or a highly specified time-of-flight camera such as a scannerless lidar system capable of tracking motions as fast as 100 km h−1in single-reflection mode over large distances. For experimental purposes, being interested in direct flight kinematics, these approaches might be favored over seismic signal analysis (Hibert et al., 2017; Dietze et al., 2017).
We have mainly gathered and processed temporal informa-tion from the rockfall sensors. A connecinforma-tion to the spatial ex-tent of the trajectory is still missing. An approach involving the projected longitudinal profile is available, but the exact connection to the inclination of the terrain or the assignment of slopes to each ground contact is not yet possible. This in-formation would provide a better explanation of the general increases and decreases in rock rotation.
The sensor data are ideal to calibrate constitutive relation-ships, which are at the kernel of the RAMMS rockfall soft-ware module (Caviezel et al., 2018c, b). The combination of real-terrain measurements coupled with non-smooth model-ing approaches opens many new possibilities to investigate how terrain influences rock motion. Because terrain is sel-dom homogeneous and rock shapes far from symmetric, in situ measurements are needed to measure the forces at play at any given time and impact, but also for every possible rockfall trajectory. Simulated results can now be calibrated to measured data to provide a calibration methodology for rockfall simulation codes.
Data availability. Data are available via EnviDat (https://www. envidat.ch), the environmental data portal developed at the WSL. Under https://doi.org/10.16904/envidat.37 (Caviezel et al., 2018d) a data archive is found containing site-specific geographical data such as DSM and orthophotos as well as the deposition points of manually induced rockfall by releasing differently shaped boulders with 30–80 kg of mass. Additionally available are all the StoneNode v1.0 data streams for rocks equipped with a sensor. The scrutinized data stream presented here is labelled “EOTA_RF05_r6”.
Author contributions. Both authors contributed equally to the con-ception of the experiment, the data analysis and the paper prepara-tion.
Competing interests. The authors declare that they have no conflict of interest.
Edited by: Jean-Philippe Malet
Reviewed by: François Noël and one anonymous referee
References
Altshuler, E., Torres, H., Gonzáalez-Pita, A., Sánchez-Colina, G., Pérez-Penichet, C., Waitukaitis, S., and Hidalgo, R. C.: Settling into dry granular media in different gravities, Geophys. Res. Lett., 41, 3032–3037, 2014.
Asteriou, P., Saroglou, H., and Tsiambaos, G.: Geotechnical and kinematic parameters affecting the coefficients of restitution for rock fall analysis, Int. J. Rock Mech. Min. Sci., 54, 103–113, 2012.
Caviezel, A., Bühler, Y., Christen, M., and Bartelt, P.: In-duced Rockfall Dataset (Small Rock Experimental Campaign), Tschamut, Grisons, Switzerland; WSL Institute for Snow and Avalanche Research SLF; https://doi.org/10.16904/envidat.37, 2018a.
Caviezel, A., Bühler, Y., Lu, G., Christen, M., and Bartelt, P.: Pro-ceedings of the 9th European Conference on Numerical Methods in Geotechnical Engineering, 25–27 June, Porto (Portugal), 875– 886, 2018b.
Caviezel, A., Schaffner, M., Cavigelli, L., Niklaus, P., Bühler, Y., Bartelt, P., Magno, M., and Benini, L.: Design and Evaluation of a Low-Power Sensor Device for Induced Rockfall Experiments, IEEE T. Instrum. Meas., 67, 767–779, 2018c.
Caviezel, A., Bühler, Y., Christen, M., and Bartelt, P.:
WSL Institute for Snow and Avalanche Research SLF, https://doi.org/10.16904/envidat.37, 2018d.
Corona, C., Lopez-Saez, J., Favillier, A., Mainieri, R., Eckert, N., Trappmann, D., Stoffel, M., Bourrier, F., and Berger, F.: Model-ing rockfall frequency and bounce height from three-dimensional simulation process models and growth disturbances in submon-tane broadleaved trees, Geomorphology, 281, 66–77, 2017. Dietze, M., Mohadjer, S., Turowski, J. M., Ehlers, T. A., and
Hov-ius, N.: Seismic monitoring of small alpine rockfalls – validity, precision and limitations, Earth Surf. Dynam., 5, 653–668, 2017. Gerber, W.: Geschwindigkeit und Energie aus der Anlayse von Steinschlagspuren – Velocity and kinetic energy from the analy-sis of rockfall trajectories, Österr. Ing.- Archit.-Z., 160, 171–175, 2015.
Gronz, O., Hiller, P. H., Wirtz, S., Becker, K., Iserloh, T., Seeger, M., Brings, C., Aberle, J., Casper, M. C., and Ries, J. B.: Smart-stones: A small 9-axis sensor implanted in stones to track their movements, Catena, 142, 245–251, 2016.
Hibert, C., Malet, J.-P., Bourrier, F., Provost, F., Berger, F., Borne-mann, P., Tardif, P., and Mermin, E.: Single-block rockfall dy-namics inferred from seismic signal analysis, Earth Surf. Dy-nam., 5, 283–292, 2017.
Horaud, R., Hansard, M., Evangelidis, G., and Ménier, C.: An overview of depth cameras and range scanners based on time-of-flight technologies, Mach. Vision Appl., 27, 1005–1020, 2016. Leine, R., Schweizer, A., Christen, M., Glover, J., Bartelt, P., and
Gerber, W.: Simulation of rockfall trajectories with consideration of rock shape, Multibody Syst. Dyn., 32, 241–271, 2014. Niklaus, P., Birchler, T., Aebi, T., Schaffner, M., Cavigelli, L.,
Caviezel, A., Magno, M., and Benini, L.: StoneNode: A low-power sensor device for induced rockfall experiments, in: 2017 IEEE Sensors Applications Symposium (SAS), 1–6, 2017. Paronuzzi, P.: Rockfall-induced block propagation on a soil slope,
Sanchez-Colina, G., Alonso-Llanes, L., Martinez, E., Batista-Leyva, A. J., Clement, C., Fliedner, C., Toussaint, R., and Alt-shuler, E.: Note: “Lock-in accelerometry” to follow sink dynam-ics in shaken granular matter, Review of Scientific Instruments, 85, 2014.
Saroglou, C., Asteriou, P., Zekkos, D., Tsiambaos, G., Clark, M., and Manousakis, J.: UAV-based mapping, back analysis and trajectory modeling of a coseismic rockfall in Lefkada island, Greece, Nat. Hazards Earth Syst. Sci., 18, 321–333, https://doi.org/10.5194/nhess-18-321-2018, 2018.