ABSTRACT
PERSHING, MARY RENE. Evaluating the Flush of CO2 as a Short-Term Biological Indicator of Soil Nitrogen Availability. (Under the direction of Dr. Alan Franzluebbers).
Determining the appropriate nitrogen (N) rate for crops is critical to farm economics and environmental protection. In North Carolina, N fertilizer recommendations do not consider residual inorganic N or biologically active N estimations, but only realistic yield expectations set for each soil type and crop. However, due to increasingly popular
conservation management practices such as cover cropping and no-till farming, biologically active N can accumulate in soil, resulting in greater supply of N than expected. Measuring biologically active carbon (C) is strongly correlated to net N mineralization, and may be less complicated, expensive, and time consuming than measuring biologically active N, due to the rapidly changing nature of soil N. The purpose of this study was to analyze soil from
different locations and soil types with a diversity of management practices and determine which soil properties were most related to plant N uptake and dry matter production. Soil samples from research stations and private farms representing three physiographic regions of North Carolina (coastal plain, piedmont, and mountains), as well as from cooperating
locations in Virginia, Pennsylvania, Oklahoma, Nebraska, and Georgia were analyzed for various soil chemical and biological properties in the laboratory and utilized in greenhouse growth trials. Unfertilized Sorghum bicolor was grown for eight weeks in each soil sample to test for N availability. Shoot dry matter accumulation and N concentration of plants were measured, which allowed for determination of above ground plant N uptake. The flush of CO2 following rewetting of dried soil was a key indicator of interest, as was net N
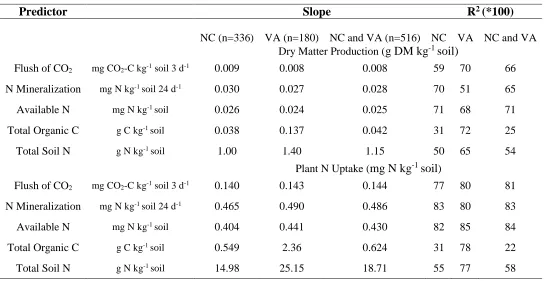
total organic C and N. In Greenhouse Trial 1, the flush of CO2 was the second best indicator of greenhouse growth (R2=0.78) behind net N mineralization (R2= 0.81). In Greenhouse Trial 2, total soil N was the best indicator of greenhouse growth (R2 = 0.82). In Greenhouse Trial 3, the flush of CO2 was the best indicator of greenhouse growth (R2 = 0.96). In Greenhouse Trial 4, the flush of CO2 was the second best indicator of plant N uptake (R2=0.83) behind net N mineralization (R2= 0.88). Among all samples, the flush of CO2 explained 69% of the variation in N uptake. The slope to predict greenhouse growth in soils from Oklahoma, and Pennsylvania, was significantly different from North Carolina, Georgia, and Virginia. The interaction effect of state on the flush of CO2 improved prediction of dry matter production from 50 to 71% and of plant N uptake from 68 to 89%. Samples originating from NC and VA (n=516) were predicted by the flush of CO2 with an R2=0.81 for plant N uptake and R2=0.66 for dry matter production. The biologically active fraction of organic matter was the most dominant and consistent way to determine plant N uptake in this study (i.e. through net N mineralization and potential C mineralization). Occasionally, other soil nutrient
Evaluating the Flush of CO2 as a Short-Term Biological Indicator of Soil Nitrogen Availability
by
Mary Rene Pershing
A thesis submitted to the Graduate Faculty of North Carolina State University
in partial fulfillment of the requirements for the degree of
Master of Science
Soil Science
Raleigh, North Carolina 2016
APPROVED BY:
_______________________________ _______________________________
Dr. Alan Franzluebbers Dr. Carl Crozier
Committee Chair
_______________________________ _______________________________
ii
DEDICATION
iii
BIOGRAPHY
Molly was born on November 2, 1991 in Webster Groves, Missouri, a suburb right outside of Saint Louis. She grew up hiking in Southern Missouri and swimming on the Black River on weekends. She attended the University of Missouri-Columbia and majored in Food Science, where she also minored in Sustainable Agriculture and found her passion for creating a better food and agriculture system to improve natural resources and ensure agricultural
iv
ACKNOWLEDGMENTS
I would like to thank the people who contributed to my research with lab work, advice, and moral support, without whom I could not have completed my research.
Alan Franzluebbers Ellen Leonard
Erin Silva Ashtyn Mizelle
Janet Chappell Thays Schneider Consuelo Arellano
v
TABLE OF CONTENTS
LIST OF TABLES ... ix
LIST OF FIGURES ... xii
Introduction ...1
Literature Review...1
Current State of Soil Nitrogen Testing ...3
Nitrogen Availability Indices ...4
Relationship of Microbial Activity and Nitrogen Mineralization ...9
Objectives and Hypotheses ...14
Materials and methods ...16
Soil Sampling ...16
Soil Locations in Greenhouse Trial 1 ...16
Soil Locations in Greenhouse Trial 2 ...17
Soil Locations in Greenhouse Trial 3 ...17
Soil Locations in Greenhouse Trial 4 ...18
Laboratory Analyses ...19
Soil Sample Preparation ...19
Carbon Mineralization after Re-wetting Dried Soil ...20
Soil Microbial Biomass Carbon ...22
vi
Soil Texture and Particulate Organic Matter ...23
Soil Testing...24
Greenhouse Growth Trials ...24
Preliminary Greenhouse Trial Protocol ...24
Statistical Analysis: Preliminary Trial 1 ...26
Standardized Greenhouse Trial Protocol (Trial 2-4) ...28
Plant Nitrogen Content ...28
Statistical Analysis of All Data (Trials 1-4) ...29
Results and Discussion ...31
Greenhouse Trial 1: Effect of Water Stress on Plant Dry Matter Production ...31
Conclusions of water stress level analysis ...32
Soil Properties Associated with Greenhouse Growth ...33
1. Greenhouse Trial 1: Selecting the key variables to predict greenhouse growth ....33
1.1. Soil biological properties correlated to greenhouse growth ...34
1.2. Selection procedure to choose best variables to predict greenhouse growth ...35
vii 1.6. Relationship between greenhouse growth and soil biological properties with soil depth 41
1.7. Differences of zero, low, and high poultry litter applications on the flush of CO2 in
Lewiston-Woodville, NC ...41
1.8. Does land management affect the relationship between greenhouse growth and soil biological properties? ...42
1.9. Conclusions from Greenhouse Trial 1 ...44
2. Greenhouse Trial 2: Selecting the key variables to predict greenhouse growth ....44
2.1. Soil biological properties correlated with greenhouse growth ...46
2.2. Selection procedure to choose best variables to predict greenhouse growth ...47
2.3. Key drivers of greenhouse growth in Oklahoma ...47
2.4. Effect of cover crops in Pennsylvania ...49
2.5. Does previous crop affect the prediction of net N mineralization from soils along Dan River? 50 2.6. Conclusions of Greenhouse Trial 2 ...51
3. Greenhouse Trial 3 ...51
3.1. Overall determinants of greenhouse growth ...51
3.2. Variable selection procedure ...52
3.3. Previous crop effect in Cleveland County NC ...53
viii 4. Greenhouse Trial 4: Selecting the key variables to predict greenhouse growth ....56
4.1. Soil biological properties correlated to greenhouse growth ...57
4.2. Selection procedure to choose best variables to predict greenhouse growth ...57
4.3. Principal component analysis of Greenhouse Trial 4 ...58
4.4. Further testing the relationship of soil biological properties with greenhouse growth 58
4.5. Effect of texture on predicting plant N uptake ...59
5. Overall analysis of the flush of CO2 ...60 Conclusions ...63 Tables 66
ix
LIST OF TABLES
Table 1. Description of soils used for laboratory analysis and greenhouse trials (grouped by state and greenhouse trial) ... 66 Table 2. Analysis of variance for dry matter production as a function of field site, depth, and stress (n=108) Trial 1 ... 69 Table 3. Effect of soil depth (cm) and water stress level (% water at lower limit) on dry matter production (mg g-1 soil) at each field site in Greenhouse Trial 1 ... 70 Table 4. Interaction effect of depth x water stress in Plymouth at hayed forage site in
Greenhouse Trial 1 ... 71 Table 5. Pearson correlation coefficients of greenhouse growth versus various soil N
x Table 11. Analysis of variance for plant N uptake and dry matter production as affected by the flush of CO2 and its interaction with sand content in Greenhouse Trial 1 (n=120) ... 77 Table 12. Mean and standard deviation of plant N uptake and dry matter production as affected by soil texture in Greenhouse Trial 1 (n=120) ... 78 Table 13. Mean values for soil nitrate (NO3-N) and available N in samples collected from Lewiston-Woodville, NC managed with three different poultry litter treatments ... 79 Table 14. Pearson correlation coefficients of various soil properties in relationship to dry matter production (n=111), plant N uptake (n=111), and net N mineralization (n=73) in Greenhouse Trial 2 for samples collected from Dan River Valley ... 80 Table 15. Plant N uptake and dry matter production in the greenhouse as related to total organic C and N of soil from samples collected under undisturbed, non-agricultural plant canopies in Greenhouse Trial 2 ... 81 Table 16. Regression parameters for predicting plant N uptake and dry matter production from the flush of CO2 as affected by state of origin in Greenhouse Trial 2 (Dan River
xi Table 21. Strength of relationship (R2) in predicting dry matter production and plant N
xii
LIST OF FIGURES
Figure 1. Soil sampling locations... 92 Figure 2. Layout of growth tube rack in Greenhouse Trial 1 with randomly selected samples ... 93 Figure 3. Layout of growth tube rack in Greenhouse Trials 2-4 ... 94 Figure 4. Mean air temperature by week for each greenhouse trial (a) and mean and standard deviation by week for each greenhouse trial (b) ... 95 Figure 5. Mean and standard error of dry matter production (g DM kg-1 soil) by site as
affected by water stress level (means not sharing the same letter are significant at p<0.05) . 96 Figure 6. Plant N uptake in relationship with dry matter production in Greenhouse Trial 1 . 97 Figure 7. Principal component analysis of plant N uptake from Greenhouse Trial 1 using the flush of CO¬2, soil microbial biomass C, particulate organic C and N, and available N as independent variables (chosen by proc GLM selection procedure) ... 98 Figure 8. Plant N uptake in relationship with available N (a), net N mineralization (b), and the flush of CO2 (c) as affected by soil textural class in Greenhouse Trial 1 (n=108) ... 99 Figure 9. Plant N uptake in relationship with available N (a), net N mineralization (b), and the flush of CO2 (c) as affected by soil depth in Greenhouse Trial 1 (n=108) ... 100 Figure 10. Relationship of plant N uptake with dry matter production in Greenhouse Trial 2 ... 101 Figure 11. Net N mineralization in relationship with the flush of CO2 as affected by state of origin in Greenhouse Trial 2 ... 102 Figure 12. Plant N uptake in relationship with the flush of CO2 as affected by grazing
1
INTRODUCTION
Literature Review
Nitrogen (N) limits plant production, and therefore, is crucial to feed the world’s population. An estimated 40% of the world’s population relies on N fertilizer for dietary protein, which is fortunately accessible due to the invention of the Haber-Bosch process (Galloway, 2003; Keeney and Hatfield, 2008). Advancements in N fertilizer are largely responsible for tripling the global food supply in the last 50 years, proliferating the
population from 1.6 billion to over 7 billion in the 20th century (Mosier, A.R., Syers, J.K. and Freney, 2004; Smil, 2011). Unfortunately, reactive forms of N cause detrimental effects to the environment, such as eutrophication, greenhouse gas emissions, and ozone depletion (Cassman et al., 2002; Galloway, 2003; Mosier et al., 2004; Howarth, 2008).
Agricultural nitrate (NO3) leaching poses the greatest immediate risk to the economy and water resource protection. The United States Department of Agriculture (USDA)
Economic Research Service estimates that $1.7 billion dollars are spent annually to remove agriculturally derived NO3 from drinking water supplies. Studies have shown that
groundwater NO3 levels in North Carolina and other southeastern states often exceed the maximum allowable level of 10 mg/L NO3-N (Hubbard et al., 2004). Reducing NO3 levels by 1% in the US would decrease treatment costs by more than $120 million dollars each year (Ribaudo, 2011), and prevent the more than 50% of the population in the US that depend on groundwater as their primary drinking source from elevated blood NO3 levels.
2 through tourism and recreation along the coasts (CENR, 2003). In total, eutrophication from nutrient runoff into freshwater systems costs the United States $2.2 billion each year (Dodds et al., 2009). Given the large damaging effects of reactive N losses on ecosystems and the economy, and the prediction that worldwide use of N could double to 236 million metric tons by the year 2050 (Tilman et al., 2001), better prediction of plant-available N has never been more urgent.
In addition to the adverse economic and environmental impacts of excess N, farmers are more likely to attain maximum profit from optimum fertilizer rate decisions. In
Wisconsin, adjusting the N application rate after using the presidedress soil nitrate test (PSNT) and considering manure and legume N credits resulted in an increase in profit by $34/ha (Andraski and Bundy, 2002). In the tidewater region of North Carolina, reducing fertilizer N by 39 kg ha-1 to wheat resulted in a decrease of 2.3 mg NO3-N L-1 in groundwater and a 25% greater harvest N ratio (%N in grain or forage divided by total N applied), as compared to using a realistic yield expectation (RYE) database (Hong et al., 2006). In the same study by Hong et al., (2006) some sites saw a significant increase in yield with more fertilizer N applied than the RYE fertilizer recommendation.
3 scientific advances in N management have been made, much is still unknown about N
cycling. The ability to predict N supplying capacity of soil has yet to be achieved,
contributing to worldwide inefficient N use (Hong et al., 1990). Farmers need a robust soil N testing tool so that they can apply the right amount of N fertilizer to achieve high crop production while protecting the environment.
Current State of Soil Nitrogen Testing
Currently, state soil testing facilities in North Carolina and surrounding states do not routinely test for soil N. The rationale is that inorganic N is an unreliable predictor of plant available N because of its potential to be leached from the root zone prior to the growing season. Instead, farmers are instructed to utilize an online database (realistic yield
expectation, RYE) that recommends N based on crop and soil type. Soil organic N is not explicitly accounted for in the database. The database was recently updated to reflect improved corn hybrid genetics and management, and shown to accurately predict N recommendations with increased yield using the same rate of N applications (Rajkovich et al., 2015). However, the database does not directly account for potentially available N prior to fertilization on a case-by-case basis.
Cover cropping, no-till, manure application and other increasingly common conservation management practices may stabilize soil aggregates, reduce erosion and subsequently protect microbial functioning, carrying over mineralization potential to the following growing season. In the United States, 36 Mha are farmed using no-till and adoption is growing (Horowitz et al., 2010). Cover cropping has increased every year for five
4 that over time, there is greater soil organic C sequestration, which also may increase organic N supply and subsequently plant available N (Poeplau and Don, 2015). A soil-testing tool for predicting soil N supplying capacity that is sensitive to management would allow farmers to adjust fertilizer application rates due to their particular management approach. Quantifying the change in the active fraction of organic matter, if resulting in better N supplying capacity, would also encourage farmers to adopt or continue to use these “sustainable” soil
management methods.
Essential to soil N test adoption by farmers is reliability, minimal time and cost, and easy integration into current operations (Balkcom et al., 2000; Griffin, 2008; Kitchen et al., 2008). Decades have been spent researching a soil-testing tool that embodies these key components. This literature review assesses several options, both chemical and biological. The potential N indices are reviewed with three criteria in mind: i) summary of the
methodology; ii) ability of test to predict soil N mineralization and/or plant N uptake across different soil types; and iii) review limitations and speculate on feasibility for widespread use. A biological test, the flush of CO2 following rewetting of dried soil, will be described in more detail as a short-term biological indicator of soil N mineralization.
Nitrogen Availability Indices
5 whereby soil is incubated for 30 weeks. The isotopic tracer method uses expensive
equipment and therefore may not be feasible as a routine soil test. The long-term incubation approach, however, is widely accepted as a standard for quantifying the potentially
mineralizable N pool, and many studies often compare short-term indices against this method for validation (Griffin, 2008; Schomberg et al., 2009; Culman et al., 2013). Therefore, many tests, such as total soil N concentration are validated against aerobic incubation. It should be noted that there have been many modifications to the method first proposed by Stanford and Smith (1976), so variations in methodology exist, making it more difficult to compare methods against each other (Griffin, 2008).
6 Piekielek, 1978). The N uptake from the soil was determined from measuring corn grain and stover N content from zero N rate plots.
Extraction methods have been useful as a chemical index for soil N availability, because results are obtained rapidly. There are several extraction methods, including CaCl2-extractable N, NaHCO3-CaCl2-extractable N, and hot and cold KCl-CaCl2-extractable N. The N extracted by boiling CaCl2 was highly correlated to the N taken up by corn in Pennsylvania soils (Fox and Piekielek, 1978). However, recent studies did not obtain similar results (Griffin, 2008). Field validations of the method by Fox and Piekielek (1978) found a lower correlation due to climatic factors, which reduced the reliability of the extraction tests. NaHCO3-extractable N obtained mixed results similar to that of CaCl2 (Griffin, 2008).The KCl extraction method was strongly correlated to N mineralization in an incubation experiment with a correlation coefficient of 0.95 by subtracting the initial soil NH4 concentration (Hong et al., 1990). Subsequent evaluations indicated a much lower correspondence (Griffin, 2008). In field-testing, hot KCl extraction also had mixed results. In Scotland, 10 soils had a close
correlation of KCl extractable NH4 and N mineralization with barley N uptake (McTaggart and Smith, 1993), while Hong et al. (1990) found it not to be a strong predictor in
Pennsylvania soils.
7 5% of farmers in Michigan use PSNT (Stuart et al., 2014). Farmers will either apply all of their N fertilizer at time of planting, or they are too busy to sample at the V4-V6 stage (Hong et al., 1990).
A limitation to chemical N indices is that they are only reflective of the inorganic N concentration at that time, and are not reflective of the active fraction of organic matter that may also contribute to N availability. One approach to measuring the biologically available N in soil organic matter is to partition the soil N into various pools, such as soil microbial biomass or particulate organic matter. Transformation of soil organic N is a biologically mediated process, so soil microbial biomass has been largely examined as a labile fraction of soil organic N for its ability to predict N mineralization (Griffin, 2008). Correlations in various studies range from 0.41-0.72 in aerobic incubations of different lengths.
Franzluebbers et al. (2001) found that soil microbial biomass C accounted for 30% of the variation in N mineralized in soils from a wide range of moisture and temperature gradients in the US. Individual locations explained an additional 26% of the variation, totaling 56% of the variation accounted for by soil microbial biomass C.
8 In New York and Illinois, the Illinois Soil Nitrogen Test (ISNT) has been useful. Field trials at Cornell State University determined 83% accuracy in N fertilizer
recommendations (Lawrence et al., 2012). ISNT indicates the active fraction of organic matter by measuring the amino sugar content, which resides in soil microbial biomass (Griffin, 2008). It has been extremely useful in determining sufficiency of N in soils, as long as sampling did not occur directly after manure application. Williams et al. (2007) showed that the ISNT concentration and economically optimum N rate were strongly correlated in North Carolina (no threshold rate was established because all sites were insufficient in N) on well-drained and poorly drained soils with an r2 of 0.87 and 0.78, respectively. Similar to all tests previously described, climate variability reduces the effectiveness for the ISNT to work.
Schomberg et al. (2009) reviewed many chemical and biological indices in relation to N mineralization from nine different sites in the southern US under different management systems. This study found that the highest correlation of N mineralization (a 41-week method by Wang et al., 2003) to laboratory indices were total C and N, anaerobic N mineralization, hot KCl extraction, and N mineralization during 24 days. They found N mineralization during 24 days to be a potentially useful short-term indicator of N availability in soils. The best combination of methods to estimate N mineralization in this study was total N and C mineralization during three days (i.e. flush of CO2). The flush of CO2 reflects microbial population dynamics and the steady-state rate of C mineralization, while total soil N is composed of active and recalcitrant fractions of soil organic N. Measurement of the flush of CO2 is a promising tool, as it is relatively fast (three days) and more sensitive than N
9 than N (Schomberg et al., 2009). Measuring C mineralization is also inexpensive and feasible for laboratories to adopt.
Many N research papers confirm that biological tests are better indicators of N availability. Often times N and C mineralization are highly related due to soil microbial biomass decomposing SOM to obtain energy (i.e. C mineralization) and leaving behind N as inorganic NH4+ and NO3 as by-products of decomposition (i.e. N mineralization).
Franzluebbers et al. (2000) and Haney et al. (2001) have shown that C mineralization is highly correlated with N mineralization, as well as reflective of recent changes in management. Culman et al. (2013) evaluated current short-term and long-term tests to compare actual corn yield performance in a growing season in Michigan. The study found C mineralization to be the best indicator of N mineralization potential in six out of nine models tested.
The greatest impacts on soil biological activity are temperature and water content. The biological approach of C mineralization after re-wetting dried soil is useful in that it mimics the real-world occurrences in which rainfall and drought occur throughout a growing season (Franzluebbers et al., 2000). Incubating soil at optimal mineralization temperature (25°C) determines the amount of potential N mineralized. For these reasons, the flush of CO2 has been proposed as a useful indicator of potential N mineralization for soils in the southeast United States (Franzluebbers et al., 1999a).
Relationship of Microbial Activity and Nitrogen Mineralization
10 available forms of N. Inorganic N ranges from 1-300 kg N ha-1 in the top meter of soil, and its mobility and cycling depend on climatic conditions (Sylvia et al., 2005). Organic N from SOM is also important, for it can be mineralized for plant N availability. The three major pools of SOM are the active or labile fraction, the intermediate pool, and the slow or passive pool (Sylvia et al., 2005). Detection of differences in total organic matter due to changes in management practices can take several years. Total C is one measurement of soil organic matter, but is not often reflective of recent changes in management, such as with adoption of conservation tillage. The active or labile fraction of SOM with rapid turnover of C and N cycling is more indicative of available soil N within a growing season (Schomberg et al., 2009; Culman et al., 2013). Mineralization and immobilization of the labile fraction is mediated by microbes that are obtaining energy from carbon (C). The C comes from soil organic matter and decomposing plant and animal residues (Sylvia et al., 2005). The soil N cycle is thus a biologically mediated process. Soil microorganisms decompose organic substrates, supplying inorganic N as by-products for plant growth and development (Chen et al., 2003).
11 Conceptually, N mineralization is systematically related to microbial activity. Many studies have shown a significant positive relationship that verifies this concept.
Franzluebbers et al. (2000) determined a standardized test using the flush of CO2 following rewetting of dried soil that relates to the active pool of organic matter. They found that N mineralization was highly correlated with the flush of CO2.
Gilmour et al. (1985) compared substrates with various C:N ratios (e.g. sewage sludge, alfalfa, clover, bermuda grass, and ryegrass) to evaluate the relationship of CO2 evolution and N mineralization. Although N concentration of the substrate was not related to decomposition, a significant linear relationship between N mineralization and CO2 evolution was determined for each substrate. Several studies on the relationship between soil microbial biomass N (or C) with N mineralization have produced mixed results (in various incubation lengths).
Several other studies have shown strong correlation of C and N mineralization
12 sensitive to differences in tillage management. This knowledge would allow farmers to make more accurate fertilizer decisions after changes in management practices.
In a field study in Michigan, yield and total biomass production were more strongly related to potential C mineralization during 0-1 day than any other indicator during early corn development stages (Culman et al., 2013). Other indicators strengthened their relationship as the season went on. Nitrogen mineralization ranked second, and soil nitrate was stronger by the third sampling. The results of this study suggest that multiple measurements might be needed to fully characterize the soil and to make optimal fertilizer N recommendations. Soil C mineralization is just one tool for farmers, as other measurements of N, such as inorganic N, will provide a fuller picture of N availability. Measurement of the flush of CO2 is
advantageous because it indicates to farmers and researchers the status of active C and N in the soil. This biologically active fraction indicates the N supplying capacity of the soil. In addition, this method is simple to set up with minimal equipment and rapid analysis (Franzluebbers, 2016).
In terms of methodology, the flush of CO2 after re-wetting of dried soil has been determined with a standard approach for nearly 20 years. Validation of potential N
13 complications of obtaining in-situ cores from field soil that is too dry or too wet. Although breaking soil aggregates will cause a flush of C mineralization due to loss of physical protection of organic C (Franzluebbers and Arshad, 1997), sieving cores to <4.75 mm yielded C mineralization dynamics similar to the intact core method since many aggregates remained intact (Franzluebbers, 1999a). Standardization of the method is important, so that consistent results will be obtained. Although several research investigations have been conducted on N mineralization in laboratory incubations, these results may not be synonymous with plant N uptake.
The purpose of this study was to determine the actual amount of plant available N supplied in different locations and soil types, and to evaluate whether other properties might be associated with plant N uptake. Greenhouse growth trials would provide an intermediate step to understand plant N availability from soil organic N sources, between highly
controlled laboratory conditions and uncontrollable field conditions. Few studies have evaluated the effectiveness of the flush of CO2 to actual N uptake by plants across a wide range of soil types and climatic conditions, so a study of laboratory analyses followed by greenhouse trials with a wide range of soils was considered appropriate to evaluate the flush of CO2 as an indicator of soil N availability.
Controlling for water, sunlight, and temperature is an important aspect, for these are inherent factors that affect soil N mineralization. A study by Stanford and Epstein (1974) held gravimetric soil water content at different levels, and concluded that soil N
14 directly because of the confounding effects of moisture content (Griffin, 2008). For this reason, determining soil texture along with C mineralization and dry matter production was considered important for this study. In general, SOM mineralizes to a greater extent in sandy soils than clayey soils, and sandy soils generally have less organic C and N overall (Griffin, 2008). There are mixed results on whether mineralization rate changes with soil texture, which is an additional question to be investigated in this analysis.
While some field studies have been done using a narrow range of soil types,
greenhouse studies with a wide variety of un-amended soil have not yet been conducted for evaluating the flush of CO2 as an indicator of actual plant N uptake. Sorghum-sudangrass (Sorghum bicolor) was considered an ideal test crop to grow in the greenhouse to test for N availability, because it is fast growing and has regrowth potential when clipped (Dial, 2012). It is also able to grow in limited soil volume and is easy to harvest, weigh, and measure the entire above ground biomass.
Objectives and Hypotheses
The objectives of this study were to identify soil properties associated with net N mineralization (laboratory incubations), plant dry matter growth, and plant N uptake (greenhouse growth trials) across various soil types in the southeastern and mid-Atlantic United States. It was hypothesized that soil biological activity is a major driving force controlling potential N mineralization and N availability, and subsequently that C mineralization is systematically related to potential N mineralization. It was also
15 availability, so characterizing the various N fractions was critical to predicting soil N
16
MATERIALS AND METHODS
Soil Sampling
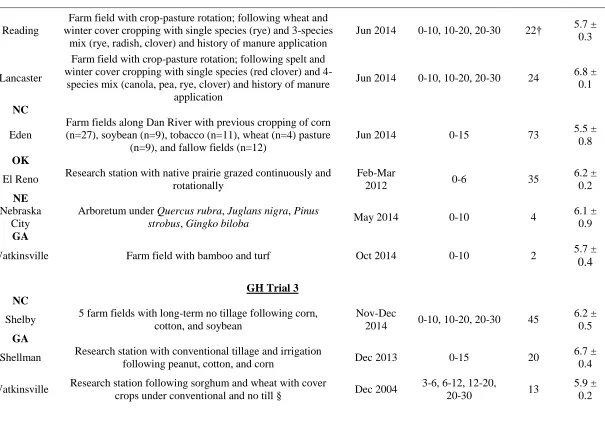
Soil was collected from 51 different locations in North Carolina (NC), Virginia (VA), Georgia (GA), Pennsylvania (PA), Oklahoma (OK) and Nebraska (NE), for a total of 759 samples (Figure 1; Table 1). Sampling was generally obtained from topsoil to varying depths, but the majority of samples were collected as four field replicates from a composite of eight cores at depths of 0-10, 10-20, and 20-30 cm. Samples were mostly collected using a push probe with a core diameter of 4 cm.
Details of site management and sampling depth are presented in Table 1. Fields with different management practices, such as tillage, crop rotations, or manure applications rates on the same farm or research station were sampled to assess the sensitivity of soil biological quality indicators to management. Geographic location of sites, climate normals from nearby weather stations, soil taxonomy and textures are described in Appendix A and Appendix B.
The objective was to collect samples that represented a diversity of management, soil order, texture, and soil organic matter content. Replicate samples from farm fields were collected by subdividing fields based on landscape features (Petersen and Calvin, 1996). Laboratory analyses and greenhouse growth trials were conducted on all 759 samples (see section on laboratory analyses and greenhouse growth trials).
Soil Locations in Greenhouse Trial 1
Lewiston-17 Woodville, NC (courtesy of Carl Crozier as collaborator). Additional soil was collected from the Lower Coastal Plain Tobacco Research Station in Kinston, NC; the Piedmont Research Station in Salisbury, NC; and the Mountain Horticultural Crops Research and Extension Center in Mills River, NC (courtesy of Shelby Rajkovich and Deanna Osmond as
collaborators). In VA, soil was collected from three tall fescue pasture farms near Blackstone (courtesy of Chris Teutsch as collaborator). Greenhouse Trial 1 was conducted from 28 Oct to 23 Dec 2014.
Soil Locations in Greenhouse Trial 2
A total of 184 samples were analyzed and used in Greenhouse Trial 2, which was conducted from 19 Jan 2015 to 16 Mar 2015. Soil was collected in June 2014 along the Dan River Valley shortly after the coal ash spill of 2014 (courtesy of Dean Hesterberg as
collaborator). Soil from three different experiments evaluating two different winter cover crop mixtures in Pennsylvania was evaluated (courtesy of Charlie White as collaborator). Surface soil samples from a native prairie in Oklahoma were evaluated (courtesy of Pat Starks and Jean Steiner as collaborators). A half dozen samples from under various trees (Nebraska City NE) and grasses (Watkinsville GA) were also evaluated. In addition, 36 samples from Kinston, Lewiston, and Plymouth (12 each) were repeated from Greenhouse Trial 1 to test for similarity in greenhouse methodological approaches.
Soil Locations in Greenhouse Trial 3
18 County, NC was collected in November-December 2014 prior to wheat fertilization
evaluation (courtesy of Steve Gibson as collaborator). Soil samples from three different experiments that were previously analyzed for soil biological quality were selected. One set (n=20) was from an irrigated cropping study in Shellman, GA (courtesy of Marshall Lamb as collaborator). A second set (n=13) was from an integrated crop-livestock system study in Watkinsville GA (Franzluebbers and Stuedemann, 2008). A third set (n=23) was from a long-term pasture study in Watkinsville GA (Franzluebbers et al., 1999). These three sets created known gradients in soil biological activity that could be used to test the linkage between soil biological activity and plant growth.
Soil Locations in Greenhouse Trial 4
A total of 354 samples were analyzed in the laboratory and used in Greenhouse Trial 4, which was conducted from 15 Sep 2015 to 15 Nov 2015. Soil was sampled from the following research stations in association with 2015 field trials (courtesy of Shelby Rajkovich and Deanna Osmond as collaborators):
Caswell Research Farm in Kinston, NC
Piedmont Research Station in Salisbury, NC
Mountain Horticultural Crops Research and Extension Center in Mills River, NC
Additional soil samples were collected from 2015 field trials without N application (courtesy of Carl Crozier and Gary Roberson as collaborators) from:
19
Tidewater Research Station in Plymouth, NC from two fields (one dryland, one irrigated)
Center for Environmental Farming Systems in Goldsboro, NC
Private farm in Camden County NC
Additional soil samples were collected prior to corn planting in 2015 from:
Piedmont Research Station in Salisbury, NC (two fields)
Private farm in Stanly County NC (two fields) Soil was collected in March 2015 from:
Long-term pasture at the Tidewater Research Station in Plymouth, NC Lastly, in collaboration with farmers and extension personnel, soil was collected in April-May 2015 from 14 farms in Augusta, Fauquier, and Rockingham Counties in Virginia (courtesy of Jeff Cline, Alec Lipscomb, Tim Mize, and Robert Shoemaker as collaborators).
Laboratory Analyses
Soil Sample Preparation
Each soil sample (n=759) was assigned a completely randomized lab ID to be used for all analyses. Soil cores were oven-dried (55 °C, 3 d), weighed and sieved through a 4.75 mm screen with stones removed to homogenize the sample without destroying all aggregates (Franzluebbers et al., 1999b). Bulk density was calculated from the dry weight of soil divided by the volume of soil cores. Soil was thoroughly mixed in its sampling bag prior to
20
Carbon Mineralization after Re-wetting Dried Soil
To prepare samples for incubation, duplicate subsamples (50 g) were weighed from each composited sample into two 60-mL glass jars. Jars had markings in 5 mL increments, so soil was gently tamped to the nearest 2.5 mL to determine disturbed bulk density. Once the volume of soil was recorded, the amount of water needed to wet each subsample to 50% water-filled pore space (WFPS) was determined. Porosity was calculated as:
and milliliters (mL) of water needed to wet subsamples to 50% WFPS was calculated as:
H2O (mL) = 0.5 * porosity * soil volume (mL)
At least 12 hours prior to Day 0 of incubation, canning jars were prepared with a 10 mL vial of water in each to maintain humidity. Duplicate subsamples were immediately placed in one canning jar after wetting, along with an alkali trap (30 mL plastic Nalgene bottle) containing 10 mL of 1 M NaOH to capture the evolved CO2. The canning jars were capped and put into an incubator at 25 °C (± 1 °C) (Franzluebbers et al., 1999b). For every 11 samples in a box, one blank sample was added containing only the vial of water and an alkali trap without soil to subtract the background concentration of CO2.
On Day 3 of the incubation, boxes were removed from the incubator and the alkali traps replaced with a new 10 mL bottle of 1 M NaOH. Canning jars were sealed and placed back into the incubator. Original alkali traps were capped and set aside to be titrated with
porosity = 1 - (bulk density / particle density)
21 HCl to determine the amount of CO2 evolved from the soil from 0-3 days, referred to as the “flush of CO2.”
For titrations, three items were added to each alkali trap, which would be uncapped one at a time: i) 2 mL of 1.5 M BaCl2 to precipitate all sodium carbonate out of solution, ii) 2-3 drops of phenolphthalein color indicator, and iii) a magnetic stir bar. The alkali trap was then placed on a magnetic stir plate and slowly titrated with 1 M HCl until a color change from pink to white occurred. The HCl reacted with the leftover NaOH that was not
neutralized by the evolved CO2 from the soil, turning the solution white. The vial contained in the blank sample (with no soil) was also titrated and the blanks were averaged. The quantity of CO2 evolved from each soil sample was calculated as follows (Franzluebbers, 2016):
CO2-C (mg kg-1 soil) = (mL [blank] – mL [sample]) x N x M / S
where, N = normality of acid (mol L-1), M = mass conversion from cmol
c C to g C (6000), and S = soil
weight (g)
22
Soil Microbial Biomass Carbon
Soil microbial biomass carbon (SMBC) was determined using the chloroform fumigation-incubation method (Jenkinson, 1977). On Day 10 of the incubation, the vial of alkali was removed and immediately capped with an air-tight lid. The etched jar of
subsample was removed and placed into a vacuum desiccator. A 50-mL beaker containing boiling chips and 30 mL of chloroform was placed into each desiccator containing ~26 samples. Desiccators were sealed and vacuumed for 30 seconds following rapid boiling of chloroform. A vacuum was retained and desiccators placed into a dark environment for 18-24 hours. On Day 11, desiccators were unsealed and chloroform was evacuated. Samples were placed into fresh canning jars with a 10 mL vial of water and an alkali trap. At Day 21, alkali traps with fumigated soil were titrated to determine SMBC, calculated using the equation:
On Day 24, alkali traps were removed from the original mason jars and titrated for total C mineralized after 24 days with the remaining subsample.
Net Nitrogen Mineralization
Net N mineralization was determined by the difference in inorganic N (NH4+ and NO3-) concentration at 0 and 24 days of incubation (Hart et al., 1994). To determine initial inorganic N concentration (Day 0), 10 g (±0.02) of ball milled soil was weighed into 30 mL plastic Nalgene bottles, shaken with 20 mL of 2 M KCl for 30 min, and filtered through
SMBC (mg kg-1 soil) = (mL [blank] – mL [sample]) x N HCl x 6 x 1000 / ((g soil) / k C)
23 Whatman #5 filter paper. Extracts were stored in a -20°C freezer until analysis using the Bran Luebbe Auto-Analyzer 3 (EPA Method 353.1). The process was repeated at 24 days for the final inorganic N concentration using a 10-g portion of oven-dried (55 °C, 3 d) and sieved (<2 mm) sample. Initial inorganic N (Day 0) and net N mineralized after 24 days were added together to calculate potentially available N for plant growth.
Soil Texture and Particulate Organic Matter
The previously fumigated 50-g subsample was dried in an oven (55 °C, 3 d), then scraped into 125-mL Nalgene plastic bottles with screw caps for textural analysis modified from Gee and Bauder (1986). Each bottle had 100 mL of 0.1M sodium pyrophosphate decahydrate added, and the bottles were placed on a reciprocation shaker for 12-16 hours. Soil solution was transferred to a 1-L cylinder and diluted to 1-L volume with deionized water. Solution was mixed with a plunger exactly 10 times and left to settle for exactly 5 hours. Soil clay concentration was determined by placing a hydrometer in the solution and reading the measurement at 5 hours (Gee and Bauder, 1986):
The soil solution in the cylinder was poured over a 53 µm screen and washed with deionized water until only sand and particulate organic matter remained. Sand was calculated by the weight of the remaining material divided by the original soil weight. Silt concentration was calculated from difference between unity and the summation of clay and sand fractions.
24 Contents containing the sand and particulate organic matter on the sieve screen were transferred to a drying bottle with a stream of water, then dried in an oven (55 °C, 3 d). It was then ball milled to homogenize the sample. Particulate organic matter C and N concentration were determined from dry combustion (LECO, TruMac CN analyzer).
Soil Testing
Subsamples of 50 g were sent to the North Carolina Department of Agriculture and Consumer Services (NCDA & CS) state soil-testing lab for macro and micronutrient soil analysis. Soil was characterized for humic matter (HM), cation exchange capacity (CEC), pH, and base saturation. Mehlich-3 methodology was used (Mehlich, 1984).
Greenhouse Growth Trials
Preliminary Greenhouse Trial Protocol
Soil (dried and sieved to <4.75 mm) was thoroughly mixed in a bucket and scooped into six replicate 66 mL greenhouse growth tubes of 1.54-cm diameter, 16.1 cm height (Ray leach RLC4 cells “cone-tainers”). A cotton ball was positioned at the bottom of the tube to keep soil from falling out. Each replicate was assigned a random id number referred to as the Greenhouse id (GH id). Tubes were gently tapped 3 times to settle, and topped with
additional sample to fill the tube to within 1 cm of headspace. Tubes were placed in racks in order of their GH id number, leaving a cell between tubes (Figure 2).
25 tube on top of the soil. Seeds were covered with approximately 5 grams of sand to prevent accelerated rates of evapotranspiration and to protect seeds from drying out. Each tube was watered on top with a few mL of water to promote the growth of the germinated seedlings. Trays were then moved into a greenhouse kept at 20-30C depending on the season and time of day. Average weekly temperatures for each greenhouse trial were calculated (Figure 4). Trays were randomly arranged on two rectangular tables under equal light and temperature conditions across greenhouse trials. Greenhouse lights remained on for equal length across all trials (12 hours), adjusted for differences in sunrise and sunset during the different seasons.
The six subsamples of a soil were divided into three different water levels. Water levels were managed by bringing them to full water-holding capacity after drying to
approximately 80, 60, and 40% of water-holding capacity, in order to determine if variations in water content would affect plant growth. This initial experiment informed the process for the remaining greenhouse trials.
26 and three days. Once target water levels (determined by weighing trays every day) were reached, trays were capillary wetted for 20 minutes, and the cycle repeated for a total of 8 weeks of growth. Watering was repeated 47, 25 and 14 times for 80, 60 and 40% water-holding capacity, respectively.
Plant dry matter was harvested twice: first at four weeks and again at eight weeks (regrowth). Plant dry matter at each harvest was placed into separate envelopes. Plant samples were dried in the oven at 55 C for 3 days. Each plant sample was weighed and ground using a Udy Mill. The mg of dry matter per kg of soil was calculated from the weight of the plant sample divided by the dry soil weight of each tube.
At least 1 g of dry matter was needed to scan the plant samples using the Near Infrared Spectrometer (NIR) for N concentration. Most tubes did not produce enough dry matter, so plant samples from the same original soil sample were composited (across 3 water levels, 2 greenhouse replicates, and the four and eight-week harvest). Therefore, the 720 growth tubes were composited (after weighing each individual plant sample) into 120 envelopes for N content determination.
Statistical Analysis: Preliminary Trial 1
27 A mixed model was determined to account for variation from management (crop or pasture), city (5 different cities), sites (9 different sites), stress (3), and greenhouse rep (2) using proc GLIMMIX in SAS version 9.4 (SAS Institute Inc., Cary, NC, USA). The Virginia samples were initially taken out of the data set because they were sampled only from 0-10 cm. Management (crop or pasture) and different sites were set as random effects because they were not evenly distributed under both managements. Least square means (LS Means) was used to determine the predicted weight of stress level and depth by management, and the adjustment for multiple comparison was made using Holm-Tukey. All possible interactions between variables were analyzed. The final model with the smallest amount of variance was chosen using the Akaike's Information Criterion (AICc) and the Bayesian Information Criterion (BIC). Using the square root of dry matter production (the dependent variable) improved the fit of the model in SAS. The significance level used for all data analysis in this study was p < 0.05.
28
Standardized Greenhouse Trial Protocol (Trial 2-4)
Subsequent greenhouse trials followed similar protocol to the preliminary greenhouse trial with some alterations. The growth tubes were larger (see Figure 3) than trial 1 (164 mL; 20.95 cm height; 3.81 cm diameter; SC10 cells), with three replicates for each sample. Five pre-germinated sorghum-sudangrass seeds were planted in each tube and covered with sand. Trays were saturated in the laboratory and covered with cloth to avoid evaporation of water. After seeds sprouted in the laboratory, trays were moved into the greenhouse and placed under equal light and temperature conditions.
There was no significant, practical difference in water treatment, so all trays were wetted in the same manner. Once approximately 40% water-holding capacity was reached, trays were capillary wetted for 20 minutes and the cycle repeated. Plants were harvested at four and eight weeks in the same manner as the preliminary greenhouse trial.
Plant Nitrogen Content
29 development, the equation was then applied to all samples to estimate N and C
concentrations.
Plant N uptake (mg N kg-1 soil) was calculated as N concentration (g kg-1) multiplied by dry matter production (g dry matter kg-1 soil). Plant N uptake and dry matter production were used in the statistical analysis as the response variables for this study, termed together as “greenhouse growth.”
Statistical Analysis of All Data (Trials 1-4)
An initial correlation procedure (Proc CORR) was used for Greenhouse Trial 1 to understand the relationships between variables and to determine which would be
significantly related or collinear to one another in order to determine the best variables to include in a model. A selection procedure (proc GLMSELECT) was used to determine the variables with the greatest potential to explain variability in greenhouse growth. A principal component analysis using the selected variables was conducted to determine which variables had the greatest proportion of variability explained by them, and to check for existence of collinearity among variables. Finally, multiple linear regression was conducted with the significant principal components. Adjusted R2 is reported in the results to account for number of variables. Assumptions and residuals were tested with the Durbin-Watson test, Cook’s Distance, Leverage, Residuals and Partial Residuals plots, and normal probability plots.
30 Most important variables were considered from a combination of the lowest AIC, AICC, and SBC values with the highest R2. After Greenhouse Trial 1 was analyzed, subsequent
31
RESULTS AND DISCUSSION
Greenhouse Trial 1: Effect of Water Stress on Plant Dry Matter Production
An analysis of variance (ANOVA) using proc GLIMMIX was conducted to test how dry matter production varied as a function of water stress, soil depth, and field site for the 108 samples from North Carolina (648 experimental units total) in Greenhouse Trial 1. All main effects and the interaction of stress x depth x site (p=0.04) significantly impacted dry matter production.
The three-way interaction of stress x depth x site made the effect of stress on dry matter production complicated (Table 2). Field site was inherently different due to
differences in soil types and management practices. Therefore, field site was removed from the model and the effect of water stress and depth on greenhouse growth was conducted separately for each field site.
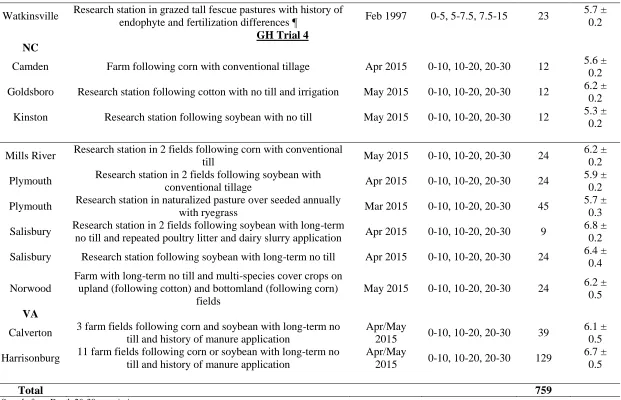
The ANOVA (Table 3 and Table 4) determined for each field site individually resulted in depth as a significant main effect in all locations in NC (p < 0.001); stress as a significant main effect in pastured fields in McKinney, VA (p =0.02); and stress x depth as an interaction effect in the hayed forage site in Plymouth, NC (p=0.04). However, a trend for lower dry matter production occurred in almost all field sites as water stress increased
(Figure 5).
32 examining its interaction with stress on dry matter production. The significant interaction of water stress and depth was most likely due to increased plant growth from the surface depth, which is in turn more susceptible to water stress.
In McKinney, VA, stress additionally affected dry matter production at high stress compared to low stress (p=0.01). The hayed forage site in Plymouth, NC (shown separately in Table 4) was the only field site with a significant interaction of water stress x depth (p=0.04). At this site, dry matter production was significantly lower with increasing stress at the surface depth (0-10 cm). At lower depths at this site, dry matter production was not significantly altered by water stress, but a trend for lower dry matter production occurred with increasing water stress (Figure 5).
Conclusions of water stress level analysis
While stress was not significant at many field sites, it was significant at sites with elevated dry matter production. Hayed forage in Plymouth had elevated dry matter production compared with other sites, likely due to greater N availability, and therefore, greater water demands by larger plants. Water stress was likely more pronounced in surface samples from this site compared with other field sites due to greater water use by the elevated dry matter production.
33 growth and water extraction than organic matter per se. The analysis in section 1 examines the drivers affecting dry matter production more closely.
Regardless of water stress level, the rank order of dry matter production among all 12 field sites was the same (this was important to note, because subsequent greenhouse trials were conducted at 40% water stress level). In addition, plant samples were combined across greenhouse growth replicates in order to determine plant N uptake (dry matter for NIR scan needed >1 g of dry plant material).
Statistical significance overall occurred in dry matter production, but among field sites, it only occurred at higher N supplying sites. Variation in dry matter production was due more to field site (49%) and soil depth (37%) than to water stress level (1%). While water stress level was significant overall in the data set, the magnitude of difference in dry matter production averaged only 0.2 mg g-1 soil.
For use as an assay, as long as water level was standardized, water stress level would not be a significant factor in studying greenhouse growth. In conclusion, while water stress level was a biologically interesting variable, it was not investigated further in subsequent greenhouse trials due to time and resource constraints. Subsequent greenhouse trials were conducted at one stress level (40%), in order to facilitate less frequent watering.
Soil Properties Associated with Greenhouse Growth 1. Greenhouse Trial 1
1.1.Selecting the key variables to predict greenhouse growth
34 soil properties across the 120 soil samples from NC and VA. Dry matter production was highly related to plant N uptake (R2 = 0.96; Figure 6). Interpretation of results was similar whether analyzing for dry matter production or plant N uptake, and therefore “greenhouse growth” described the general response across terms. The following analyses includes an initial correlation procedure of greenhouse growth with all 34 soil properties; a statistical selection procedure that chose the best variables to predict greenhouse growth and a principal component analysis using these selected variables, which was then run as a model to predict greenhouse growth.
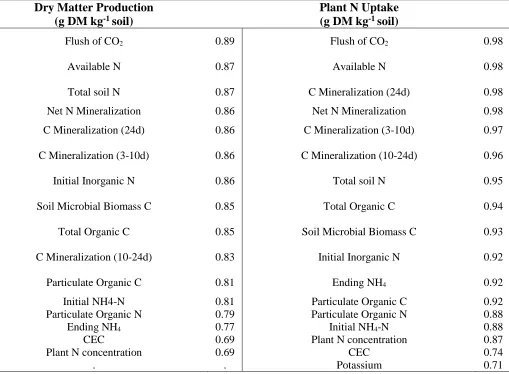
1.2.Soil biological properties correlated to greenhouse growth
Table 5 summarizes the soil properties correlated with greenhouse growth. A number of soil biological properties were highly correlated to greenhouse growth (using an a priori threshold of r> 0.70), including C mineralization during 3, 10 and 24 days, soil microbial biomass C (SMBC), net N mineralization during 24 days, and particulate organic C and N. Some soil chemical properties were also highly correlated to greenhouse growth, including cation exchange capacity (CEC), initial inorganic N, and total available N (initial inorganic N + net N mineralization during 24 days). Total soil N was slightly less correlated to
35
1.3.Selection procedure to choose best variables to predict greenhouse growth
Proc GLMSELECT was used to select variables (total of 34 available) to predict dry matter production across the 120 samples in Greenhouse Trial 1. This analysis yielded variables of the flush of CO2, SMBC, particulate organic C, available N, P, Mg, and Na as the most important. To predict plant N uptake, the selection procedure chose the same variables, excluding P and Na. Multiple linear regression using these variables yielded an adjusted R2 of 0.91 and 0.92 for dry matter and plant N uptake, respectively. However, Na, P, net N mineralization, and SMBC were not significant when used in the Type III sum of squares regression analysis (Proc GLM), so they were removed from the model. A model with only the flush of CO2, particulate organic C, available N, and Mg was then developed. This model accounted for 90 and 92% of the variation in dry matter and plant N uptake, respectively.
36 The selection procedure, after taking out the hayed pasture samples, proceeded to choose particulate organic N instead of Mg as an important variable to explain greenhouse growth. Particulate organic C and N were highly related (R2 = 0.91; slope of 16.4), so it is clear why they would be chosen together in the model. With this information, a principal component analysis was conducted to account for the variance in the data using the variables selected by the GLMSELECT (flush of CO2, available N, SMBC, and particulate organic C and N).
1.4.Principal component analysis of Greenhouse Trial 1 to test the explained variance
The first two principal components explained 94% of the variance in greenhouse growth using the flush of CO2, available N, SMBC, and particulate organic C and N (Figure 7). The first principal component explained 89% of the variance, and the second principal component explained 5%. All of the variables had similar loading values of 0.43-0.46 in the first component, suggesting that these five measurements of organic matter were equally important (Table 6).
37
1.5.Further testing the relationship of the biological properties with greenhouse
growth
Available N, which is the sum of net N mineralization in 24 days plus initial inorganic N, was hypothesized to be the best indication of greenhouse growth. In a simple linear regression, available N explained 77% of the variation in dry matter production and 76% of the variation in plant N uptake (Table 8). As available N increased, greenhouse growth increased. A quadratic fit and transformation to the square root of dry matter and plant N uptake improved the model to explain 82 and 84% of dry matter and plant N uptake, respectively.
Net N mineralization, which excludes initial inorganic N, explained 81% of the variation in greenhouse growth in a simple linear regression (Table 8). Net N mineralization by itself was an excellent predictor of greenhouse growth, but the long evaluation period and multiple analyses needed (initial and ending NH4 and NO3 values) limit its suitability for soil testing facilities, which require rapid reporting of results to their clientele. The flush of CO2, however, is a process that only takes three days of incubation and uses inexpensive
equipment. How the flush of CO2 related to net N mineralization and greenhouse growth was therefore preferentially explored as a potential rapid soil test of N availability.
In order to look at the possibility of the flush of CO2 to predict greenhouse growth, the C:N ratio of various fractions was explored. Particulate organic C and N were highly related, with an R2 of 91%. The more active fraction of C mineralization in 24 days was highly related to N mineralization in 24 days (R2=0.71).
38 predicting N mineralization in 24 days. Net N mineralization was highly related to plant N uptake and dry matter production (R2=0.82). If net N mineralization was a good indicator of greenhouse growth, it would be possible to explore the flush of CO2 instead as a predictor of greenhouse growth, since it was highly related to net N mineralization (R2=0.77).
In a simple linear regression (proc GLM) the flush of CO2 predicted 77% of the variation in net N mineralization, 78% of the variation in dry matter production, and 79% of the variation in plant N uptake. The equations to predict net N mineralization, dry matter production and plant N uptake in Greenhouse Trial 1 (n=120) were:
Net N mineralization = -0.41 + 0.35 (flush of CO2) ; R2= 0.77
Plant dry matter production = 1.5 + 0.013 (flush of CO2) ; R2= 0.78
Plant N uptake = 14.3 + 0.17 (flush of CO2) ; R2= 0.79
39
1.6.Soil texture influence on the relationship between greenhouse growth and soil
biological properties
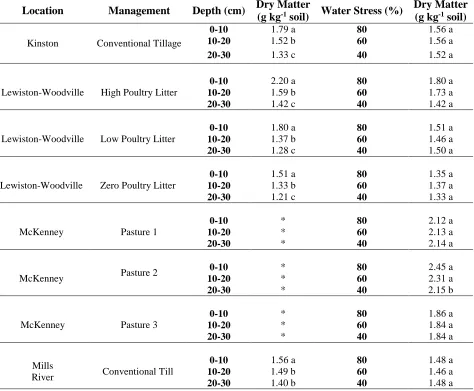
An additional characteristic, soil texture, may influence the relationship of the biological indicators when predicting greenhouse growth (Pare and Gregorich, 1999). While the variable selection procedure (proc GLM) did not select texture as a variable, it was still necessary to conduct the analysis, as soil texture is proposed to affect the rate and magnitude of mineralization, especially for widely different soil textures such as sands and clays
(Griffin, 2008). The key soil biological N indicators: available N, net N mineralization, and the flush of CO2 were analyzed with texture in an ANOVA.
An ANOVA model to predict plant N uptake using the flush of CO2 and texture in Greenhouse Trial 1 resulted in a significant main effect of the flush of CO2 (p<0.001), as well as an interaction effect of the two terms (p=0.053) (Table 9). The model was improved by 7% when including texture as an additional variable to the flush of CO2. Sandy loam was the reference variable with a slope of 0.15 for the flush of CO2. Clay loam and loam had
significantly greater slopes of 0.21 and 0.20, respectively (Table 10Table ).
Predicting dry matter production also resulted in a main effect of the flush of CO2 and the interaction of texture and the flush of CO2. The slope of greenhouse growth as predicted by the flush of CO2 was greater for clay, loam, and sandy clay loam classes than for sandy loam textural class (Figure 8; Table 10).
40 class. For all biological indicators, the magnitude of difference in slope by soil texture was not large. The major differences noted were clayey versus sandy loam soil textures. shows the differences in slope for soil textures in Greenhouse Trial 1.
There are issues when interpreting texture (a categorical variable) in a model to predict greenhouse growth. Soil textures may be on the borderline of two different USDA classifications. In addition, soil texture in the greenhouse may have been confounded with soil water content, depth, or soil type, which ultimately affected the relationship of
mineralization of C and N to greenhouse growth. Soil textural analysis would be better investigated with a balanced set of textural classes.
An additional way to analyze texture was to analyze the continuous variable of sand content and its effect on biological indicators to predict greenhouse growth. Sand content was used as an indirect method to study the effect of silt and clay on biological indicators.
Therefore, an ANOVA with the flush of CO2 and sand was analyzed. The main effect of sand was not significant (p=0.24). The interaction of the flush of CO2 with sand was significant (p<0.03). The model indicated that as sand content increased (or clay and silt decreased), greenhouse growth decreased. However, the Type III sums of squares models placed significantly more emphasis on the F value of the flush of CO2 (Table 11). Adding sand in the model only improved the model by 4%, indicating that sand content was not a major indicator of greenhouse growth.
41
1.7.Relationship between greenhouse growth and soil biological properties with soil
depth
Available N in the surface depth (0-10 cm) had a significantly different relationship with dry matter production than in subsurface depths (10-20 cm and 20-30 cm) (Figure 9a). In contrast, soil depth did not significantly alter the relationship between greenhouse growth and net N mineralization in Greenhouse Trial 1 (Figure 9b). A similarly stable relationship of greenhouse growth with the flush of CO2 occurred, independent of soil depth (Figure 9c).
All indicators had a similar trend of depth, but only available N was significantly different. Some soils sampled in Lewiston-Woodville, NC had a history of poultry litter application, resulting in high nitrate concentration, which may have been the driving factor in the disparate relationship of available N with depth. The relationship of biological indicators with management practices at Lewiston-Woodville was explored in greater detail in Section 1.7. In summary, soil depth did not significantly alter the relationship of either soil biological indicators (the flush of CO2 and net N mineralization) with greenhouse growth in Greenhouse Trial 1.
1.8.Differences of zero, low, and high poultry litter applications on the flush of CO2 in
Lewiston-Woodville, NC
The flush of CO2 in three days explained 82% of the variability in dry matter
42 poultry litter application had significantly more nitrate than the low and zero poultry litter applications (Table 13), and therefore, this additional N caused an increase in slope.
Available N explained 86% of the variation in dry matter production. The slopes for the three treatments were not significantly different to predict greenhouse growth with total available N. In essence, initial inorganic N helped explain the variability of the different treatments. Since the flush of CO2 was highly correlated to N mineralization, it was
speculated that the flush of CO2 combined with inorganic N would be a good predictor of dry matter production in the greenhouse with these samples across treatments. Management practices such as manure application suggest that the need for initial inorganic N is an important addition to biological activity in predicting greenhouse growth production.
Zn was highly correlated (r=0.98) to greenhouse growth. Zn concentration predicted greenhouse growth in a simple linear regression model with an R2 of 0.89. High Zn
concentration was in the poultry litter, which increased as poultry litter increased, indicating that it was more of a coincidental variable than an actual predictor of N uptake. Some micronutrients can affect N uptake by plants, but this association here was likely only
coincidental. Correlations to micronutrients and other variables will continue to be examined in order to determine whether they may be coincidence or a true explanatory variable of greenhouse growth.
1.9.Does land management affect the relationship between greenhouse growth and
soil biological properties?
43 for 88% of the variation in dry matter production and 92% of the variation in plant N uptake. The relationship between dry matter production and available N was significantly affected by management condition. The slope of dry matter production as a function of available N was greater with hayed pasture (0.032) than with no tillage (0.027) and conventional tillage (0.022). However, the relationship between plant N uptake and available N was not affected by management condition (p=0.50).
Net N mineralization was not as sensitive to land management as available N, resulting in no effect of management on the relationship between greenhouse growth and N mineralization. Net N mineralization explained 86 and 87% of the variation in dry matter production and plant N uptake, respectively, in soils from Plymouth NC.
The flush of CO2 explained 86% of the variation in dry matter production and 89% of the variation in plant N uptake from soils in Plymouth NC. An additional 3% of variation was explained by management differences (i.e. conventional till, no till, and hay pasture) (p=0.02). Slopes of dry matter production as a function of the flush of CO2 were 14, 16, and 22 mg dry matter mg-1 CO2-C for no till, hay, and conventional till, respectively. The range of values in dry matter and the flush of CO2 with conventional tillage was narrower than with hay or no tillage, so the relationship may not have been as robust in this situation.
44 The surface samples from the conventionally tilled soil potentially may have had lower biological activity due to soil disturbance with tillage prior to sampling.
While management differences did occur, overall, the flush of CO2 explained the majority of the variation (86%) at this field site. By obtaining a larger range of values for conventionally tilled soil, a more robust conclusion could be drawn that would determine if the relationship in conventionally tilled soil is different than no till or hay pasture in predicting greenhouse growth as a function of CO2 evolution. For these samples, the flush of CO2 was highly effective by itself in predicting greenhouse growth across different management practices.
1.10. Conclusions from Greenhouse Trial 1
In conclusion, the biological soil properties such as soil microbial biomass C, the flush of CO2 and total available N were all good predictors of greenhouse growth (both plant N uptake and dry matter production). High nitrate in soils managed with poultry litter (see section 1.7) altered relationships slightly. The flush of CO2 was a viable surrogate as a
predictor of greenhouse growth, and thus was a focus of tests in subsequent greenhouse trials.
2. Greenhouse Trial 2
2.1.Selecting the key variables to predict greenhouse growth