An Empirical Analysis of Percentage Split
Distribution Method for Clustering High
dimensional data
Joy Christy. A1, Hari Ganesh.S2
1ResearchScholar, Department of Computer Science, Bishop Heber College, Trichy, India
2Assistant Professor, Department of Computer Science, H.H. The Rajah‟s Collge, Pudukottai, India
ABSTRACT:Data Mining (DM) refers to the discovery of meaningful data models from large data sources. Unlike querying the legacy DB‟s for retrieval of information, the techniques of DM uncovers the hidden knowledge that makes sense in analysis of facts. Clustering is one of the descriptive techniques of DM that group‟s data objects based on their similarity. Though there are quite good numbers of algorithms available in clustering, the complexity, the time taken to build clusters and cluster compactness are still remain as issues. Hence, the improvisation of clustering algorithms is always considered as a thrust area of research. The core objective of this paper is to simplify the task of clustering by proposing a novel Percentage Split Distribution (PSD) clustering which maximizes the cluster performance with minimum time duration. A comprehensive experimental study is conducted to assess the performance of PSD and evaluated against the existing clustering methods in terms of cluster compactness and time. The results clearly indicate that PSD have built meaningful and compacted clusters with the reduced time than the existing ones. Another contribution of this paper includes a new cluster compactness analysis method called SR silhouette (Single Representative Silhouette) distance which is well-suited for analyzing the compactness of PSD and produces the same results as standard silhouette distance measure with minimized computational cost.
KEYWORDS: Percentage split, Feature Selection, Pearson Correlation, Cluster Compactness, Silhouette Distance
I. INTRODUCTION
Clustering is the process of segmenting the data objects into groups (clusters) of similar data which is useful for analyzing the variation among groups such as identifying different types of customer whose buying habits are same, grouping similar standards of students such as small, medium and fast learners and people of same locality etc. Clustering techniques analyze the present status of data objects so as to initiate the necessary steps or plans for future improvement. The traditional clustering algorithms are majorly categorized into hierarchical and partitional (Wu et al., 2015). Hierarchical clustering partitions the data objects into a tree like structure represented by the term called dendogram which connects the data objects in to a U- shaped hierarchical structure. Agglomerative hierarchical clustering is a bottom up approach begins by placing each object in a separate cluster and iteratively merges closest clusters until the data objects merged into a single cluster (Ozturk et al. 2015). Divisive hierarchical clustering is a top down approach which is a reciprocal process of agglomerative clustering where all data objects are placed in one single cluster and iteratively splits dissimilar clusters until all data objects are separated. The issues with hierarchical clustering are:
• Lack of Global optimum solution • Static cluster assignments
• Excessive computational cost and time
In contrast to hierarchical, Partitional clustering algorithms are said to be „dynamic‟ and updates the members of clusters when there seem to be an improvement in cluster performance. Partitional clustering decomposes the data objects into set of disjoint units using similarity measures and probability density functions so as to bring in optimized cluster solutions (Prabha et al. 2014). The issues with partitional clustering are:
• Traps into local optima • Lack of robustness
• Intervention of hard mathematical calculations
Many proposals have been introduced to overcome the issues with the traditional algorithms, an yet another approach is the concept of percentage split distribution clustering which is a promising solution for simplifying the task of clustering by lesser iterations and computations. The idea of PSD has risen from the concept of clustering of numerical objects through linear equation (Christy et al. 2016).
II. BACKGROUND
Fahim et al. (2008) have proposed a method of shifting the center of the large cluster towards small cluster at the end of K-means algorithm for re-computing the membership of small cluster points. The authors have suggested that their proposed method could be extensively used in the datasets that contains spherical shaped clusters with large difference in their sizes and have demonstrated that their approach improved the quality of clusters. The author also evidences that their proposed algorithm produce the same result as K-means when the centers of the smaller clusters lie out of them, because in this situation the clusters seem to have very small difference between their radius.
Hill et al. (2013) have compared the species distributions with cluster centroids of spherical K-means clustering using the cosine similarity measure. The authors have created an R program called clustaspec based on spherical K-means clustering that is started by being agglomerative and continued with a second phase in which the smallest clusters are systematically removed and their species distributed to larger ones. The authors have suggested that the spherical K-means algorithm is a powerful clustering method for measuring the similarity between clusters.
Zhong (2008) have investigated an online version of the spherical K-means algorithm based on Winner- Take- All competitive learning. The proposed algorithm is designed in such a way that each cluster centroids are incrementally updated in a given document. The author has demonstrated that the online spherical K-means algorithm could achieve significantly better clustering results than the batch version, (each cluster mean vector is updated, only after all document vectors being assigned), especially when an annealing-type learning rate schedule is used. The author have also presented some heuristics to improve the speed, yet almost without loss of clustering quality.
Hornik et al. (2012) have presented the theory underlying the standard spherical K-means problem and suitable extensions, and introduced the R extension package skmeans which provided a computational environment for spherical K-means clustering featuring several solvers: a fixed-point and genetic algorithm, and interfaces to two external solvers (CLUTO and Gmeans). Performance of these solvers is investigated by means of a large scale an experiment. A large scale benchmark experiment analyzing the performance and efficiency of the available solvers have showed that the presented approaches scaled well and could be used for realistic data sets with an acceptable clustering performance. The external solvers Gmeans and CLUTO are both very fast, with CLUTO typically providing better solutions. The genetic algorithm is found excellent solutions but has the longest runtime, whereas the fixed-point algorithm is a very good all-round approach.
Torra et al. (2002) have introduced an alternative representation for large dimensional data sets. Instead of using 2D or 3D representations, data is located on the surface of a sphere. Together with this representation, a hierarchical clustering algorithm is defined to analyze and extract the structure of the data. The algorithm built a hierarchical structure (a dendrogram) in such a way that different cuts of the structure lead to different partitions of the surface of the sphere. This could be seen as a set of concentric spheres, each one being of different granularity. Also, to obtain an initial assignment of the data on the surface of the sphere the author have developed a method based on Sammon's mapping.
III.METHODOLOGY
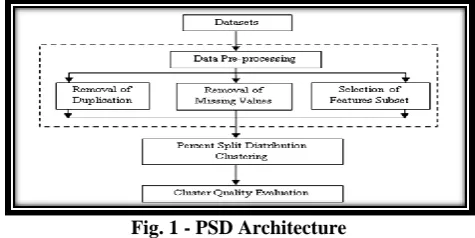
The pictorial representation of the methodology presented in Fig. 1, consists of three independent segments called preprocessing, Percentage Split Distribution (PSD) Clustering and cluster quality evaluation. The necessity for preprocessing is not only to normalize the data objects by removing the redundant records and missing values but also to extract the subset of features that influences and improves the cluster quality. The PSD gets the normalized data and meaningful features as its input from the preprocessing segment and generates clusters of similar data. The third segment, cluster quality evaluation validates the quality of output clusters that are generated by PSD using a novel SR silhouette distance measure.
Fig. 1 - PSD Architecture
A.FEATURE SELECTION
Not all features of the datasets are useful for the construction of knowledge descriptive model, as some of them have very low impact with decision making. The identification and negation of less impacted features are the primary concern of feature selection algorithms. In spite with various feature selection techniques in the literature PSD only manipulates with positively correlating features to obtain enhanced clustering results. Hence, in this paper, the standard Pearson Correlation method is employed to identify the relationship between the variables.
A.Pearson Correlation
Pearson correlation method examines whether the linear relationship between two numerical features R and S is positive, negative or no correlation by resulting a value ranging from 1to -1, where 1 represents a positive correlation, 0 represents no correlation and -1 represents a negative correlation (Yu et al., 2003). The Pearson correlation formula is denoted in Equ.1.
.
2 . 2
R R S S PCC
R R S S
(1)
Where R’ and S’ are means of variables R and S. The existence of positive correlation is guaranteed with an increase in feature ‘r’ also let an increase in feature„s‟ or when the features decrease together. The value 1 denotes the perfect positive correlation between features. Thus, this segment of methodology extracts the most positively correlating features reduced from the original set to be sent as an input to the next stage.
B.PERCENTAGE SPLIT DISTRIBUTION CLUSTERING
One of the primary objectives of this paper is to propose a simplified clustering technique that helps the user to conceptualize the task of clustering in a better way. Hence, the proposed method consists three simplified steps such as accumulation, percentage split distribution and if-then association.
1. Accumulation
1 1ij m n SR V i i j
(2)
2. Percentage Split
Percentage Split is a crucial step of the proposed method, where the data objects are assumed that they are well distributed between the range 0 to100% in which the min (SR) represents 0% and the max (SR) represents 100%. The clustering portions are then defined by dividing the 100% with number of inputted cluster. This step is an iterative process where each iteration calculates the lower and upper limits of each cluster C1…Ct using percentage split distribution formula denoted in Equ.3.
max min *
min
PSD SR SR percentage SR (3)
Where max (SR) and min (SR) denote maximum and minimum values of SR and percentage represents the split value for each cluster.
C.If-then Association
This step gets the lower and upper limits of each cluster from the previous percentage split distribution step and formulates an if-then structure to assign the data objects in to its suitable clusters. SR value of a data object is compared with the boundary limits of each cluster and assigns the data object into the cluster that it falls under. This step is repeated until all data objects are assigned in a cluster. Fig.2 shows the step-by-step process of PSD.
D.Proposed Pseudo Code
Fig.2 - PSD Pseudo code
1.1.Cluster Compact Analysis
The term cluster validation is concerned with the assessment of quality of clusters generated by any algorithm. Cluster compactness is a validation measure deals with the analysis of closeness of data objects within and between the cluster members. Compactness of the cluster members are often measured with the unit called “variance” (Liu et al., 2010)
1. Input dataset
2. Obtain the most correlated subset of features using Pearson Correlation 3. Store the subset of features in a dataset D
4. for each data object i1…in add the value V of features
1 1ij m n SR V i i j
5. Get the number of cluster from the user
6. Compute the Cluster Percentage (CP) as 100/ number of cluster 7. percentage=CP
8. for each cluster C1.. Ct compute the percentage split distribution as
PSD=((max(SR)-min(SR) )*percentage/100)+min(SR)
percentage+=CP
9. Set the upper and lower limits for each cluster with the values obtained in step 6.
where the variance of a data object within the cluster should be minimized than the members of other clusters. In this paper, a novel SR silhouette cluster compactness measure is taken to analyze the compactness of cluster.
A.SR Silhouette Distance
SR Silhouette coefficient metric measures the fitness of data object with its associating cluster. The SR silhouette coefficient of any individual object „n‟ is computed using the formula denoted in Equ.4.
max ,
y n x n
s n
x n y n
(4)
where „x‟ is the average distance of „n‟ with the objects in the same cluster, „y‟ is the minimum of average distance of
„m‟ to the objects with other clusters. The small value in x (n) and large value in y (n) denotes the best fit of data object
‘n’ with its associating cluster Ci. As like correlation the value closer to 1is expressed as the best results in SR silhouette co-efficient. The distance between the objects for analyzing the cluster compactness is computed using a new measure called SR Difference (SRD) measure which computes only the absolute SR difference of an object with all other objects using equ. (5).
| |
1 1
n n
Dij i j SR SRi j (5)
where i and j denote the data objects. Moreover, the SR difference measure is simple and able to obtain the same result as Euclidean distance with less computational cost by evading the square, and root operations.
IV.ILLUSTRATION
As an illustration, this section demonstrates the methodology of PSD clustering with an interval scaled numerical dataset (ISN). The dataset is designed with two attributes X and Y with 10 data objects (D1…D10) for the better understanding of PSD. The first three columns of Table 1 represent the interval scaled numerical dataset.
A.CORRELATION ANALYSIS
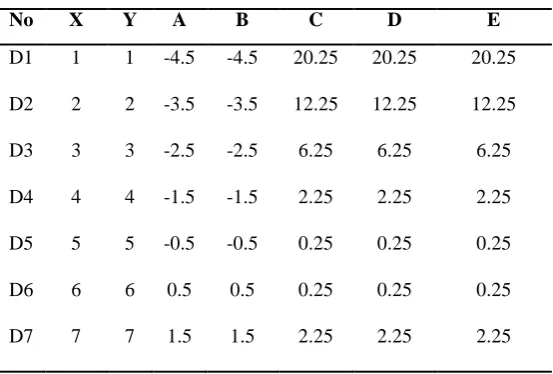
An important criterion for PSD is to ensure the positive correlation of features to attain best clustering results. Hence, the first step in the illustration computes the correlation between the features X and Y of the sample interval scaled numeric dataset using Pearson correlation method and shown in table.1. (The abbreviation used in table.1are expanded in appendix A)
Table 1 - Correlation Analysis of ISN Dataset. No X Y A B C D E
D1 1 1 -4.5 -4.5 20.25 20.25 20.25
D2 2 2 -3.5 -3.5 12.25 12.25 12.25
D3 3 3 -2.5 -2.5 6.25 6.25 6.25
D4 4 4 -1.5 -1.5 2.25 2.25 2.25
D5 5 5 -0.5 -0.5 0.25 0.25 0.25
D6 6 6 0.5 0.5 0.25 0.25 0.25
D8 8 8 2.5 2.5 6.25 6.25 6.25
D9 9 9 3.5 3.5 12.25 12.25 12.25
D1 0
10 10 4.5 4.5 20.25 20.25 20.25
X =5.5 Y =5 .5 ∑C =82.5 ∑D =82.5 ∑E=82.5
X X Y Y 82.5 82.5
1 82.5
2 2 82.5 82.5
X X Y Y
PCC
As the value of PCC is 1 there is a perfect positive correlation between the features X and Y and there exists a linear relationship. Hence, these two features are selected as best subset of features and are further be processed for clustering similar data.
Once when the selection of meaningful features is successfully done, the summation of the selected features is performed to obtain a SR (Single Representation) of data object as shown in table.2. SR of data object is essential to sort out the position of data object in the cluster distribution ranging from 0% to 100%, where the min (SR) is 0% and max (SR) is 100%.
Table 2 - SR computation of Data objects D. No X Y SR
=(X+Y)
D1 1 1 2
D2 2 2 4
D3 3 3 6
D4 4 4 8
D5 5 5 10
D6 6 6 12
D7 7 7 14
D8 8 8 16
D9 9 9 18
D10 10 10 20
B. PERCENTAGE SPLIT DISTRIBUTION
This section of illustration is designed to construct different numbers of clusters using percentage split distribution. The prerequisite for the proposed method is to define the value for cluster percentage (CP) which is computed by dividing the 100% into number of cluster. Supposing the number of clusters to be formed with the ISN dataset is 5, the CP would then be 20%, which means the data objects are sliced into five clusters with 20% of interval. The minimum SR value is 2(0%) and Maximum SR value is 20(100%) which is depicted in Table.2.
Percentage =Percentage + CP
C= ((max (SR)-min (SR))*percentage/100) +min (SR) CP=100/5=20
Cluster 1
Percentage =0+20=20
Cluster 2
Percentage =20+20=40
C2= ((20-2)*40/100) +2 = 7.2+2=9.2
Cluster 3
Percentage =40+20=60
C3= ((20-2)*60/100) +2 = 10.8+2 = 12.8
Cluster 4
Percentage =60+20=80
C4= ((20-2)*80/100) +2 = 14.4+2 = 16.4
Cluster 5
Percentage =80+20=100
C5= ((20-2)*100/100) +2=18+2 = 20
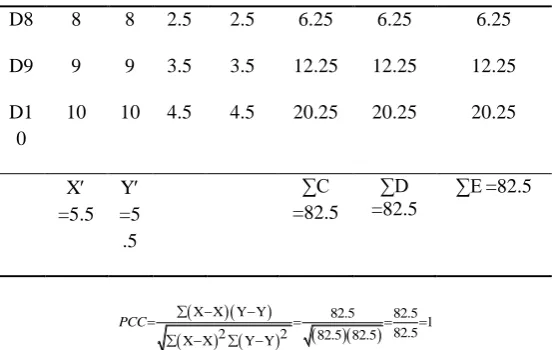
Table 3 - Cluster Alignments of data objects (Sample Data set)
Cluster Number Cluster Percentage Lower Bound Upper Bound Data objects
1 20% SR>=2 SR<=5.6 D1, D2
2 40% SR>5.6 SR<=9.2 D3, D4
3 60% SR>9.2 SR<=12.8 D5, D6
4 80% SR>12.8 SR<=16.4 D7, D8
5 100% SR>16.4 SR<=20 D9, D10
table.3. holds the upper and lower boundaries of each cluster which is transformed as an if-then association to classify the data objects. The if-then association of a data object i dataset is defined as follows:
if(SRi>=2 && SRi<=5.6)
assign in “Cluster 1” else if(SRi>5.6 & SRi<=9.2)
assign in “Cluster 2”
else if(SRi>9.2 && SRi<=12.8)
assign in “Cluster 3”
else if(SRi>12.8 && SRi<16.4)
assign in “Cluster 4” else
assign in “Cluster 5”
Fig.3 - Cluster Residuals of Data Objects
C.SR SILHOUETTE DISTANCE CLUSTER COMPACTNESS ANALYSIS
The distance between the data objects are computed using the new SR Difference Measure and presented in Table.4 with which SR silhouette co-efficient is measured.
Table 4 - SR Sillhouette Distance of Data Objects SR 2 4 6 8 10 12 14 16 18 20 2 0 2 4 6 8 10 12 14 16 18
4 2 0 2 4 6 8 10 12 14 16
6 4 2 0 2 4 6 8 10 12 14
8 6 4 2 0 2 4 6 8 10 12
10 8 6 4 2 0 2 4 6 8 10
12 10 8 6 4 2 0 2 4 6 8
14 12 10 8 6 4 2 0 2 4 6
16 14 12 10 8 6 4 2 0 2 4
18 16 14 12 10 8 6 4 2 0 2
20 18 16 14 12 10 8 6 4 2 0
1. SR silhouette Coefficient Demonstration of data object
The data object D1 is placed in cluster 1and the members of cluster 1 are {D1, D2}. The SR distance value of D1 and D2 are {0, 2}. The average SR distance (xD1) of D1 in the given cluster is (0+2)/2=2/2=1. The average distance of D1 from the objects of other clusters is computed so as to find the minimum average distance (yD1) of all clusters.
Members of Cluster 2: {D3, D4} = SR distance of D1 with D3 and D4 is {4, 6} = (4+6)/2=10/2=5 Members of Cluster 3: {D5, D6} = SR distance of D1 with D5 and D6 is {8, 10} = (8+10)/2=18/2=9 Members of Cluster 4: {D7, D8} = SR distance of D1 with D7 and D8 is {12, 14} = (12+14)/2=26/2=13 Members of Cluster 5: {D9, D10} = SR distance of D1 with D9 and D10 is {16, 18} = (16+18)/2=34/2=17
The minimum average distance of all clusters=5
max ,
y n x n
s n
x n y n
co-efficient of the proposed PSD clustering is 0.7, which is desirable and shows a good sign of ensuring the cluster compactness.
Fig.4 - SR Silhouette Co-efficient of Clusters
V.EXPERIMENTATION
The effectiveness of PSD clustering is interpreted by developing a java program and compared with the performance of existing clustering algorithms. Three datasets namely Iris, diabetes and mammography are taken from UCI (University of California Irvin) machine learning repository and evaluated against the proposed PSD, Simple K-means, DBSCAN and Expectation Maximization algorithms. The experimentation over the existing techniques is carried out using the popular data mining tool Weka 3.6 and analyzed with the results of PSD program. The description of each dataset and their results with respect to experimenting algorithms is presented in the subsequent section.
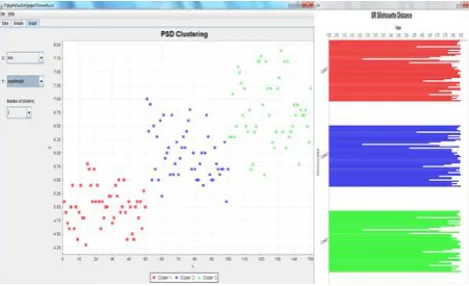
A.IRIS DATASET
Iris dataset is a popular dataset that can be widely applied to evaluate the algorithms of pattern recognition and data mining. The dataset contains 150 instances with four attributes which categorizes three classes of iris plants. Among the three classes one is linearly separable than the other two. The performance evaluation with respect to the PSD algorithm with SR silhouette measure is shown in Fig.5.
Fig. 5 - Iris Cluster Assignments with SR Silhouette Distance (3 Clusters)
Fig. 6 - Representation of Iris Cluster Members and Time
Table.5 explicates the comparative results of the performance of PSD algorithm against the traditional clustering algorithms with its number of cluster, number of cluster members and time taken to build the model.
Table 5 - Comparative Analysis of Algorithms - Iris S.No Algorithm Number
of Clusters
Number of cluster members
Time Taken to Build Model
1 PSD 3 50, 50, 50 0.015 Seconds
2 Simple k-means 3 46, 50, 54 0.6 Seconds
3 EM 3 41, 50, 59 0.8 Seconds
4 Hierarchical Cluster 3 50, 66, 34 0.12 Seconds
B.DIABETES DATASET
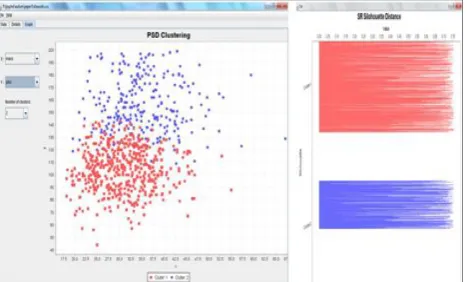
The diabetes dataset contains several restrictions on the selection of the instances from a huge database, particularly in the selection of females with at least 21 years old. The dataset actually holds 752 instances with eight attributes excluding the class attribute with which four correlating attributes such as plasma glucose tolerance test, body mass index, diabetic pedigree function and age are chosen for the comparative analysis of clustering algorithms. The result of clustering with SR silhouette distance is displayed in Fig.7.
The value „0‟ in class attribute denotes the non-existence of diabetic and „1‟ denotes the existence of diabetic, the dataset actually contains 489 benign instances and 263 malignant instances, out of which the PSD algorithm could group 492 benign instances with 263 malignant instances with the least computational time of 0.31 seconds.
Fig.8 - Representation of Diabetes Cluster Members and Time
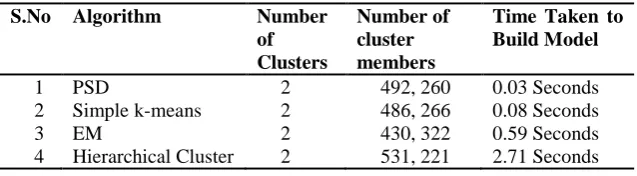
Table.6 explicates the comparative results of the performance of PSD algorithm against the traditional clustering algorithms with its number of cluster, number of cluster members and time taken to build the model.
Table 6 - Comparative Analysis of Clustering Algorithms – Diabetes S.No Algorithm Number
of Clusters
Number of cluster members
Time Taken to Build Model
1 PSD 2 492, 260 0.03 Seconds
2 Simple k-means 2 486, 266 0.08 Seconds
3 EM 2 430, 322 0.59 Seconds
4 Hierarchical Cluster 2 531, 221 2.71 Seconds
C.MAMMOGRAPHIC MASS DATA SET
Fig. 9 - Mammographic Mass Data Set Cluster Assignments
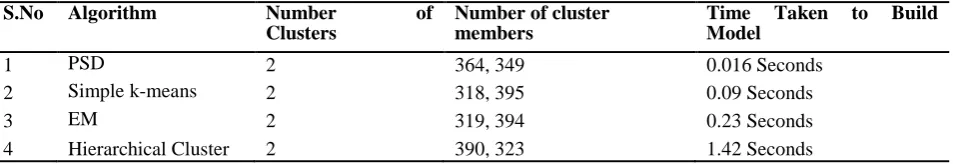
The severity of the disease is predicted with „0‟ means benign and „1‟ means malignant. There are 364 benign instances with 349 malignant instances are presented in the dataset, out of which PSD could correctly classify all benign and malignant accurately with 0.016 seconds which is proven in Fig.10.
Fig.10 - Representation Mammographic Cluster Members and Time
Table 7 - Comparative Study of Algorithms - Mammographic Mass Dataset S.No Algorithm Number of
Clusters
Number of cluster members
Time Taken to Build Model
1 PSD 2 364, 349 0.016 Seconds
2 Simple k-means 2 318, 395 0.09 Seconds
3 EM 2 319, 394 0.23 Seconds
4 Hierarchical Cluster 2 390, 323 1.42 Seconds
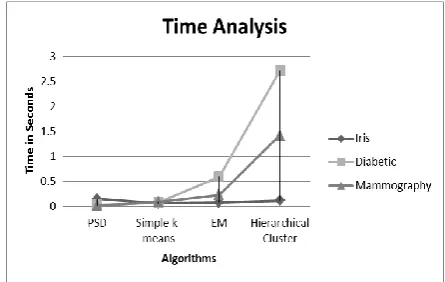
VI.RESULTS AND DISCUSSIONS
Fig. 11 - Combined Analysis of Algorithms over Time
Table 8 - Average Silhouette Distance S.
No
Dataset Name Average SR Silhouette
Distance
1 Iris 0.79665 2 Diabetes 0.74127 3 Mammography 0.70831
VII.CONCLUSION
This paper presents a new methodology called Percentage Split Distribution Clustering that splits the accumulation distribution of data objects into percentage wise split as equal to the number of clusters. As PSD evades the unnecessary iterations that are necessitated with the traditional way of choosing initial centroids it drastically reduces the time taken for building clusters. The effectiveness of PSD has been examined with three datasets and the experiment has clearly shown that the method builds good quality clusters with the average silhouette distance between data objects is greater than 0.7, which is a significant result on the compactness of clusters with the time taken to build clusters is less than simple k-means, EM and Hierarchical clusterer. Moreover, PSD addresses global optima problem by setting the cluster boundaries by considering both extremist of instances and the slices are made with the global position of the data object. PSD is simple and is alone sufficient for grouping data objects where there exists linear correlation between features. For non-linear datasets, this method is incorporated as an initial step with k-means algorithm where most of the data objects are already sorted out with PSD which is then be fine-tuned with k-means with less number of iterations.
Appendix A. Description of Table 1.
A=(X-X) B=(Y-Y) C= (X-X) (Y-Y) D=(X-X) 2 E=(Y-Y) 2
REFERENCES
1. Wu, X., Wu, B., Sun, J., Qiu, S. and Li, X., 2015. A hybrid fuzzy K-harmonic means clustering algorithm. Applied Mathematical Modelling, 39(12), pp.3398-3409.
2. Ozturk, C., Hancer, E. and Karaboga, D., 2015. Dynamic clustering with improved binary artificial bee colony algorithm. Applied Soft Computing, 28, pp.69-80.
4. Joy Christy.A and Hari Ganesh.S. 2016, February. An Enhanced Equilin Multi-Clustering Algorithm for Constructing Numerical Clusters, ENVISTA-2016, International Conference on Emerging Novelties and Vistas in Space Technologies and Applications (Article in press). 5. Fahim, A.M., Saake, G., Salem, A.M., Torkey, F.A. and Ramadan, M.A., 2008. K-means for spherical clusters with large variance in sizes.
Journal of World Academy of Science, Engineering and Technology.
6. Hill, M., Harrower, C.A. and Preston, C.D., 2013. Spherical k‐means clustering is good for interpreting multivariate species occurrence data. Methods in Ecology and Evolution, 4(6), pp.542-551.
7. Zhong, S., 2005, August. Efficient online spherical k-means clustering. In Neural Networks, 2005. IJCNN'05. Proceedings. 2005 IEEE International Joint Conference on (Vol. 5, pp. 3180-3185). IEEE.
8. Hornik, K., Feinerer, I., Kober, M. and Buchta, C., 2012. Spherical k-means clustering. Journal of Statistical Software, 50(10), pp.1-22. 9. Torra, V. and Miyamoto, S., 2002. Hierarchical spherical clustering. International Journal of Uncertainty, Fuzziness and Knowledge-Based
Systems, 10(02), pp.157-172.
10. Yu, L. and Liu, H., 2003, August. Feature selection for high-dimensional data: A fast correlation-based filter solution. In ICML (Vol. 3, pp. 856-863).