ISSN(Online): 2320-9801
ISSN (Print): 2320-9798
I
nternational
J
ournal of
I
nnovative
R
esearch in
C
omputer
and
C
ommunication
E
ngineering
(An ISO 3297: 2007 Certified Organization)
Vol. 4, Issue 3, March 2016
Position Control of Servo Driven Ball Screw
for Minimizing Backlash
Pallavi Mathur1, Dr. Jayesh Minase2
Student, Department of Mechanical Engineering, Sinhgad College of Engineering Pune, Savitribai Phule Pune
University, Pune, India.
Prof, Department of Mechanical Engineering, Sinhgad College of Engineering Pune, Savitribai Phule Pune University,
Pune, India.
ABSTRACT: Backlash is a common but intractable problem in CNC machine tools, which may degrade the contouring accuracy significantly. A lot of work has been done to investigate the backlash error. However, the previous investigations about backlash error mainly focus on traditional CNC machine tools with semi-closed loops, i.e. the position feedback of feed drive is from the encoder of servo- motor. In these traditional machine tools, backlash error is ever-present and constant, which equals half width of backlash. To improve the machining accuracy, closed loops (the so-called full- closed loops) have been widely applied instead of the semi-closed loops.The ball screw drives are among the most commonly mechanisms used to provide motion inhigh speed machine tools. The most important factor that affects high speed positioning accuracy is the closed loop bandwidth, which in turn is affected by the structural vibration modes. In recent years, newer strategies have emerged achieving higher control bandwidth, but requiring higher order plan models as well as a better understanding of the system dynamics.
KEYWORDS: Backlash; Ballscrew, Positioning error, PID controller.
I. INTRODUCTION
Backlash is one of the most commonly encountered nonlinear phenomena in feed drives, which degrades the contouring accuracy of machine tools.Its performances on positioning system or speed control depend on the motion accuracy and characteristics of mechanisms and the controllers.[1] The role of the controller is to overcome the mechanical limitations and to utilize their characteristics for high positioning performance. Mechanical elements used in precision positioning systems, such as gearand actuators often have the characteristics, which maydegrade the positioning performance, for example, frictionof brushes and/or bearings with mechanical contact in motors. Friction will cause steady-state and tracking errors,limit cycles that can slow down of the mechanisms motions. [2]
The control of systems with backlash has been the subject of study since 1940s. Linear controllers have been investigated, including P-, PI-, and PID-controllers, high-order linear controllers, state feedback controllers, and observer based controllers. The main analytical tool to describe the backlash has been the describing function technique. The preload, i.e. an approximate inverse of the backlash, has often been suggested as a backlash remedy, both in a non-adaptive and an adaptive setting. [8] Other non-linear controllers have also been proposed, including fuzzy controllers and switched linear controllers.In this thesis the PID controller is used for controlling the backlash in system model because it is very effective in controlling the error & easy to tune thus providing the desired outputs. Since many control systems using PID control have proved satisfactory, it still has a wide range of applications in industrial control. Since many process plants controlled by PID controllers have similar dynamics it has been found possible to set satisfactory controller parameters from less plant information than a complete mathematical model. [4]
II. RELATED WORK
ISSN(Online): 2320-9801
ISSN (Print): 2320-9798
I
nternational
J
ournal of
I
nnovative
R
esearch in
C
omputer
and
C
ommunication
E
ngineering
(An ISO 3297: 2007 Certified Organization)
Vol. 4, Issue 3, March 2016
level in process control [,2]. Valves with a high level of static friction (station) results in stick-slip motion that causes the control loops to oscillate. As the amount of friction increases, so does the backlash in the linkage mechanism in the positioner and actuator of the valve. The backlash adds a time delay to the control loop which deteriorates the control. In [2], it is reported that a backlash of 10% increases the peak error at load disturbances with 50% and the integrated absolute error (IAE) with 100%. These figures are dependent on the magnitude of the load disturbances, but simulation studies presented later in this paper verify them. Since control loops in process control applications often are coupled to surrounding control loops, there is also a risk that the disturbances caused by backlash in one loop will propagate to other loops. When the station or backlash becomes large, the valve should, of course, be repaired or replaced. However, this can normally not be done without interrupting the process. For this reason, and other economic reasons, it is of interest to try to keep the valve running for as long time as possible. Station can be compensated for using the method presented in [4]. Backlash is easier to compensate for, since it is an invertible nonlinearity. This will be discussed further in Section 3 in this paper. Even though the problems caused by station and backlash are severe; they are often not discovered by operators in process control plants. The main reason is that the reduction of personnel has resulted in a situation where each operator simply has too many loops to supervise. For this reason, the research on procedures for automatic performance monitoring has been very active in the last decade. The industrial use of these procedures has also increased rapidly in recent years. Good surveys of performance monitoring procedures are given in [5–8]. There are several methods suggested for detecting control loops with stiction, e.g. [9]. However, no efficient procedure to detect backlash has been presented so far, but this paper provides such a procedure. In the next section, a description and an analysis of backlash is presented. Section 3 gives some methods to compensate for backlash. The main section of this papera typical structure of a PID control system is shown in Fig 1, where it can be seen thatin a PID controller, the error signal e(t) is used to generate the proportional, integral, andderivative actions, with the resulting signals weighted and summed to form the controlsignal u(t) applied to the plant model. A mathematical description of the PID controller is
u(t)= [ e(t) + ∫ ( ) τ + ( ) ] (1)
whereu(t) is the input signal to the plant model, the error signal e(t) is defined as e(t) =r(t) − y(t), and r(t) is the reference input signal.
III. PID TUNING METHODS
A very useful empirical tuning formula was proposed by Ziegler and Nichols in early 1942. The tuning formula is obtained when the plant model is given by a first-order plus dead time (FOPDT) which can be expressed by
G(s) = (2)
In real-time process control systems, a large variety of plants can be approximately modeled by (2). If the system model cannot be physically derived, experiments can beperformed to extract the parameters for the approximate model (2). For instance, if thestep response of the plant model can be measured through an experiment, the output signalcan be recorded as sketched in Fig. 6.7(a), from which the parameters of k, L, and T (ora, where a = kL/T ) can be extracted by the simple approach shown. More sophisticatedcurve fitting approaches can also be used. With L and a, the Ziegler– Nichols formula in Table 1 can be used to get the controller parameters.
Table-1 Ziegler Nichols parameter
Controller Type
P
PI
PID
0.5
0.4 0.8 1.4
ISSN(Online): 2320-9801
ISSN (Print): 2320-9798
I
nternational
J
ournal of
I
nnovative
R
esearch in
C
omputer
and
C
ommunication
E
ngineering
(An ISO 3297: 2007 Certified Organization)
Vol. 4, Issue 3, March 2016
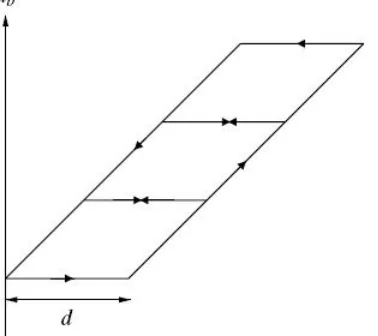
The controller C has set point and process output y as inputs, and control signal u as output. The controller output u is not the input to process P, but it goes through a backlash that gives the true process input ub. The function of the backlash, where the dead band caused by the backlash is denoted d. When the control signal u is reversed, the process input ubremainsconstant until u has passed the dead band d. The describing function YN of a backlash is
Re (a) = + 1− + 1− 2−
Im (a) = - 2− (3)
Fig. 1. Block diagram of a control loop with backlash.
The controller C has inputs setpoint and process output y. The controller output u goes through the backlash and is modified to before it enters the input of process P.
ISSN(Online): 2320-9801
ISSN (Print): 2320-9798
I
nternational
J
ournal of
I
nnovative
R
esearch in
C
omputer
and
C
ommunication
E
ngineering
(An ISO 3297: 2007 Certified Organization)
Vol. 4, Issue 3, March 2016
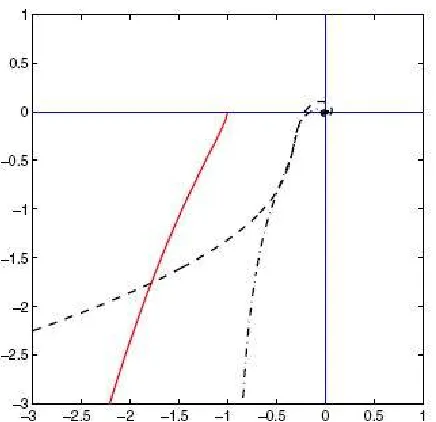
Fig. 3. The negative inverse of the describing function of a backlash (solid line) and the Nyquist plots of the loop transfer functions obtained when the processes P1 = e_0.2s/(s(1 + 0.8s)) (dashed line) and P2 = 1/(1 +
s)4(dashed-dotted line) are controlled with PID controllers
where‘a’ is the input amplitude and d is the backlash given in Fig. 2 [2]. The negative inverse of the describing function of the backlash is shown in Fig. 3. The figure shows also the Nyquist plots of two loop transfer functions obtained when an integrating and a stable process, respectively, are controlled by PID controllers. From this figure it can be concluded that backlash generates limit cycles when integrating processes are controlled by controllers with integral action. The figure also shows that backlash will normally not generate limit cycles when the process is stable, provided that the controller is well tuned. Since d is divided by a atevery position where it appears in (1), the shape of the describing function is independent of d. This has an interesting consequence. It means that the magnitude d of the backlash will influence the oscillation amplitude, but since the intersection with the Nyquistplot occurs at the same position, the oscillation period will remain the same independent of the magnitude of the backlash. Throughout this paper it is assumed that the controller C is a PID controller. This is mostly the case in practice. However, the results presented in this paper can quite easily be modified to other controllers having integral action The PID controller used in the following examples has the structure:
u(t) = K − ( ) + ∫ ( )− ( ) − ( ) (4)
IV. MODELLING OF THE SYSTEM
A transfer function of a system with backlash from the paper 1 is taken to build the system model with backlash.The backlash and noise is compensated byusing PID controller .For this the PID controller is to be tuned by using tuning method called Ziegler –Nichols method. Usingthe Ziegler Nichols parameters given in the table thr gains of PID controller are determined & then PID controller is tuned. For calculating gains of controller first of all , , these are ultimate point,integral time, derivative time is to be determined by using nyquist plot. By taking transfer function of the desired system the nyquist plot of that system is to be plotted which shows the value of and .An example of a stable process with backlash is given in the form of transfer function[2].
P(s) =( ) (5)
ISSN(Online): 2320-9801
ISSN (Print): 2320-9798
I
nternational
J
ournal of
I
nnovative
R
esearch in
C
omputer
and
C
ommunication
E
ngineering
(An ISO 3297: 2007 Certified Organization)
Vol. 4, Issue 3, March 2016
In the above transfer function external backlash of 5%i.e 0.05 is added & also noise is added and then PID controller is used to compensate the error. For the tuning the PID controller ultimate point and ultimate time is to be determined from nyquist plot.
Matlab code to plot Nyquist plot
Nyquist plot of the given transfer function
ISSN(Online): 2320-9801
ISSN (Print): 2320-9798
I
nternational
J
ournal of
I
nnovative
R
esearch in
C
omputer
and
C
ommunication
E
ngineering
(An ISO 3297: 2007 Certified Organization)
Vol. 4, Issue 3, March 2016
as =0.6 similarly and are calculated. =0.5 =3.1085 sec and =0.125 =0.777 sec. From these parameters PID gains i.e , , and are calculated =0.6 =2.469 , = / =0.794 and = * =1.918.
V. SIMULATION OF THE ABOVE TRANSFER FUNCTION.
Simulation of transfer functions of the system with backlash.
Simulation output.
ISSN(Online): 2320-9801
ISSN (Print): 2320-9798
I
nternational
J
ournal of
I
nnovative
R
esearch in
C
omputer
and
C
ommunication
E
ngineering
(An ISO 3297: 2007 Certified Organization)
Vol. 4, Issue 3, March 2016
Simulation of D.C motor and Leadscrew with backlash and noise.
Simulation output.
The output shows that the system remains stable in presence of backlash & external noise by using PID controller.
VI. CONCLUSION
ISSN(Online): 2320-9801
ISSN (Print): 2320-9798
I
nternational
J
ournal of
I
nnovative
R
esearch in
C
omputer
and
C
ommunication
E
ngineering
(An ISO 3297: 2007 Certified Organization)
Vol. 4, Issue 3, March 2016
REFERENCES
1. Shengya Shi , Jing Lin Xiufeng Wang, XiaoqiangXu (2003), “ Analysis of the transient backlash error in CNC machine tools with closed
loops” International journal of Machine Tools and Manufacture April 2-4,2015, Xi’an JiaotongUniversity,China ,pp49-60,2015
2. Tore Hägglund (2007) “Automatic on-line estimation of backlash in control loops” Department of Automatic control, Lund university, Lund,
Sweden, 17 2007,pp489-499,2007.
3. Wen-Hsiang Hsieh, Kai-Bi Chang (2014), “Modelling and Control of a Novel Ballscrew Mechanism” Journal of Marine Science &
Technology, vol-22 , 5-6- 2014,Huwei,Yunim, Taiwan,ROC, pp 754-761,2014.
4. MohdFitriMohdYakub, Abdul Qadir, B.A.Aminudin (2012) “ Comparative Study on Control Method for Two –Mass Systems” International
Journal on Advanced Science Engineering Information Technology ,June 2012,Kuala Lumpur,Malaysia,pp 261-266,2012.
5. Huanlao Lin, XiaoningXue, Guangyu Tan (2010) “ Backlash Error Measurement and Compensation on the Vertical Machining Center” Journal
of Scientific Research , 18 February 2010 ,China,pp 403-407,2010.
6. PriyarataBiswal , GirijaSankarRath, Jagadish Chandra Pati (2015) “ Fractional Calculus Based Dynamic Analysis of Stepper Motor with
Leadscrew” International Journal of Innovative Research in Electrical,Ectronics, Intrumentation& Control Engineering , Vol-3, issue-9
,September2015,Bhubaneswar, India,pp 2321-2004,2015.
7. ZurianiUsop, Ahmed A. D Sarhan, N.A.Mardi,MdNizamAbdWahab (2014) “ Measuring of Positioning Circularity and Static Error of a CNC
Vertical Machining Centre for Validating the Machining Accuracy” Journal of Elsevier, Department of Mechanical Engineering ,University of
Malaysia, 20 October 2014,Kuala Lumpur, Malaysia,pp 0263-2241,2014.
8. MattiasNordin , Per-Olof Gutman (2007) “ Controlling mechanical systems with backlash” Rolling Mills Department ,ABB process industries ,
4 march 2002,Västeras, Sweden,pp 1633-1649,2002.
9. Ryuta Sato , MasaomiTsutsumi (2012) “ Motion Control Techniques for Synchronous Motion of Translational and Rotary Axes ” 5th CIRP
Conference on High Performance Cutting , June 2012,Tokyo, Japan,pp 265-270,2012.
10. LorineMarton, Bela Lantos (2008) “Control of mechanical system with stribeck friction and backlash” Department of control engineering,
Budapest, Magyar TudösakKärutja 2, Hungary, pp 141-147,2007.