Exploring Extreme Programming in Context: An Industrial Case Study
Lucas Layman
1,
Laurie Williams
1,
Lynn
Cunningham
2 1North Carolina State University, Department of Computer Science, {lmlayma2,lawilli3}@ncsu.edu
2Clarke College, [email protected]
Abstract
A longitudinal study evaluating the effects of adopting the Extreme Programming (XP) methodology was per-formed at Sabre Airline Solutions™. The Sabre team was a characteristically agile team in that they had no need to scale or re-scope XP for their project characteristics. The case study compares two releases of the same product. One release was completed just prior to the team’s adop-tion of the XP methodology and the other after approxi-mately two years of XP use. Comparisons of the new release project results to the old release project results show an increase in design complexity, a 50% increase in productivity, a 65% improvement in pre-release quality, and a 30% improvement in post-release quality. These findings suggest that, over time, adopting the XP process can result in increased productivity and quality.
1. Introduction
The introduction of Extreme Programming (XP) [4] into mainstream software development has met with both enthusiasm and skepticism. Reports both extol the virtues and question the shortcomings of XP. Most often, these reports take the form of anecdotal success stories or les-sons-learned from organizations that have adapted XP for a project [16, 17, 26]. However, many organizations re-main skeptical regarding XP’s value. For these decision-makers, an empirical, quantitative investigation is benefi-cial for demonstrating XP’s efficacy. We increase the existing evidentiary base of empirical XP knowledge with a detailed study of an industrial team. We present this case study within the context of the XP Evaluation Framework [27, 28]. Our findings are useful for organi-zations seeking scientific investigation into the real-world impacts of utilizing XP practices.
In this single, longitudinal, holistic [31] case study, we examine a product created by an XP software develop-ment team at Sabre Airline Solutions™ in the United States. We evaluated and compared two releases of the Sabre team’s product. One release was completed just prior to the team’s initial adoption of XP; the other re-lease was completed after two years of stabilized XP use. This ten-person team develops a scriptable GUI environ-ment for external customers to develop end user software.
XP originators aimed at developing a methodology suitable for “object-oriented projects using teams of a
dozen or fewer programmers in one location.” [11] Abra-hamsson et al. [2] contend that the XP methodology is “situation appropriate” in that the methodology can be adjusted to different situations. The characteristics of the Sabre project placed it in the agile home ground [5] and allowed the use of XP in a nearly “pure” form. As dis-cussed in Section 3, several XP case studies were per-formed at Sabre. To differentiate this case study from other case studies performed at Sabre, we heretofore refer to the team in this study as Sabre-A (Agile). The Sabre-A team was among the first to use XP at Sabre Airline Solu-tions. The perceived success of this and the other early XP projects led to the use of XP with over 30 teams with more than 200 people throughout the organization.
In our case study, we examined six null hypotheses re-garding XP’s effectiveness. Because we are reporting a single case study, we cannot conclusively reject or accept these hypotheses. Our results add to the weight of evi-dence in support or in refutation of these propositions. We triangulate upon this support or refutation via objec-tive and subjecobjec-tive quantitaobjec-tive methods and via qualita-tive data collection and analysis. The null hypotheses were as follows:
When used by teams operating within the specified con-text, the use of XP practices leads to no change in:
H10: internal code structure (as measured by CK
metrics and McCabe complexity)
H20: pre-release quality (as measured by defects
found before product release)
H30: post-release quality (as measured by defects
found by the customer after release)
H40: programmer productivity (as measured by both
user stories and lines of code per person-month)
H50: customer satisfaction (measured via interview
and customer feedback)
H60: team morale (assessed via a survey)
The remainder of this paper is organized as follows. Section 2 provides background information, and Section 3 describes the context of the case study. Section 4 presents the results of the case study. Finally, Section 5 summa-rizes our findings and future work.
2. Background and related work
Evaluation Framework created by the authors and provide a brief survey of other XP research.
2.1. Case study research
Case studies can be viewed as “research in the typical” [8, 14]. As opposed to formal experiments, which often have a narrow focus and an emphasis on controlling con-text variables, case studies in software engineering test theories and collect data through observation of a project in an unmodified setting [32]. However, because the cor-porate, team, and project characteristics are unique to each case study, comparisons and generalizations of case study results are difficult and are subject to questions of internal validity [13]. Nonetheless, case studies are valu-able because they involve factors that staged experiments generally do not exhibit, such as scale, complexity, un-predictability, and dynamism [22]. Case studies are par-ticularly important for industrial evaluation of software engineering methods and tools [14]. Researchers become more confident in a theory when similar findings emerge in different contexts [14]. By recording the context vari-ables of multiple case studies and/or experiments, re-searchers can build evidence through a family of experi-ments. Replication of case studies addresses threats to experimental validity [3].
2.2. Qualitative research
Qualitative methods can be used to enrich quantitative findings with explanatory information, helping to under-stand “why” and to handle the complexities of issues in-volving human behavior. Seaman [25] discusses methods for collecting qualitative data for software engineering studies. One such method is interviewing. Interviews are used to collect historical data from the memories of inter-viewees, to collect opinions or impressions, or to explain terminology that is used in a particular setting. Interviews can be structured, unstructured, or semi-structured [25]. Semi-structured interviews, as were conducted in this case study, are a mixture of open-ended and specific ques-tions designed to elicit unexpected types of information.
2.3. Extreme Programming Evaluation Frame-work
The Extreme Programming Evaluation Framework (XP-EF) is an ontology-based benchmark for expressing case study information [27]. The XP-EF records the con-text of the case study, the extent to which an organization has adopted and/or modified XP practices, and the result of this adoption. The necessity for common ontologies emerges from the need to exchange knowledge [21]. The XP-EF, is composed of three parts: XP Context Factors (XP-cf); XP Adherence Metrics (XP-am); and XP Out-come Measures (XP-om). The metrics of the XP-EF are focused, concise, and can be collected by a small team without a dedicated metrics specialist.
In the XP-EF, researchers and practitioners record es-sential context information about their project via the XP
Context Factors (XP-cf). Recording context factors such as team size, project size, criticality, and staff experience can help explain differences in the results of applying the methodology. The second part of the XP-EF is the XP Adherence Metrics (XP-am). The XP-am uses objective and subjective metrics to express concretely and compara-tively the extent to which a team utilizes the XP practices. When researchers examine multiple XP-EF case studies, the XP-am also allow researchers to investigate the inter-actions and dependencies between the XP practices and the extent to which the practices can be separated or eliminated. Part three of the XP-EF is the XP Outcome Measures (XP-om), which enables one to assess the busi-ness-related results (productivity, quality, etc.) of using a full or partial set of XP practices.
A more detailed discussion of the XP-EF, its creation, rationale, and shortcomings may be found in [28]. In-structions and templates for measuring and reporting an XP case study data via XP-EF Version 1.2 have been documented by the authors of this paper [27, 28].
2.4. XP studies
Practitioners and researchers have reported numerous, predominantly anecdotal and favorable studies of XP. A number of these reports discuss the use of XP with small, co-located teams. Wood and Kleb [30] formed a two-person XP team and analyzed the productivity of their project as part of a pilot study at NASA to assess XP in a mission-critical environment. When the project results were normalized with past comparable projects, the XP approach was approximately twice as productive.
Abrahamsson [1] conducted a controlled case study of four software engineers using XP on a data management project at a Finnish research institute. The project lasted eight weeks with a fixed development schedule and fixed resources. Comparison between the first and second re-leases yielded the following results: planning estimation accuracy improved by 26%, productivity increased by 12 lines of code (LOC)/hour, and the defect rate remained constant at 2.1 defects/thousand lines of code. Similarly, Maurer and Martel [18] reported a case study of a nine-programmer web application project. The team showed strong productivity gains after switching from a docu-ment-centric development process to XP.
Reifer reported the results of a survey of 14 firms spanning 31 projects [23]. Most projects were character-ized as small pilot studies, for internal use only, and of low risk. It was reported that these projects had average or better than average budget performance and schedule adherence. Projects in the software and telecommunica-tions industry reported product quality on par with nomi-nal quality ratings; e-business reported above par quality ratings; and the aerospace industry reported below par quality ratings for their agile/XP projects.
IBM [29] to assess the effects of adopting XP practices. Through two software releases, this team transitioned and stabilized its use of a subset of XP practices. The use of a “safe subset” of the XP practices was necessitated by cor-porate culture, project characteristics, and team makeup. The team improved productivity and achieved a four-fold improvement in the post-release quality of new code when compared to similar metrics from the previous re-lease. These findings suggest that it is possible to adopt a partial implementation of XP practices and yield a suc-cessful project.
El Emam [7] surveyed project managers, chief execu-tive officers, developers, and vice-presidents of engineer-ing for 21 software projects. Most notably, El Emam found that none of the companies adopted agile practices in a “pure” form. Project teams chose which practices to adopt selectively and developed customized approaches to operate within their particular contexts. The Sabre-A team showed evidence of an almost pure adoption of XP, with some customizations to fit their environment.
Boehm and Turner acknowledge that agile and plan-driven methodologies each have a role in software devel-opment and suggest a risk-based method for selecting an appropriate methodology [5]. Their five project risk fac-tors (team size, criticality, personnel understanding, dy-namism, and culture) aid in selecting an agile, plan-driven, or hybrid process (see Figure 1 for an example). The Sabre-A team in this case study is an example of a team that can be classified as characteristically agile.
Robinson and Sharp [24] performed a participant-observer study based on ethnography. The researchers immersed themselves in and participated with an XP team to examine the relationship between the 12 XP practices and the four XP values: communication, feedback, sim-plicity, and courage. Robinson and Sharp concluded that the XP practices can be used to create a community that supports and sustains a culture that includes the XP val-ues. However, the specific 12 practices are not the only means for achieving the same underlying values; teams that adopt a subset of the practices can produce a similar culture.
3. Sabre Airline Solutions case study
We add to the body of knowledge about XP by report-ing a case study with a Sabre Airline Solutions develop-ment team. This study was done as a part of a coopera-tive research effort between North Carolina State Univer-sity and several development teams at Sabre Airline Solu-tions. The Sabre-A team was selected as an example of a team that was characteristically agile and did not need to scale or re-scope XP. Team selection was also influenced by data availability, team size, and the cooperativeness of the team with the researchers. The last factor proved im-portant because the research team was working within a limited time frame.
In this study, we compare the third and the ninth re-leases of the Sabre-A team’s product. From this point forth, we refer to the third release as the “old release” and the ninth release as the “new release.” The team used a traditional software process in the old release. Develop-ment for the old release began in early 2001 and lasted 18 months. Work on the new release commenced in the third quarter of 2003. In the two and half years that passed from the beginning of the old release to the beginning of the new release, the team became veterans of XP and cus-tomized their XP process to be compatible with their en-vironment.
Detailed data was collected for each release, and much of this data was gathered from historical resources. The old release was developed approximately two years prior to this study. The researchers were not present for the old release, and the team was not aware that any research would be done on their product or on their documenta-tion. Consequently, many in-process XP-EF metrics were not available. The research team was present only for a portion of the new release development. Many of the XP-EF metrics were readily available for the new release by examining source code, defect tracking systems, build results, and survey responses. Qualitative data was gath-ered from team members to aid in understanding quantita-tive findings. Six of the team’s ten full-time members were interviewed during the new release. The interviews were semi-structured, and each interviewee was asked the same set of questions. The Sabre-A case study will now be described in terms of the XP-EF and its sub-categories.
3.1. Context factors (XP-cf)
The XP-cf utilize the seven categories of context fac-tors outlined by Jones [12]: software classification, socio-logical, geographical, ergonomic, project-specific, techno-logical and an additional category, developmental factors, based upon work by Boehm and Turner [5].
Software classification. In the XP-EF, projects are
classified as one of six software types: systems [used to control physical devices]; commercial [leased or marketed to external clients]; information systems [for business information]; outsourced [developed under contract]; military; or end user [private, for personal use]. The Sa-bre-A team’s product is funded both internally and by customer contribution. No single customer dictates re-quirements, though customer suggestions are integrated into the product. Since the product is built and marketed to appeal to many customers, we classify this project as
commercial software.
Sociological factors. Team conditions for both
mem-bers in the new release worked on the old release. Also, two other members of the new release team worked on a separate, concurrently-developed version of the product during the time of the old release. In the new release, developers were under pressure to incorporate more fea-tures into the product as the release deadline approached. This impaired the rigorous testing of the product and may have contributed to lower code quality.
Table 1: Sociological factors
Context factor Old New
Team Size 6 10
Team Education Level
None: 1 Bachelors: 3 Masters: 2
None: 0 Bachelors: 8 Masters: 2 Experience Level of
Team
6-10 years: 4 <5 years: 2
6-10 years: 5 <5 years: 5 Domain Expertise Medium High Lang. Expertise Medium High Exp. of Proj. Mgr. Low Medium Specialist Available System architect
Delivery manager Personnel Turnover 67% 10% Morale Factors Layoffs,
man-ager change
High delivery pressure, ex-pected layoffs and team reas-signments
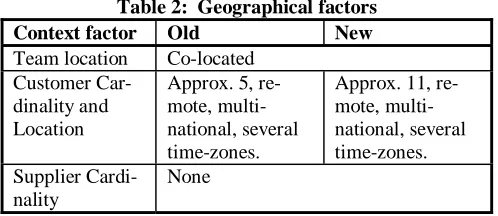
Geographical. Table 2 documents the geographical
factors. The number of customers more than doubled between the time of the old release and the time of the new release. This led to increased usage of the product as well as the generation of more requirements.
Table 2: Geographical factors
Context factor Old New
Team location Co-located Customer
Car-dinality and Location
Approx. 5, re-mote, multi-national, several time-zones.
Approx. 11, re-mote, multi-national, several time-zones. Supplier
Cardi-nality
None
Ergonomic. As shown in Table 3, in the old release
the team sat in semi-private cubicles, most of which were along the same hallway. In the new release, the team sat in an open office environment with furniture and pair programming stations arranged by the developers. A large whiteboard was available, and printouts of iteration plans and process metrics were attached to the walls. Test equipment and an automated build machine were also present in the room.
Customer interaction changed considerably between the two releases. In the old release, the product delivery
team and the lead developers were responsible for cus-tomer communication. Requirements were delivered to developers in a variety of ad hoc ways, and the developers frequently visited customer sites around the world. In the new release, a representative from Sabre’s product mar-keting department served as the XP customer. This repre-sentative made final decisions on product functionality, and was on-site approximately half of the time and was available by phone or e-mail at other times.
Table 3: Ergonomic factors
Context factor Old New
Physical Layout Semi-private cubicles
Open office XP lab
Distraction of Office Space
Low Medium
Customer Communication
Visit customer sites worldwide, e-mail, other ad hoc methods
Customer repre-sentative on-site, available through phone and e-mail
Project-specific factors. As shown in Table 4, though
the number of actual new, changed, and deleted lines in the new release is relatively small, these changes affected numerous classes and functions. The size of the new and changed classes are similar for each release, though many more functions and classes were altered in the old release. Thousands of lines of executable code (KLOEC) are non-blank, non-comment lines.
Table 4: Project-specific factors
Context factor Old New
New & Changed User Stories
N/A 32
Domain Scriptable GUI environment Person Months 108 14.7 Elapsed Months 18 3.5 Nature of Project Enhancement/maintenance Constraints Date constrained, scope
strained, semi-resource con-strained
New/Chged Classes Total Classes
276 903
180 1,337 New/Chged Method
Total Methods
1,777 8,233
710 13,301 New/Chged KLOEC 32.4 6.5 KLOEC of New &
Changed Classes
67.9 68.9
Component KLOEC 133.8 193.4 System KLOEC 133.8 221.6
Technological. The team’s technology factors are
prac-tices were not part of planned XP development but were elements of their existing process. The team used Micro-soft® Project to organize and schedule project tasks dur-ing the old release. In the new release, the planndur-ing game was used to establish release and iteration plans. User stories and task estimates were recorded in a Microsoft® Excel spreadsheet that was also used to forecast release points and iterations based on the team’s project velocity.
Defect prevention and removal practices also changed between releases. In both releases, the team had dedi-cated testers to perform system- and integration-level test-ing. However, ad hoc testing by developers and testers served as the primary means to identify potential prob-lems in the code during production of both releases. A code review policy was in place during the old release, but it was not strictly enforced. Pair programming took the place of code reviews in the new release. If a pro-grammer did not pair when developing source, it was common to ask a colleague for a peer review. Customer tests were also integrated into the new release.
Table 5: Technological factors
Context factor Old New
Software De-velopment Methodology
Waterfall with some XP prac-tices
XP
Project Man-agement
Microsoft Pro-ject
Planning game
Defect Preven-tion & Removal Practices
Code reviews, QA team, ad hoc testing
Pair program-ming, unit test-ing, QA team, ad hoc testing by developers and customer Language Java, C++ Java Reusable
Mate-rials
Third party li-braries
Third party li-braries, unit test suites, automated build machine
Developmental. The Sabre-A development team’s
Boehm-Turner risk factors for the old release are graphed on a polar chart’s five axes, shown in Figure 1. The team’s shape indicates that a hybrid “partially agile, par-tially plan-driven method” is appropriate. The develop-mental factor that appears to necessitate plan-driven prac-tices is culture. The team’s risk factors for the new re-lease are shown in Figure 2. The team’s size increased, but it still remains on the agile portion of the axis. Also, culture and dynamism moved toward the agile ends of their respective axes. The change in culture can be attrib-uted to the addition of personnel with more chaos-tolerant personality types. Also, as Sabre Airline Solutions shifted toward XP as a whole, all developers had to adapt to an environment that embraced agility and open-space pro-gramming labs instead of waterfall and private cubicles.
Figure 1: Old release developmental factors (adapted from [5])
The increase in dynamism may be attributed to several factors. The number of customer-requested changes and enhancements grew as the system evolved to include more features. Also, the number of external customers increased during this period, escalating the number of customer-driven enhancement requests. The personnel factor, which pertains to skill level, remained the same. Though some personnel turnover occurred between the releases, the skill and experience of new team members was comparable to the team members that left.
3.2. Adherence metrics (XP-am)
Most companies that use XP adopt the practices selec-tively and develop customized approaches to operate within their particular contexts [7]. The XP adherence metrics enable case study comparison, the study of XP practice interaction, and the determination of contextu-ally-based, “safe” XP practice subsets. These metrics also provide insight into whether a team has adopted XP’s core values. Unfortunately, many of the objective metrics in the XP-am could not be gathered for this case study since most of the metric information in this study is col-lected from historical data. For those metrics that could not be calculated, anecdotal evidence was solicited from the team leader, who was present in both releases. Inter-views were also conducted with team members to aid in understanding and in substantiating this evidence.
The Shodan Adherence Survey (described fully in [27] and adapted from [15]) is an in-process, subjective means of gathering XP adherence information from team mem-bers. Survey respondents report the extent to which they use each practice on a scale from 0% (never) to 100% (always). The survey was taken during development of the new release; results are not available for the old re-lease. Eleven team members took the survey, including one team member who left during the new release.
We present the combined results of these adherence metrics based upon three categories: planning (Table 6), testing (Table 7), and coding (Table 8). For each section, we present the results of the XP-am metrics followed by the Shodan survey results. We also provide substantiation based on interviews with team members.
3.2.1. Planning adherence metrics
The release length in the old release was appropriate for the waterfall process and a less volatile requirement set. During the time of the new release, the team operated almost exclusively on iteration plans, and their product was continuously available via an automated build ma-chine. Product versions were primarily dictated by the marketing department. Versioning served a means for the business unit to track production rather than as a devel-opment milestone. For the new release, stand-up meet-ings were conducted every morning in the lab. The mar-keting representative serving as the XP customer was on-site approximately half the time and was available through phone and e-mail the rest of the time.
According to team members, the daily stand-up meet-ings were a valuable asset for problem resolution and team communication. Team members also stated that the short iterations were helpful and allowed them to create more accurate estimates. Also, by estimating planning only a few weeks at a time, there was less anxiety about completing future tasks. When using the waterfall method, the developers were often under pressure to meet inaccurate task schedules that were created several months earlier in the development cycle.
Table 6: XP adherence metrics – Planning
Planning metric Old New
Release Length 18 months 3.5 months Iteration Length None 10 days Requirements added
or removed to Total Shipped Ratio
N/A N/A
Subjective metrics (Shodan)
Mean (std dev)
Mean (std dev)
Stand up meetings N/A 92.7% (10.1) Short Releases N/A 91.8% (11.7) Customer Access /
On-site Customer
N/A 89.1% (12.2)
Planning Game N/A 84.5% (10.4)
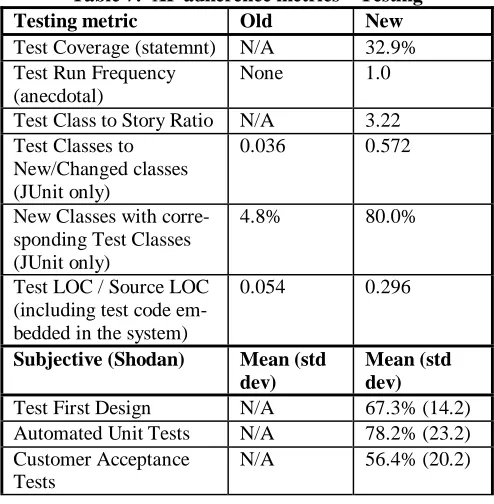
3.2.2. Testing adherence metrics
The team’s new release test coverage reflects a con-certed effort to adopt automated unit testing. Test cover-age is avercover-aged over the entire component, not just the new and changed portions. The team wrote automated unit tests before adding or changing functionality and before refactoring code. The ratio of Test Classes to New and Changed classes indicates that more than half of the new and changed classes have a corresponding test class. Nearly all of the new classes written have a corresponding test class. Static legacy code was not always unit tested.
Table 7: XP adherence metrics – Testing
Testing metric Old New
Test Coverage (statemnt) N/A 32.9% Test Run Frequency
(anecdotal)
None 1.0
Test Class to Story Ratio N/A 3.22 Test Classes to
New/Changed classes (JUnit only)
0.036 0.572
New Classes with corre-sponding Test Classes (JUnit only)
4.8% 80.0%
Test LOC / Source LOC (including test code em-bedded in the system)
0.054 0.296
Subjective (Shodan) Mean (std
dev)
Mean (std dev)
Test First Design N/A 67.3% (14.2) Automated Unit Tests N/A 78.2% (23.2) Customer Acceptance
Tests
N/A 56.4% (20.2)
with that of Mugridge [20], who likens test-driven devel-opment to the repeatable experiments of the scientific method. Some developers stated that there was an ade-quate amount of customer acceptance tests, however, these tests were not automated. The XP customer some-times had difficulty creating acceptance tests due to time constraints and system scope.
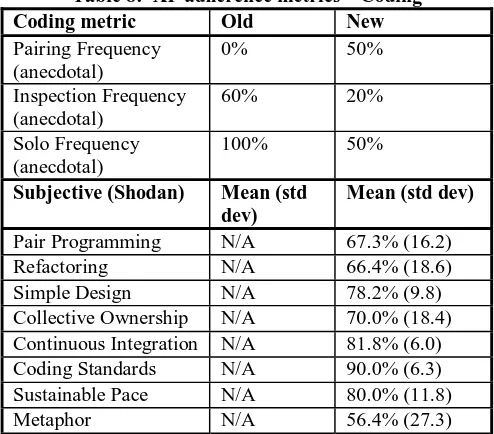
3.2.3. Coding adherence metrics
In the old release, pairing did not occur. However, a code review policy was in place. According to the team leader, in the new release, the team paired approximately half the time. In interviews, some developers noted their dislikes for pairing because of differences in age and ex-pertise. Almost all interviewees disliked mandated pair-ing and saw no value in pairpair-ing on trivial tasks. However, everyone agreed that it was a valuable process for solving problems and overcoming technical difficulties. One de-veloper noted that the time required to switch pairs is of-ten underestimated, particularly when this occurs several times per day. Developers agreed that collective owner-ship is valuable, and stated that the group shares code often. However, some people still regard their code as proprietary, particularly highly-specialized or fragile pieces of code. The metaphor score was low since no analogy could be created for the system. However, the team used a well-defined system of names in the product.
Table 8: XP adherence metrics – Coding
Coding metric Old New
Pairing Frequency (anecdotal)
0% 50%
Inspection Frequency (anecdotal)
60% 20%
Solo Frequency (anecdotal)
100% 50%
Subjective (Shodan) Mean (std
dev)
Mean (std dev)
Pair Programming N/A 67.3% (16.2)
Refactoring N/A 66.4% (18.6) Simple Design N/A 78.2% (9.8)
Collective Ownership N/A 70.0% (18.4) Continuous Integration N/A 81.8% (6.0) Coding Standards N/A 90.0% (6.3) Sustainable Pace N/A 80.0% (11.8)
Metaphor N/A 56.4% (27.3)
3.3. Case study limitations
The Sabre-A team in this case study is characteristi-cally agile and had organizational and managerial support to use the XP methodology. Therefore, their successful implementation may not be representative of teams that are not characteristically agile (e.g. large, distributed teams) and/or do not have management and organiza-tional support. This case study does not provide any
in-sight into extending the range of applicability of XP be-yond small, co-located teams.
The comparison is made between two releases of the same product. We sought to reduce internal validity con-cerns by studying the same software project with a team comprised largely of the same personnel. The amount of new and changed code in the new release was approxi-mately one-fifth the size of the old release, and smaller projects are often considered to be less complex. How-ever, the system size increased 65% between the old and new releases, and overall system cyclomatic complexity increased by 20%. Also, team members expressed that feature complexity was much higher in the new release when compared to the old release. Furthermore, the amount of test code written in the new release was not included in effort calculations or total system size. There-fore, productivity and effort results in the new release may be underestimated.
4. Results (XP-om)
Of utmost importance to decision makers is whether or not adopting XP aids in productively creating a higher quality project. We provide quantitative output meas-urements of productivity and quality, as well as qualita-tive information gathered from team member interviews. We performed member checking with team members to review our findings and receive any final feedback on their XP experience.
Defect information was collected from the team’s de-fect tracking system. We now explain the method was used to identify and classify defects for both the old and the new releases. Internal (pre-release) defects were iden-tified by examining the “originating customer” field of each defect header. According to the team’s quality tracking lead, a defect was found internally if the originat-ing customer field did not refer to an external customer. If the originating customer field indicated an external cus-tomer, the defect was considered to be a post-release de-fect. Furthermore, any Severity 3 defects were classified as internal defects since the team’s severity schema states that all Severity 3 defects were found during development regardless of their impact on the system. Also, all defects are reviewed by a quality assurance (QA) panel to deter-mine if they are, indeed, software defects. Any defect entry that had not been classified by the QA panel as a defect was not counted. Any defects that addressed the same problem (duplicate entries) were counted once.
many times one developer would overhear a problem someone else was having and was able to suggest a solu-tion or the two would collaborate on the problem. Devel-opers also enjoyed the rapid feedback afforded by unit testing and pair programming during the coding and de-sign phases. When naming their dislikes, most develop-ers cited mandatory pair programming as one drawback to their process. While they considered pair programming to be valuable for problem solving and implementing diffi-cult functionality, it was often considered an inefficient use of time to pair on menial tasks. The interviewees also noted that, while the open lab increased communication, it could sometimes become a distraction.
The Sabre business-related results, structured via the XP-Outcome Measures (XP-om), are shown in Table 9. A relative scale is used to protect proprietary information.
Table 9: XP outcome measures (relative scale with the old release at 1.0)
XP Outcome Measures Old New
Internal Code Structure (mean values) Methods per class System average
1.0 1.0
1.5 1.2 Depth of inheritance tree
System average
1.0 1.0
1.0 1.0 Number of children
System average
1.0 1.0
1.0 1.0 Coupling
System average
1.0 1.0
1.17 1.2 Response for class
System average
1.0 1.0
1.28 1.27 Lines of code per class
System average
1.0 1.0
1.15 1.13 McCabe Complexity
System average
1.0 1.0
1.35 1.20 Internally-Visible Quality
(test defects/KLOEC of code)
1.0 0.35
Externally-Visible Quality (released defects/KLOEC of code four months after release)
1.0 0.70
Productivity (stories/person-month) Relative KLOEC person-month
N/A 1.0
- 1.46 Customer Satisfaction (approx) N/A High Response to Customer Change
(Ratio (user stories in + out)/total)
N/A N/A
Morale (via survey) N/A 68.1%
Internal Code Structure. Since “big design up front”
is not emphasized in XP, software developers can be con-cerned with the resulting design of the implemented code. Table 8 displays the differences of the CK design metrics [6] and McCabe cyclomatic complexity [19] between releases. This comparison is difficult given the amount of change between the two releases under study. The
transi-tion period between the old release and the new release included the addition of considerable added functionality and the creation of a new component. Also, the size of the system increased, potentially increasing the complex-ity of the code. The old release and new release compo-nents under study differ in their functionality. Only 34 of the same classes were changed in both the old release and the new release. We present the code structure metrics for each release alongside the metrics results for the over-all system in their respective releases.
These measures for the new release were on par for the new release system as a whole. However, the code struc-ture measures were higher in every category for the new release when compared to the old release. These findings support the alternative hypothesis H11: When used by
teams operating within this specified context, the use of a specified subset of XP practices leads to a decline in code structure.
Internally-Visible Quality. Internal (pre-release)
de-fect density, which concerns dede-fects identified by Sabre testers, improved by 65%. These findings support the alternative hypothesis H21: when used by teams operating
within this specified context, the use of a specified subset of XP practices leads to an improvement in pre-release quality. Testing was done by the dedicated testers
associ-ated with the Sabre-A team and the developers perform-ing ad-hoc functional testperform-ing and unit testperform-ing throughout development. We temper these results by noting that these measurements may be skewed because the old re-lease was subject to 18 months of continuous internal testing, while the new release was internally tested for only 3.5 months.
Externally-Visible Quality. We observed that the
number of defects found in the customer’s production system has improved by 30%. These findings support the alternative hypothesis H31: when used by teams operating
within this specified context, the use of a specified subset of XP practices leads to an improvement in post-release quality. The defect numbers presented reflect a collection
period of four months after each release.
Post-release defect counts were impacted by several important factors. One major influencing factor was the doubling of the number of external customers between the old and the new releases. The old release was not used extensively since most customers were awaiting the com-pletion of a new version of the product in progress at that time. However, the new release was used significantly by more customers, some of which had a more complex problem domain than those customers of the old release. Evidence of similar customer use of the product the old and new releases and an assessment of feature complexity would aid in determining the accuracy of the post-release defect comparison for this project.
release. A Severity 1 defect is classified as a defect that causes the customer’s system to be unusable, whereas a Severity 2 defect is a defect where the customer’s system is working badly and their operations and/or revenue is negatively impacted, but a work-around exists for the defect. The post-release defect severity distribution for both releases is shown in Table 10.
Table 10: Post-release defect severity distribution
Severity Old New
1 12% 0%
2 88% 100%
Productivity. The results suggest that team had
in-creased their productivity (in terms of KLOEC/PM) by approximately 50% between the old release and the new release. These findings support the alternative hypothesis H41: when used by teams operating within this specified
context, the use of a specified subset of XP practices leads to an improvement in developer productivity. A decrease
in the relative complexity of implemented features can potentially affect this metric. Recording the amount of developer effort spent on non-production activities, such as installation, training, and customer support activities, would also help account for variations in these results. Unfortunately, the user story per person month metric was unavailable since the team did not utilize user stories dur-ing the old release. This metric would help in gaugdur-ing the amount of actual functionality produced by the develop-ers, rather than the amount of code they produce.
Customer satisfaction. Proponents of XP profess that
customers are more satisfied with the resulting project because the team produced what the customer actually wanted, rather than what they had originally expressed they wanted. In the future, we plan to author and validate a customer satisfaction survey instrument. Unfortunately, we could not contact the external customers for this pro-ject. Also, the response to customer change metric could not be calculated for either release since the addition and removal of user stories was not well-documented. There-fore, we can draw no inferences regarding the null hy-pothesis H50 regarding customer satisfaction.
Anecdo-tally, however, the customers were very satisfied with the new release product. One customer expressed that it was one of the most professionally-developed products he had ever used. Feedback from other customers was unavail-able.
Morale. Morale was assessed via an additional
ques-tion on the Shodan Adherence Survey. The quesques-tion read, “How often can you say you are enjoying your work?” In interviews, several team members stated that they enjoyed their jobs and enjoyed the XP methodology more than the waterfall method. However, we cannot verify that the team members who made these comments worked on the old release. Survey results indicated that team members felt they were working at a sustainable pace. However,
since there is no assured basis for comparison in the old release, we can draw no inferences about the null hy-pothesis H60 regarding morale.
5. Summary and Future Work
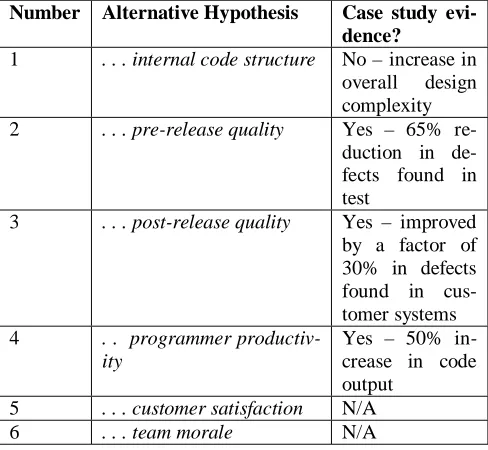
As is often the case with software engineering innova-tion, empirical research on the efficacy of XP is lagging behind adoption of the methodology and its practices. Both commercial decision-makers and researchers are awaiting empirical evidence of the efficacy of XP. We contribute such evidence by performing an industrial case study with a Sabre Airline Solutions development team. This case study compares that compared two releases of the Sabre team’s product: one completed prior to adoption of XP and the other completed after two years of XP ex-perience. We examined six hypothesis related to the re-sults of their adoption of XP practices in their context. We summarize our case study findings in the format sug-gested by Fenton [9] in Table 11. We remind the reader that these results are based on one case study in one par-ticular context. Our results can be used to build upon the weight of evidence about XP, but we cannot conclusively accept or reject the hypotheses. Our findings suggest that the adoption of XP practices can improve programmer productivity and can improve product quality, but can also increase code complexity. All findings should be taken in the context of a product that grew and evolved significantly in the time period between the two releases under study.
Table 11: Case study summary
When used by teams operating within the specified con-text, the use of a specified subset of XP practices leads to an improvement in . . .
Number Alternative Hypothesis Case study
evi-dence?
1 . . . internal code structure No – increase in overall design complexity 2 . . . pre-release quality Yes – 65%
re-duction in de-fects found in test
3 . . . post-release quality Yes – improved by a factor of 30% in defects found in cus-tomer systems 4 . . programmer
productiv-ity
Yes – 50% in-crease in code output
5 . . . customer satisfaction N/A 6 . . . team morale N/A
The results of this family of case studies and that of other researchers will build an empirical body of results con-cerning XP in various contexts in various organizations. Specifically, we intend to examine trends in the variety of subsets of XP practices that emerge.
Acknowledgements
The authors wish to thank the individuals on the Sabre development team for participating in this case study, and Kerry Rodgers and Scott Frederick for their invaluable assistance. We also wish to thank the students in the North Carolina State University Software Engineering Reading Group for their helpful suggestions on this paper. This research was supported by Sabre Airline Solutions. Lynn Cunningham was able to participate in this research through support from the National Science Foundation Distributed Mentor Project.
References
[1] Pekka Abrahamsson, Extreme Programming: First Results from a Controlled Case Study, in 29th EUROMICRO Conference. 2003, IEEE: Belek, Turkey.
[2] Pekka Abrahamsson, Juhani Warsta, Mikko T. Sipo-nen, and Jussi RonkaiSipo-nen, New Directions in Agile Methods: A Comparative Analysis, in International Conference on Software Engineering (ICSE 203). 2003, IEEE Computer Society: Port-land, OR. p. 244-254.
[3] V. Basili, F. Shull, and F. Lanubile, "Building Knowl-edge Through Families of Experiments," IEEE Transactions on Software Engineering, vol. 25, 4: 4, pp. 456 - 473.
[4] Kent Beck, Extreme Programming Explained: Em-brace Change. 2000, Addison-Wesley: Reading, Massachusetts. [5] B. Boehm and R. Turner, Balancing Agility and Dis-cipline: A Guide for the Perplexed. 2003, Addison Wesley: Boston, MA.
[6] S. R. Chidamber and C. F. Kemerer, "A Metrics Suite for Object Oriented Design," IEEE Transactions on Software Engineering, vol. 20, 6: 6, pp. 476-493.
[7] K. El-Emam, "Finding Success in Small Software Projects," Agile Project Management, vol. 4, 11: 11, pp. 2003s. [8] N. E. Fenton and S.L. Pfleeger, Software Metrics: A Rigorous and Practical Approach. 1998, Brooks/Cole Pub Co. [9] Norman Fenton, Viewpoint Article: Conducting and Presenting Empirical Software Engineering, in Empirical Soft-ware Engineering. September 2001. p. 195-200.
[10] Bangalore Benchmarking Special Interest Group, Benchmarking of Software Engineering Practices at High Ma-turity Organizations. 2001, Bangalore Software Process Im-provement Network.
[11] Ron Jeffries, Ann Anderson, and Chet Hendrickson, Extreme Programming Installed, in The XP Series, K. Beck, Editor. 2001, Addison Wesley: Upper Saddle River, NJ. [12] C. Jones, Software Assessments, Benchmarks, and Best Practices,Boston, MA: Addison Wesley, 2000.
[13] Barbara A. Kitchenham, et al., Preliminary Guidelines for Empirical Research in Software Engineering, in IEEE Transactions on Software Engineering. 2002. p. 721-733. [14] Barbara Kitchenham, Lesley Pickard, and Shari Law-rence Pfleeger, Case Studies for Method and Tool Evaluation, in IEEE Software. July 1995. p. 52-62.
[15] W. Krebs, Turning the Knobs: A Coaching Pattern for XP Through Agile Metrics, in Extreme Programming/Agile Universe, L. Williams, Editor. 2002, Springer: Chicago, IL. [16] Michele Marchesi and Giancarlo Succi, Extreme Pro-gramming Examined, in XP Series, K. Beck, Editor. 2001, Addi-son Wesley: Boston.
[17] Michele Marchesi, Giancarlo Succi, Don Wells, and Laurie Williams, Extreme Programming Perspectives, in XP Series, K. Beck, Editor. 2002, Addison Wesley: Boston. [18] Frank Maurer and Sebastien Martel, Extreme Pro-gramming: Rapid Development for Web-Based Applications, in IEEE Internet Computing. Jan/Feb 2002. p. 86-91.
[19] T. J. McCabe, "A Complexity Measure," IEEE Trans-actions on Software Engineering, vol. SE-2, pp. 308-320, 1976. [20] Rick Mugridge, Test Driven Development and the Scientific Method, in Agile Development Conference. 2003, IEEE Press: Salt Lake City, Utah. p. 47-52.
[21] Philip Nour, Ontology-based Retrieval of Software Engineering Experiences, in Computer Science. August 2003, University of Calgary: Calgary, Alberta, Canada.
[22] C. Potts, Software Engineering Research Revisited, in IEEE Software. September 1993. p. 19-28.
[23] D. J. Reifer, How to Get the Most out of Extreme Pro-gramming/Agile Methods, in 2nd XP and 1st Agile Universe Conference. August 2002, Springer LNCS 2418: Chicago, IL. p. 185-196.
[24] H. Robinson and H. Sharp, "XP Culture: Why the twelve practices both are and are not the most significant thing," 1st International Agile Development Conference (ADC '03), Salt Lake City, UT, June 25 - 28, 2003, pp. 12-21.
[25] Carolyn B. Seaman, Qualitative Methods in Empirical Studies of Software Engineering, in IEEE Transactions on Soft-ware Engineering. 1999. p. 557-572.
[26] Don Wells and Laurie Williams, Extreme Program-ming and Agile Methods -- XP/Agile Universe 2002, in Lecture Notes in Computer Science. 2002, Springer-Verlag: Berlin. [27] L. Williams, W. Krebs, and L. Layman, "Extreme Programming Evaluation Framework for Object-Oriented Lan-guages -- Version 1.2," North Carolina State University De-partment of Computer Science TR-2004-1, 2004.
[28] L. Williams, W. Krebs, L. Layman, and A. Antón, "Toward a Framework for Evaluating Extreme Programming," Proceedings of the Eighth International Conference on Empiri-cal Assessment in Software Engineering (EASE 04), May 2004, pp. To Appear.
[29] Laurie Williams, Lucas Layman, William Krebs, and Annie Antón, Exploring the Use of a "Safe Subset" of Extreme Programming: An Industrial Case Study. 2004, North Carolina State University.
[30] W. and W. Kleb Wood, "Exploring XP for Scientific Research," IEEE Software, vol. 20, 3: 3, pp. 30-36, 2003. [31] Robert K. Yin, Case Study Research: Design and Methods, in Applied Social Research, D.J. Rog, Editor. 2003, Sage Publications: Thousand Oaks, CA.
![Figure 1: Old release developmental factors (adapted from [5])](https://thumb-us.123doks.com/thumbv2/123dok_us/1446087.1177186/5.612.317.555.71.298/figure-old-release-developmental-factors-adapted.webp)