Licensed under Creative Common Page 194
http://ijecm.co.uk/
ISSN 2348 0386
CAPITAL FLOWS AND COMMODITY PRICE EFFECTS ON
OUTPUT GROWTH IN SUB SAHARA AFRICA: A CASE OF
DOMINANT COMMODITY EXPORTING COUNTRIES
Mustapha, Saidi Atanda
Department of Economics, Accounting and Finance,
Bells University of Technology, Ota, Nigeria
Abstract
Using a large panel of 18 sub-Sahara African countries over the last 45 years, the paper shows
that capital flows measured by foreign direct investment and commodity prices influenced output
growth. This is conducted through the traditional panel data approaches – pooled, fixed and
random panel data models. The paper uses the Redundant Fixed Effects Likelihood Ratio and
Hausman tests to select the most reliable panel data model among the three traditional
approaches. The paper found that physical investments (proxy by GCF), capital flows (proxy by
Foreign Direct investment, FDI), Exchange Rate, Population growth rate and Commodity Prices
have significant effects on output growth of major commodity exporters in Sub-Sahara
countries. Even, after controlling for inclusion of explanatory parameters, the results show that
positive change in physical investments and exchange rates reduce output growth in these
countries by significant percentiles. In addition, the negative effect of exchange rate shows the
high dependence of the region on foreign goods and services, specifically, in the process of
acquiring capital equipment and security tools. Based on the findings, the paper recommends
that increase expenditures on general and physical investments to promote capital flows and
output growth in these countries are highly essential.
Licensed under Creative Common Page 195
INTRODUCTION
In international finance, capital mobility across national borders has earned a wider audience in
terms of significance and importance. Early debate on capital flows had established that it is an
avenue for investors to integrate in terms of trade and investment and to earn increase or
diversified returns (Mustapha, 2013; McKinnon and Liu, 2013; and Mustapha, 2017). It allows
capital to seek out the highest rate of return; either from financial market or the goods market.
Evidence from the theoretical lens had shown that capital flows can affect goods market through
Foreign Direct Investment (FDI) and therefore, based on this argument this research has
strongly supported the claim (Reinhart, Reinhart and Trebesch, 2016; Colombo, Loncan and
Caldeira, 2017).
There are several insights that have arose on the merits of unrestricted capital flows,
some of these merits include: reduction in risk associated to investment through the
diversification of lending and investment activities; enhance global integration of capital markets
and increase the adoption of best practices in corporate governance and legal practices; limits
the ability of governments to pursue bad policies (Dhar, 2017). With these merits, a country can also not wholly depend on free flow of capital as it’s attending consequences outweighs these
identified merits. Meanwhile, the ability of a country to understand the effect of capital flows and
its position in economic growth is paramount.
Most African countries depend solely on their mono-cultural trade practices. These
African countries opined that a major source of their capital inflow depends on the ability to
facilitate and gain more from commodities they export. For instance, Nigeria earned above 50%
of its capital inflow from oil exports. Burundi, Zimbabwe, Mauritania and South Africa earned
more of their capital flows from Beverage, Cotton, Tobacco and Metals (see Table 1). This
indicates that, the level of capital inflow depends on commodity prices and both have direct
effects on output growth in African countries.
Studies on capital flows in Africa have failed to consider the trade peculiarity in their
estimations and that could have downsized the relative impact of capital flows on the economic
variables of consideration (Mustapha, 2017). Similarly, most studies have downplayed the
contribution of commodity exports and their prices in attracting capital flows. Therefore, studies
on capital flows in Africa that recognize the importance of commodity prices to stimulating
capital flows are absolutely limited. This research intends to fill this vacuum.
There are three major types of international capital flows: foreign direct investment (FDI),
foreign portfolio investment (FPI), and debt. Capital flows that have equity-like features (that is,
FDI and FPI) are presumed to be more stable and less prone to reversals. FDI yields more
Licensed under Creative Common Page 196 management. In national and international accounting standards, FDI is defined as involving an
equity stake of 10% or more. FPI is different from FDI in that it lacks the element of lasting
interest and control. The third type of foreign investment - debt flows, consisting of bank loans
and bonds, are regarded as more volatile. Capital inflows have played an important role in
financing investment and external deficits in many African countries. In addition, higher
commodity prices have helped improve external balances and growth outcomes in
commodity-exporting countries (Mustapha, 2017; and Dhar, 2017). However, large capital flows and volatile
commodity prices have resulted in greater macroeconomic volatility, real exchange rate
appreciation, reduced external competitiveness and the build-up of balance sheet vulnerabilities
in these countries (see McKinnon and Liu, 2013; Gourio, Siemer and Verdelhan, 2016; Dhar,
2017; and Mustapha, 2017).
Based on the foregoing, the paper contributes to existing researches in two ways: first, it
identifies the major exporting commodities that attracts capital inflow to African markets and
classify African countries by the exporting capabilities. This approach is to allow the estimation
to accommodate the peculiarities of African countries that come to bear as a result of
commodity exports. Second, the paper provides the relative effectiveness of capital flows and
commodity prices through an output-commodity driven growth. The output-commodity driven
growth is a novel measure of output growth that considers the peculiarity of each African
country in terms major commodity exports. The paper is organized as follows. Section 1
presents the introduction. Section 2 shows the stylized facts, while section 3 presents the
methodology and data. Section 4 provides the estimations, interpretation and discussion.
Section 5 concludes on the paper.
STYLIZED FACTS
The relative share of capital flows proxy by foreign direct investment and average capital flow by
commodities are presented to provide insights as to how important is this inflow to total inflow
and to adjudicate that commodity export is preferred to other country peculiarities in terms of
discussing capital flows in Africa. Table 1 shows the classification of countries by major export;
eighteen countries are examined, where the major export of six (6) countries is metal, while five
countries engage in exportation of beverages (i.e. Coffee, Cocoa). Four countries including
Nigeria are exporting oil and the two other countries engage fully in exportation of cotton. This
classification is based on tradable goods in international market; although some are booming
while the reverse is the case for some other commodities. Consideration of share of FDI is to
determine the strength of each country in attracting capital inflow. It is evident that Nigeria has
Licensed under Creative Common Page 197 24%. Meanwhile, Burundi and Zimbabwe has 8% share of FDI in the region; when 5% was the
share of South Africa.
Table 1: Relative Share of Foreign Direct Investment during (1971-2016)
COUNTRY EXPORT GOODS % Share of FDI
in Total Inflow
BURUNDI (BUR) BEVERAGE 0.08
COTEVOIRE (COT) BEVERAGE 0.03
ETHIOPIA (ETH) BEVERAGE 0.00
GHANA (GHA) BEVERAGE 0.01
KENYA (KEN) BEVERAGE 0.02
UGANDA (UGA) BEVERAGE 0.03
ZIMBABWE (ZIM) CT (COTTON, Tobbaco) 0.08
MALAWI (MAL) CT(cotton, tobacco) 0.01
ALGERIA (ALG) ENERGY 0.02
ANGOLA (ANG) ENERGY 0.04
LIBYA (LIB) ENERGY 0.01
NIGERIA (NIG) ENERGY 0.02
CONG DEM REP (CONG) METAL 0.29
GUINEA (GUI) METAL 0.01
MAURITANIA (MAU) METAL 0.24
SEIRRA LEONE (SEI) METAL 0.03
SOUTH AFRICA (SA) METAL 0.05
ZAMBIA (ZAM) METAL 0.01
Source: Author’s Computation and Compilation (2018)
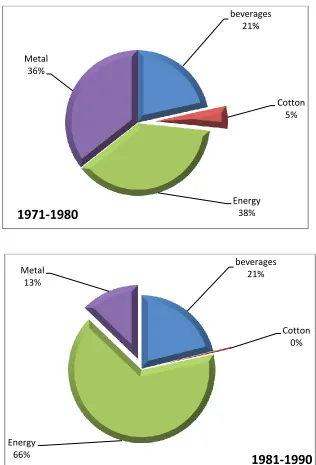
Figure 1 shows the average foreign direct investment that is invested in the selected countries
that major in exportation of beverages, cotton, energy and metal. It is evident that the
investment in countries that are exporter of crude oil is relatively high among sampled countries
over different decades; while countries that produces and exported cotton are relatively low
capital inflow. Countries whose export is metal are the second categories of countries with
moderate capital inflow in the form of FDI.
However, during 1980-70 period about 38% of FDI in the region is directed towards oil
producing countries; while 36%, 21% were invested in Metal and Beverages producing
countries. Meanwhile, countries that produced cotton received 5% of the total capital inflow into
Licensed under Creative Common Page 198 supplying countries rose significant to 66% and thus represent the peak period during the period
under review; while investment in beverage producing countries remain the same at 21%, that
of metal producing countries falls significantly from 36% in previous decade to 13%. Moreover,
after 1981-90 periods, FDI to oil producing countries has been declining; while investment has
tilted towards countries with major export in metal and beverages.
Figure 1: Average Foreign Direct Investment by Commodities 1970-2016
beverages 21%
Cotton 5%
Energy 38% Metal
36%
1971-1980
beverages 21%
Cotton 0%
Energy 66%
Metal 13%
Licensed under Creative Common Page 199
beverages 28%
Cotton 4%
Energy 33% Metal
35%
2011-2016
beverages
14% Cotton
3%
Energy 55% Metal
28%
1991-2000
beverages 12%
Cotton 1%
Energy 51% Metal
36%
Licensed under Creative Common Page 200
RESEARCH METHODOLOGY
The data set for the paper include data for 18 sub-Sahara African countries. It garnered data for
forty-five years from 1970 to 2015. The main justification for the sample period is the availability
of most data series used in the estimation. The data sets are briefly defined as follows: The
growth of output which measures the annual growth rate of national output for each of the
countries sampled. Capital flows was measured with the change in foreign direct investment,
while commodity prices relates to the average basket of prices of similar commodities across
selected countries. The paper considered some control variables in line with (Mustapha, 2013;
and Gourio, Siemer and Verdelhan, 2016), the control variables are changes in general price
level (inflation), investment positions proxy by changes in gross capital formation and exchange
rate. The inflation was considered because it determines the real interest rate, which is a source
of attraction for foreign investors and thus attracts capital inflows. The investment position in the
system ensures that the sub-Sahara African countries selected have adequate investment
levels that could drive growth and enhance capital flows. The exchange rate, nonetheless,
represents the competitiveness of these countries with the rest of the world. Therefore, the exchange rate is an indicator of countries viability. The data sets were sourced from countries’
central banks.
The paper estimated the effects of capital flows and commodity prices on output growth.
In this case, the paper runs annual panel regressions of capital flows, commodity prices and
output growth. The panel approach used for all the estimations conducted is mainly the
traditional panel method. The model is specified as follows:
Model Specification
lnGDPit= α0+α1lnFDIit+α2lnComPricet+α3Infit+α4lnGCFit+α5Exrit+εit
lnGDP = log of Gross Domestic Product
lnFDI = log of Foreign Direct investment
ComPrice = log of Commodity price
lnGCF = log of Gross Capital Formation
Exr = Exchange rate
ε = Error Term
EMPIRICAL RESULTS AND DISCUSSION
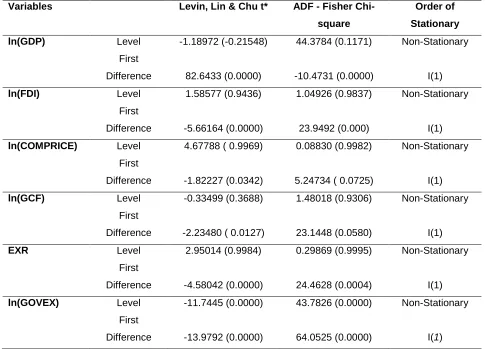
This section commences with the descriptive analysis. This consists of the panel unit root tests,
panel co-integration tests, and traditional panel models. The traditional panels present the
estimated models to show the effects of capital flows and commodity prices on output growth in
Licensed under Creative Common Page 201 growth with consideration given to the commodity export of these countries. In Table 2, the
panel unit root test shows that the null hypothesis establishes the existence of unit root; while
the alternate indicate non-existence of unit root. Hence, insignificant p-value indicate
acceptance of Ho; while significant (i.e. p<0.05) indicate rejection of null hypothesis.
The results of the unit root test indicate that all variables are non-stationary at level.
However, when difference in the first-order, it shows that the variables are stationary. It is
striking to note that, the related goodness of fit for the model is strong and at about 86.3% of the
variation observed in GDP growth. The overall result is significant (F-Stat=21.41, p<.05) and
free from autocorrelation.
Table 2: Result of Unit Root Test
Variables Levin, Lin & Chu t* ADF - Fisher
Chi-square
Order of
Stationary
ln(GDP) Level
First Difference -1.18972 (-0.21548) 82.6433 (0.0000) 44.3784 (0.1171) -10.4731 (0.0000) Non-Stationary I(1)
ln(FDI) Level
First Difference 1.58577 (0.9436) -5.66164 (0.0000) 1.04926 (0.9837) 23.9492 (0.000) Non-Stationary I(1)
ln(COMPRICE) Level
First Difference
4.67788 ( 0.9969)
-1.82227 (0.0342)
0.08830 (0.9982)
5.24734 ( 0.0725)
Non-Stationary
I(1)
ln(GCF) Level
First Difference
-0.33499 (0.3688)
-2.23480 ( 0.0127)
1.48018 (0.9306)
23.1448 (0.0580)
Non-Stationary
I(1)
EXR Level
First Difference 2.95014 (0.9984) -4.58042 (0.0000) 0.29869 (0.9995) 24.4628 (0.0004) Non-Stationary I(1)
ln(GOVEX) Level
First Difference -11.7445 (0.0000) -13.9792 (0.0000) 43.7826 (0.0000) 64.0525 (0.0000) Non-Stationary
I(1)
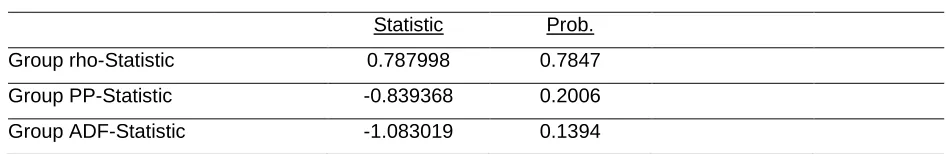
Panel Co-Integration Test
The essence of co-integration test is to ascertain if a long-run equilibrium relationship exist
among variables of the model. The null hypothesis indicates a no co-integration among the
Licensed under Creative Common Page 202 requires that the p-value be less than 5% for long-run relationship to assist (i.e. rejecting the null
hypothesis); but anything greater than 5% indicates acceptance of null-hypothesis (i.e. no
co-integration). In Table 3, the result shows that there is no long-run relationship among the
variables as the test statistics for each of the test procedures are not significant.
Table 3: Pedroni Residual Cointegration Test
Series: GDP GFCR FDI EXR INF POP COMPRICE
Alternative hypothesis: common AR coefs. (within-dimension)
Weighted
Statistic Prob. Statistic Prob.
Panel v-Statistic 0.991191 0.1608 0.991191 0.1608
Panel rho-Statistic 0.397340 0.6544 0.397340 0.6544
Panel PP-Statistic -0.938711 0.1739 -0.938711 0.1739
Panel ADF-Statistic -1.145839 0.1259 -1.145839 0.1259
Alternative hypothesis: individual AR coefs. (between-dimension)
Statistic Prob.
Group rho-Statistic 0.787998 0.7847
Group PP-Statistic -0.839368 0.2006
Group ADF-Statistic -1.083019 0.1394
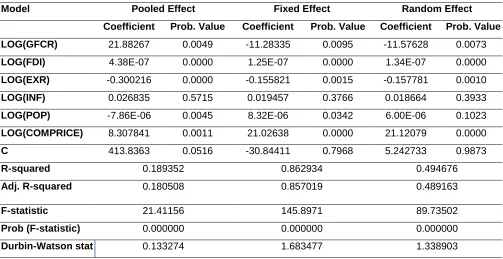
Capital Flows and Commodity Price Effects on Output Growth
In order to ascertain the effects of capital flows and commodity price on output growth, the
paper formed and estimated a traditional panel – pooled, fixed and random effect models. As
said earlier, the capital flows is represented by the foreign direct investment. The panel
regression result is presented in Table 4. It is evident from the table that, Gross Capital
Formation (GCF), Foreign Direct investment (FDI), Exchange Rate, Population growth rate and
Commodity Price have significant effects on output growth of major commodity exporter in
Sub-Sahara countries. Except for inflation that has a not significant coefficient in all the models. After
controlling for inclusion of explanatory parameters, the results show that positive change in GCF
and Exchange rate reduce economic growth in these countries by 11.28 percent and 0.15
percent, respectively. The implication of this result is that, as investment in real sector or
physical capital is undermined, due to poor infrastructural development, such as electricity,
Licensed under Creative Common Page 203 exchange rate shows the high dependence of the region on foreign goods and services,
specifically, in the process of acquiring capital equipment and security tools.
Essentially, the result shows that a rising level of foreign direct investment, population
growth, and commodity price enhances the position of output growth. Numerically, the
estimations reported a meagre 0.0000125% and 0.000342% change for FDI and population
growth; however, the effects of commodity prices is huge as it has over 20%. The implication
therefore is that, the growth rate accrued to capital inflow (vis-à-vis FDI) is infinitesimal. This
shows the weak position of African countries, particularly sub-Sahara African countries to attract
capital inflows through FDI. Consequently, the commodity concentration of countries in the
region also have varying level of attraction on capital inflows. For instance, the descriptive
estimates show that foreign direct investments were tilted towards countries that supply energy
products in the world market. Whilst, other countries with less concentration on the commodity
received low FDI. This scenario has succeeded in making the contribution of FDI to be very
small in the region.
There are two basic features of population and population growth. It is either a
consuming population or producing one. The result shows that the population growth
characteristics for the region is a consuming one. Increased population within the region has
created a large market for goods and services produced by foreigners. Therefore, as the
population increases, consumption expenditure also increases and this promote growth of
output and not real growth. Conversely, economic growth that is induced by population can as
well come from the contribution or productivity of employed labour in the region. Since, the
region is marred with high unemployment, intuitively, there is slim conviction to attached
economic growth to labour productivity; but could be more realistic to attach such growth to
large market created by this factor (population).
The commodity price has a greater influence on the region growth rate; which confirms
the submission in various literatures that African countries are predominantly primary products
exporters; because the revenue generated from the sales of these commodities constitutes
larger percentage of their gross earning. However, consumption and life expectancy ratio are
the variables that are significant under Fixed Effect and Random Effect model. Consistently,
consumption has reduced poverty after we control for the influence of other variables. Thus, for
1% increase in consumption, poverty has reduced on average by small magnitude (i.e. a
significant one); under fixed effect (4.91E-11) and random effect (5.03E-11); while foreign aid
and remittance are not statistically significant.
The reliability tests conducted, shows that the fixed effect model has superiority over
Licensed under Creative Common Page 204 result of Hausman test, also prefers Fixed Effect to random Effect model; and by implication the
fixed effect panel modelling becomes the model for measuring the effects of capital flows, and
commodity prices on output growth (see Table 4).
Table 4: Panel Data Analysis
Dependent Variable: GDP Growth Rate
Model Pooled Effect Fixed Effect Random Effect
Coefficient Prob. Value Coefficient Prob. Value Coefficient Prob. Value
LOG(GFCR) 21.88267 0.0049 -11.28335 0.0095 -11.57628 0.0073
LOG(FDI) 4.38E-07 0.0000 1.25E-07 0.0000 1.34E-07 0.0000
LOG(EXR) -0.300216 0.0000 -0.155821 0.0015 -0.157781 0.0010
LOG(INF) 0.026835 0.5715 0.019457 0.3766 0.018664 0.3933
LOG(POP) -7.86E-06 0.0045 8.32E-06 0.0342 6.00E-06 0.1023
LOG(COMPRICE) 8.307841 0.0011 21.02638 0.0000 21.12079 0.0000
C 413.8363 0.0516 -30.84411 0.7968 5.242733 0.9873
R-squared 0.189352 0.862934 0.494676
Adj. R-squared 0.180508 0.857019 0.489163
F-statistic 21.41156 145.8971 89.73502
Prob (F-statistic) 0.000000 0.000000 0.000000
Durbin-Watson stat 0.133274 1.683477 1.338903
Table 5: Redundant Fixed Effects Tests
Test cross-section and period fixed effects
Effects Test Statistic d.f. Prob.
Cross-section F 16.210106 (44,604) 0.0000
Cross-section Chi-square 520.855141 44 0.0000
Period F 1.195039 (14,604) 0.2744
Period Chi-square 18.251684 14 0.1956
Cross-Section/Period F 12.805264 (58,604) 0.0000
Cross-Section/Period Chi-square 535.630591 58 0.0000
Correlated Random Effects - Hausman Test
Test cross-section and period random effects
Test Summary Chi-Sq. Statistic Chi-Sq. d.f. Prob.
Cross-section random 7.188427 5 0.0000
Period random 6.742939 5 0.0000
Licensed under Creative Common Page 205
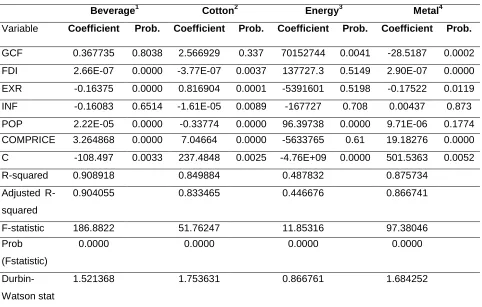
Robustness Results
Table 6, shows the result of Fixed Effect Model (FEM) for segregation of countries by
commodity export. Basically, FDI, exchange rate, population growth and commodity prices are
the major determinants of growth rate in countries that major in exporting beverages; while
inflation and Gross Capital Formation (GCF) remains insignificant. Countries that are major
exporters of cotton, has gross capital formation as the major variable that drives capital inflow.
Surprisingly, countries that concentrated on crude oil and energy commodities for exports, have
gross capital formation and population as major drivers of capital flows and output growth.
Lastly, gross capital formation, foreign direct investment, exchange rate and commodity prices
remain major drivers of output growth for countries that concentrate on metal as major exports.
Table 6: Panel Data Analysis for Commodity Exporters
Dependent Variable: GDP Growth Rate
Beverage1 Cotton2 Energy3 Metal4
Variable Coefficient Prob. Coefficient Prob. Coefficient Prob. Coefficient Prob.
GCF 0.367735 0.8038 2.566929 0.337 70152744 0.0041 -28.5187 0.0002 FDI 2.66E-07 0.0000 -3.77E-07 0.0037 137727.3 0.5149 2.90E-07 0.0000 EXR -0.16375 0.0000 0.816904 0.0001 -5391601 0.5198 -0.17522 0.0119 INF -0.16083 0.6514 -1.61E-05 0.0089 -167727 0.708 0.00437 0.873 POP 2.22E-05 0.0000 -0.33774 0.0000 96.39738 0.0000 9.71E-06 0.1774 COMPRICE 3.264868 0.0000 7.04664 0.0000 -5633765 0.61 19.18276 0.0000 C -108.497 0.0033 237.4848 0.0025 -4.76E+09 0.0000 501.5363 0.0052
R-squared 0.908918 0.849884 0.487832 0.875734
Adjusted R-squared
0.904055 0.833465 0.446676 0.866741
F-statistic 186.8822 51.76247 11.85316 97.38046
Prob (Fstatistic)
0.0000 0.0000 0.0000 0.0000
Durbin-Watson stat
1.521368 1.753631 0.866761 1.684252
1. Burundi, Cote d'Ivoire, Ethiopia, Ghana, Kenya, Uganda
2. Malawi and Zimbabwe
3. Algeria, Angola, Libya and Nigeria.
Licensed under Creative Common Page 206
CONCLUSION
The manual has been able to examine the concept and policies that influences how capital
flows in and out of a country affects output growth in selected sub-Sahara African countries that
are major exporter of Beverages, Cotton, Energy and Metal. The fixed effect panel model (FEM)
is conducted to analyze the data set of eighteen countries, between 1970 and 2015, the result
shows that the Gross Capital Formation (GCF), Foreign Direct investment (FDI), Exchange
Rate, Population growth rate and Commodity Price are significant in influencing the growth rate
in major commodity exporter in Sub-Sahara African countries; but inflation was not significant,
even, after further estimations.
Similarly, the paper apply the same methodology to analyze country specific effect that
is based on commodity classification, the result shows that capital flows proxy by FDI, exchange
rate, population growth and commodity prices are the major determinants of output growth in
countries that major in exporting beverages; while inflation and Gross Capital Formation (GCF)
are not significant. Meanwhile, the results of countries that are major exporters of cotton, show
that all the variables are significant except investment variable (gross capital formation).
Surprisingly, investment (proxy by gross capital formation) and population growth were
significant for countries that are major exporter of crude oil or energy commodities. Whilst,
Investment, capital flows, exchange rate and commodity prices were significant for countries
that concentrate efforts on metal exports.
Capital inflows and volatile commodity price movements pose significant policy
challenges for developing countries. These challenges are of particular relevance to
policymakers in Africa, where large capital inflows and rising commodity prices in recent years
have strongly affected macroeconomic quantities (fixed investment, trade balances, domestic
credit growth, government revenue, GDP growth) as well as prices (CPI inflation, terms of trade,
exchange rates). The question as to how to attract capital flows and promote output growth
despite these challenges is an issue that is resolved in this paper. Therefore, the paper
concludes that, as it is desirable to attract capital flows in these countries, the level of
investments and investments in commodities are quite low to stimulate the big-push needed in
capital flows; and therefore countries should focus on these two major determinants.
Meanwhile, capital flow and commodity prices are good enhancers of output growth. As it is,
their effect is quite inconsequential as they possess meagre contributions. However, with the
commitment to boost general/physical investments and commodity investments, there is
tremendous optimism that the contributions (effects) of these two major variables (capital flows
Licensed under Creative Common Page 207
POLICY IMPLICATIONS
a) The paper recommends increase expenditure on general and physical investments to
promote capital flows and output growth in these countries.
b) It is obvious that commodities and prices have significant effects on output growth and
therefore, massive investments in commodities specifically, along the value-chain in
which these countries have comparative advantage are desirable.
c) The commodity price has a greater influence on the region growth rate; which confirms
the submission in various literatures that Africa countries are predominantly primary
products exporters; because the revenue generated from the sales of these commodities
constitutes larger percentage of their gross earning. The paper therefore recommends
that these countries should ensure that commodities export should be processed before
exported to foreign destinations.
REFERENCES
Canzoneri, M., Cumby, R.E., Diba, B.T., (2005). The need for international policy coordination: what’s old, what’s new, what’s yet to come? J. Int. Econ. 66 (2), 363384
Colombo, J. A., Loncan, T. R., Caldeira, J. F., (2017), “Do Foreign Portfolio Capital Flows Affect Domestic Investment? Evidence from Brazil”, Jornadas Anuales de Economia, September 15
Dhar, A., (2017), “Extreme Capital Flows in Emerging Markets: A Blessing or a Curse?” Department of Economics, University of Mary Washington, Fredericksburg, VA 22401
Fan, L.S., and Fan, C.M., (2002). The Mundell-Fleming model revisited. Am. Econ. 46 (1), 4249. Fleming, M., 1962. Domestic financial policies under fixed and under floating exchange rates.
Ghosh, A., (1986), “International policy coordination in an uncertain world” Econ.Lett. (3).
Gourio, F., Siemer, M., and Verdelhan, A., (2016), “Uncertainty and International Capital Flows”, Federal Reserve Bank of Chicago, United States.
McKinnon, R. And Liu, Z., (2013), “Hot Money Flows, Commodity Price Cycles, and Financial Repression in the US and the People’s Republic of China: The Consequences of Near Zero US Interest Rates”, Asian Development Bank Working Paper Series on Regional Economic Integration, No. 107.
Mustapha, S. A., (2017), “Stock (Mis) pricing and Investment Dynamics in Africa”, African Development Bank Working Paper Series No. 278.
Mustapha, S. A., (2013), “Asset Volatility and Pricing in the Nigerian Stock Exchange Market”, African Economic Research Consortium (AERC), Bi-annual series 2013.
Obstfield, M. and Rogoff, K., (1995).Exchange rate dynamics redux. J. Polit. Econ. June.
Reinhart, C. M., Reinhart, V., and Tresbesch, C., (2016), “Global Cycles: Capital Flows, Commodities, and Sovereign Defaults, 1815 – 2015”, American Economic Review: Papers & Proceedings 2016, 106(5): 574-580.