Gender Differences in Technical-Tactical Behaviour of
1
LaLiga Spanish Football Teams
2
Claudio A. Casal 1,*, Rubén Maneiro 2, Antonio Ardá 3 and José L. Losada 4 3
1 Department of Science of Physical Activity and Sport, Catholic University of Valencia “San 4
Vte Mártir”, Valencia, 46900, Spain. 5
2 Department of Science of Physical Activity and Sport, Pontifical University of Salamanca, 6
Salamanca, Spain. 7
3 Department of Physical and Sport Education, University of A Coruña, A Coruña, 15179, 8
Spain. 9
4 Department of Methodology of Behavioral Sciences, University of Barcelona, Barcelona, 10
08035, Spain. 11
* Corresponding author. [email protected] 12
13
ABSTRACT
14
The aim of this study was to identify gender differences in technical-tactical
15
behaviour in football. To this end 68 matches of the first division of the Spanish
16
men’s and women´s league, corresponding to 2016/17 season were analyzed. A
17
comparison of medians was carried out using the Mann-Whitney U-test were
18
conducted as post hoc test and a grouping of the variables through the
19
clustering bootstrapping technique in both groups. We have detected
20
statistically significant differences regarding all accurate passes, in favour of
21
men, as well as a greater number of yellow cards. In female football, a greater
22
number of picking up free balls, interceptions, lost balls, recoveries, challenges
23
and attacks, both positional and counterattacks, are produced. The clustering
24
analysis also allowed that in male football, the circumstance of receiving a red
25
card is closely related to the number of goals conceded and most of the shots on
26
goal are achieved by positional attacks. In women's football, ball possession on
27
own half is closely related to the number of losses. These results could be useful
28
for gender-specific training information for optimal preparation. However,
29
more research is warranted to establish the main gender differences and
30
characterize women's football.
31 32
Keywords: performance analysis; football; gender differences; LaLiga;
33
technical-tactical behaviour; observational methodology
34 35
1. Introduction
36 37
Women's soccer in recent years has experienced a very important boom,
38
especially from different areas of knowledge [1,2]. According to recent data
39
from FIFA (2014) the number of participating teams has doubled, and the
40
number of participants in the qualifying stages has almost tripled. The media in
41
general and television in particular, are increasingly permeable to host matches
42
and broadcast competitions in which women's football is present [3]. As the
43
general interest in a sport increases, the professionalization of it is inevitable
44
and essential [4]. This professionalization will have to lead to a potential
45
increase in player and team performance, due to a greater and exclusive
46
dedication of the same and will require a greater game knowledge and factors
47
that influence performance. In this regard, it should be noted that scientific
48
knowledge about women's football is quite deficient because, in some cases,
49
this knowledge does not evolve at the same pace as social trends or changes,
50
especially when the latter occur at high speed. To put this in perspective, the
51
availability of the few scientific studies that focus the efforts on this soccer
52
hardly refers to the last twenty years [5,6]
53
If we want to increase performance in women's football we will have to focus
54
on the study of its conditional, technical, tactical-strategic, volitional and
socio-55
affective structure. If we look at the first three, we can see that the number of
56
studies on them is scarce. The works found that have analyzed female football
57
from the conditional and physiological side, such as speeds, accelerations,
58
striking force, fatigue levels, displacements, distances recovered at high
59
intensity and heart rate are those of Bangsbo et al. [7], Barfield et al. [8], Mohr et
60
al. [9,10], Anderson et al. [11], Bradley et al. [12] and Unveren [13]. As we can
61
see, their number is not very wide. But, if the works focused on the conditional
62
analysis are scarce, those related to the technical structure, and tactical-strategic,
63
are still more, since we are facing a situational sport in which these two
64
structures are fundamental, because the main actions of the game must be
65
performed by manipulating a ball with the feet. In addition, these actions are
66
acyclical, stochastic and unexpected. In this sense, some works have been
67
developed that made a comparison of technical-tactical behavior between male
68
and female football, as the one published by Hjelm [14]. Specifically, in this
69
study a comparative analysis of the technical errors (passes, receptions,
70
dribbling, shots, actions with a negative outcome) between male and female
71
players of the Swedish national team is performed. Results show that technical
72
differences were found between genders, specifically, men football players
73
performed more short passes and receptions, on the other hand, women
74
football players perform more actions with a negative outcome, more dribbling
75
and more shots. Another comparative study is that of Bradley et al. [12] in
76
which a comparative analysis was performed between genders of some
77
technical-tactical parameters (duels won, possession time, lost balls, successful
78
passes and touches for possession) in the UEFA Champions League matches,
79
concluding that women lose the ball more times than men, but did not find
80
differences regarding the number of touches by possession, nor in the
81
possession time. In the work of Althoff et al. [15] a comparison between genders
82
was also carried out, analyzing matches of the Men's World Cup in Korea 2002,
and of women in the USA 2003. Their results conclude that, women use more
84
long passes than short ones, the foot's instep, they execute less dribbling and a
85
less aggressive game (less tackling) and they try to get closer to the goal before
86
shooting.
87
In other studies, more emphasis is placed on the differences in tactical
88
behaviour between both genders. An example being the works of Gómez et al.
89
[16] and Pollard and Gómez [17]. In the first one, finalization differences were
90
analyzed between male and female teams in the World Cup 2006 and 2007
91
respectively. Results show a greater goal shot average in women's football than
92
in men's. Women made more collective play shots, while men made more
93
individual shots play. In the second work, a comparison between male and
94
female football was carried out on the influence of obtaining victory when
95
playing at home. Thirty-nine European domestic leagues were analyzed, from
96
2004 to 2010. Results confirm that, in men's football, playing home games is
97
more decisive than in women’s football.
98
On the other hand, some works do not carry out comparative analysis, but
99
focus on studying only female football. An example is the one elaborated by
100
Wlodzimierz et al. [18] in which the field area from which shots were executed
101
and execution leg laterality was studied in the women's under-19 and absolute
102
selections of the world championship, 2004 and 2005 respectively. The results
103
indicate that senior players are ambidextrous, while juniors are not. [19] carry
104
out a very similar study in which foot laterality of the Intercollegiate Women's
105
Football Championship of Turkey players is analyzed. They conclude that these
106
players are characterized by dextrality.
107
Other works analyze the static phases of the game, specifically in the study
108
done by Jiménez et al. [20] the execution of set pieces was analyzed by the F.C
109
Barcelona women's team during the 2014-2015 season. Concluding that set
110
pieces had a low impact in the final score, they were executed sending the ball
111
mostly to the first post, they were produced mainly in the last thirds of the first
112
and second part, and the majority of the goals obtained through these actions,
113
were achieved in the final minutes of both parts of the match.
114
Studies found, for each of the performance structures, indicate the need to
115
deepen the study of women's football, to perform a categorization and
116
quantification of competition behaviors and model training, which will increase
117
competitive performance. The absence of this type of studies will obviously
118
lead to the use of male football training methods and systems, thus obviating
119
one of the principles of sports training, which is none other than training
120
specificity. To avoid this circumstance it will be necessary to increase the
121
number of studies that allow identifying the characteristics of women's football,
122
focusing in the exclusive analysis of their game or, making comparative
analysis between the game of both genders, in order to identify differences
124
between them.
125
It will also be necessary to conduct studies in which domestic competitions
126
are analyzed during a regular season, since the type of competition can
127
influence player and team behavior [21]. Most of the work carried out so far
128
analyzed special competitions (UEFA Champions League, UEFA Euro and
129
FIFA World Cup). This type of design is limited and results may not be
130
conclusive, since in these competitions the number of matches is small and an
131
elimination competition system is established, showing characteristics different
132
from those of a regular league.
133
In addition, to be able to generalize results, it will also be necessary to carry
134
out studies that analyze more than one team, because case studies, focused on a
135
single team, do not generate results that can be extrapolated to other teams. In
136
this sense, we have not found any previous study that analyzes the
technical-137
tactical structure of female elite football with this type of design (during a
138
regular league, more than one team and with a high number of performance
139
indicators). Only Pollard and Gómez [17] use a domestic league sample, but
140
they focus their analysis on the influence of obtaining victory when playing at
141
home.
142
Consequently, to fill in the gaps detected in the previous scientific literature,
143
in this study a comparative analysis of the technical-tactical structure between
144
male and female football is carried out, analyzing a several teams of a domestic
145
competition, during one season. The objectives to be achieved with this study
146
are, on the one hand, to characterize the game of women's football and, on the
147
other hand, trying to identify the technical-tactical differences between the
148
game of both genders.
149 150
2. Method
151 152
Data were obtained from the analysis platform InstatScout and analyzed post
153
event. Instatscout (www.instatscout.com) is a private platform dedicated to
154
assessing the performance of teams in different world leagues. The information
155
cannot be considered either personal or intimate, as the research consisted
156
solely of naturalistic observations in public places, and it was not anticipated
157
that the recordings would be used in a manner that could cause personal harm
158
[22]. No experimental analysis involving human studies is performed in the
159
study. Also, according to Belmont Report [23] the use of public images for
160
research purpose does not required informed consent or the approval of an
161
ethical committee. An ethics approval was therefore not required as per
162
applicable institutional and national guidelines.
2.1. Participants 165
166
A total of 68 matches of the men's first division of the Spanish league and of
167
the women's league during the 2016/17 season were analyzed. Unfortunately,
168
the InstatScout platform only has statistics on 68 matches of the Spanish
169
women's league, corresponding to 14 teams. Therefore, to work with similar
170
samples the same number of matches from the men’s league have been selected
171
randomly. This selection has been developed applying the "srswor" method,
172
which consists of applying a random sample without replacement with the "n"
173
sample size (equal probabilities, setting a sample size without replacement or
174
substitution). InstatScout granted the necessary permits to provide the images
175
and data and use them for research purposes.
176 177
2.2. Performance indicators 178
179
The technical-tactical actions compared in this study and whose operative
180
definitions can be consulted in www.instatscout.com, have been divided into
181
three groups, according to the available literature [24–32], (see Table 1).
182 183
Table 1. Selected performance indicators. 184
185
Groups Performance indicators
Outcome of attack Goals scored, shots, shots on target
Offence
Attacks, positional attacks, attacks with shots-positional, counterattacks, counterattacks with shots, set pieces attack, attacks with shot set pieces attacks, ball possession, ball possession on own half, ball possession on
opponent half, ball possession time in the final third of the field, attacking challenges, attacking challenges won, corners, crosses, crosses
accurate, dribbles, dribbles successful, fouls opponent, lost balls, lost balls in own half, offsides, passes, passes accurate, extra attacking and
key passes, extra attacking and key passes accurate, passes forward, passes forward acurate, passes back, passes back accurate, passes to the
left, passes to the left accurate, passes to the right, passes to the right accurate.
Defence
Challenges, challenges won, air challenges, air challenges won, defensive challenges, defensive challenges won, fouls, goal conceded, interceptions, interceptions in opposition half, picking up free balls, picking up free balls in opposition half, recovered balls, recovered balls
in opposition half, tackles, tackles successful, red cards, yellow cards. 186
3. Data reliability
187 188
To ensure the reliability of the data, five randomly selected matches were
189
coded by the authors of this study and then compared with those provided by
190
InstatScout. The Kappa (K) values obtained ranged from 0.92 to 0.98.
4. Procedure and statistical analysis
193 194
To carry out the statistical analysis the program R (v.3.4.1) was used, using
195
the pvclust library [33]. The significance level for each performance indicator
196
was set at 1% to be more conservative in the detection of differences between
197
groups. Further, the data of the groups were checked for normal distribution
198
(Shapiro-Wilk). Due to the fact that the samples were no normally distributed,
199
non-parametric tests were applied, specifically the Mann Whitney U test.
200
In order to acknowledge the magnitude of the differences between groups,
201
the Mann Whitney U effect size was calculated:
202
203
We explain that z is the standardized score of the Mann Whitney U, and N
204
the number of observations. For its interpretation, the Cohen (1988) criteria is
205
followed, where r = 0.10 equals low difference, r = 0.30 equals medium, r = 0.50
206
equals large and r = 0.70 equals very large, although some authors [34] indicate
207
that Cohen's correlation guidelines are too demanding, being consistent with
208
the significance value of 1%. We maintain this author’s criteria.
209
Finally, due to the large number of variables analyzed, a clustering analysis
210
was carried out in both groups, in order to carry out groupings and check if
211
there are differences in them. Specifically, the bootstrapping technique [35,36]
212
was applied following the following procedure: The R’s pvclust package is used
213
for the uncertainty evaluation in the hierarchical grouping analysis. For each
214
group, p-values are calculated, which are determined using non-parametric
215
multiscalar bootstrap resampling, which is a descriptive exploratory technique.
216
This provides two types of p-values: p-value Approximate Unbiased (AU) and
217
p-value Bootstrap Probability (BP). p-value AU is calculated by bootstrap
218
resampling of multiple scales, it is a better approximation and more unbiased
219
than the p-value of BP, calculated by normal bootstrap resampling, which is
220
less accurate than the AU value. By an analogy with standard normal theory,
221
the p-value AU is roughly estimated with values between 0 and 1. Clusters with
222
AU greater than 0.95 are highlighted by rectangles, which are strongly
223
supported by the data.
224
For a cluster with AU p-value> 0.95, the hypothesis that "the cluster does not
225
exist" is rejected with a significance level of 0.05. These p-values include the
226
sampling error, since they are also calculated by a limited number of bootstrap
227
samples. The cluster analysis application collects a total of 10,000 samples to
228
perform a multiscalar bootstrap resampling. Clusters whose result had an ≥0.90
229
alpha were selected, applying correlational distance.
230 231
5. Results
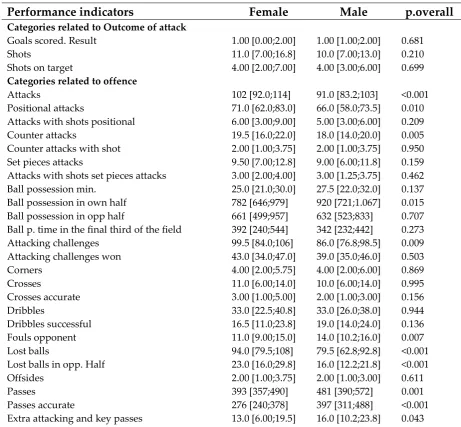
Table 2 shows the results obtained from the comparison of medians between
233
all the variables. No significant differences were found for any variables of the
234
outcome of attack group.
235
For the second group of variables (offensive performance indicators) it can be
236
seen that significant differences were obtained in the variables: attacks,
237
positional attacks, counterattacks, attacking challenges, fouls opponent, lost
238
balls, passes, passes accurate, passes back, passes back accurate, passes to the
239
left and the right, passes to the left and the right accurate and passes forward
240
accurate.
241
In the third group of variables (defensive performance indicator) significant
242
differences have been found in: challenges, challenges won, defensive
243
challenges, defensive challenges won, interceptions, interceptions in opposition
244
half, picking up free balls, picking up free balls in opposition half, recovered
245
balls, recovered balls in opposition half, tackles successful and yellow card.
246 247
Table 2. Summary descriptives table by group of categories. 248
249
Performance indicators Female Male p.overall
Categories related to Outcome of attack
Goals scored. Result 1.00 [0.00;2.00] 1.00 [1.00;2.00] 0.681
Shots 11.0 [7.00;16.8] 10.0 [7.00;13.0] 0.210
Shots on target 4.00 [2.00;7.00] 4.00 [3.00;6.00] 0.699
Categories related to offence
Attacks 102 [92.0;114] 91.0 [83.2;103] <0.001
Positional attacks 71.0 [62.0;83.0] 66.0 [58.0;73.5] 0.010 Attacks with shots positional 6.00 [3.00;9.00] 5.00 [3.00;6.00] 0.209
Counter attacks 19.5 [16.0;22.0] 18.0 [14.0;20.0] 0.005
Counter attacks with shot 2.00 [1.00;3.75] 2.00 [1.00;3.75] 0.950 Set pieces attacks 9.50 [7.00;12.8] 9.00 [6.00;11.8] 0.159 Attacks with shots set pieces attacks 3.00 [2.00;4.00] 3.00 [1.25;3.75] 0.462 Ball possession min. 25.0 [21.0;30.0] 27.5 [22.0;32.0] 0.137 Ball possession in own half 782 [646;979] 920 [721;1.067] 0.015 Ball possession in opp half 661 [499;957] 632 [523;833] 0.707 Ball p. time in the final third of the field 392 [240;544] 342 [232;442] 0.273 Attacking challenges 99.5 [84.0;106] 86.0 [76.8;98.5] 0.009 Attacking challenges won 43.0 [34.0;47.0] 39.0 [35.0;46.0] 0.503
Corners 4.00 [2.00;5.75] 4.00 [2.00;6.00] 0.869
Crosses 11.0 [6.00;14.0] 10.0 [6.00;14.0] 0.995
Crosses accurate 3.00 [1.00;5.00] 2.00 [1.00;3.00] 0.156
Dribbles 33.0 [22.5;40.8] 33.0 [26.0;38.0] 0.944
Dribbles successful 16.5 [11.0;23.8] 19.0 [14.0;24.0] 0.136
Fouls opponent 11.0 [9.00;15.0] 14.0 [10.2;16.0] 0.007
Lost balls 94.0 [79.5;108] 79.5 [62.8;92.8] <0.001
Lost balls in opp. Half 23.0 [16.0;29.8] 16.0 [12.2;21.8] <0.001
Offsides 2.00 [1.00;3.75] 2.00 [1.00;3.00] 0.611
Passes 393 [357;490] 481 [390;572] 0.001
Passes accurate 276 [240;378] 397 [311;488] <0.001
Extra attack. And key passes accurate 5.00 [3.00;10.0] 7.50 [5.00;11.0] 0.047
Passes forward 296 [266;328] 321 [276;368] 0.122
Passes back 106 [74.8;147] 164 [129;201] <0.001
Passes to the left 195 [175;240] 238 [201;286] <0.001
Passes to the right 198 [170;240] 245 [195;276] 0.003
Passes forward accurate 190 [171;236] 239 [196;294] <0.001 Passes back accurate 92.5 [64.5;136] 151 [118;192] <0.001 Passes to the left accurate 140 [121;181] 196 [156242] <0.001 Passes to the right accurate 146 [118;183] 199 [154;237] <0.001
Categories related to defence
Challenges 201 [178;207] 174 [154;193] <0.001
Challenges won 98.0 [87.0;108] 89.0 [79.2;99.5] 0.003
Air challenges 43.0 [33.8;54.2] 47.0 [36.0;63.2] 0.167
Air challenges won 21.5 [17.2;27.8] 25.0 [17.2;32.0] 0.244 Defensive challenges 99.5 [84.0;107] 85.0 [77.0;96.0] 0.002 Defensive challenges won 54.0 [49.2;61.0] 47.0 [41.0;53.8] <0.001
Fouls 12.0 [9.25;16.0] 13.50[10.2;17.0] 0.112
Goals conceded. Result 1.00 [0.00;2.00] 1.00 [0.00;2.00] 0.467
Interceptions 63.5 [55.0;71.0] 51.0 [45.2;55.8] <0.001
Interceptions in opp. Half 15.5 [11.0;19.0] 9.00 [7.00;13.0] <0.001 Picking up free balls 80.0 [74.0;92.0] 63.0 [56.0;74.0] <0.001 Picking up free balls in opp. Half 26.0 [22.0;36.5] 20.0 [15.0;25.8] <0.001 Recovered balls 67.5 [60.0;72.8] 54.0 [51.0;58.0] <0.001 Recovered balls in opp. Half 14.0 [11.0;19.0] 8.00 [6.25;11.8] <0.001
Tackles 44.0 [36.0;52.0] 39.0 [32.0;46.8] 0.022
Tackles successful 26.0 [21.0;29.0] 20.0 [17.0;24.8] <0.001
Red card 1.00 [0.00;2.00] 1.00 [0.00;2.00] 0.013
Yellow card 0.00 [0.00;0.00] 0.00 [0.00;0.00] <0.001
ID_unit 794 [777;810] 484 [224;660] <0.001
Prob. 2.00 [2.00;2.00] 1.00 [1.00;1.00] <0.001
Stratum 1.00 [0.00;2.00] 1.00 [0.00;2.00] <0.001
250
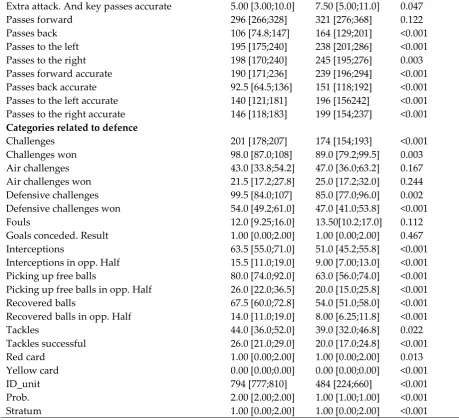
In table 3 we can observe the effect size of the significantly different variables
251
for both genders. The biggest differences are found in the variables recovered
252
balls, recovered balls in opp. half and picking up free balls. The following
253
variables that show intermediate significant differences are interceptions in
254
opp. half, interceptions, passes back accurate, yellow card, passes back, passes
255
to the left accurate, passes accurate, tackles successful, passes to the right
256
accurate, lost balls, picking up free balls in opp. half, defensive challenges won,
257
passes forward accurate, attacks, challenges and passes to the left. Finally, the
258
other variables show very small differences between both genders.
259 260
Table 3. Mann Whitney’s U effect size test results. 261
262
Performance indicators r Interpretation
Recovered balls 0.549 Big difference
Recovered balls in opp. Half 0.538 Big difference
Picking up free balls 0.509 Big difference
Interceptions 0.467 Medium difference
Passes back accurate 0.450 Medium difference
Yellow card 0.443 Medium difference
Passes back 0.418 Medium difference
Passes to the left accurate 0.416 Medium difference
Passes accurate 0.404 Medium difference
Tackles successful 0.397 Medium difference
Passes to the right accurate 0.380 Medium difference
Lost balls 0.372 Medium difference
Picking up free balls in opp half 0.366 Medium difference
Defensive challenges won 0.350 Medium difference
Passes forward accurate 0.341 Medium difference
Attacks 0.336 Medium difference
Challenges 0.318 Medium difference
Passes to the left 0.309 Medium difference
Passes 0.286 Low difference
Defensive challenges 0.275 Low difference
Passes to the right 0.262 Low difference
Challenges won 0.258 Low difference
Counter attacks 0.244 Low difference
Attacking challenges 0.228 Low difference
Fouls opponent 0.233 Low difference
Positional attacks 0.224 Low difference
263
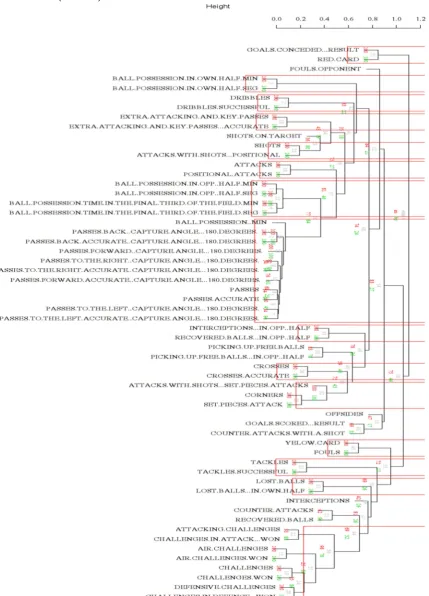
Regarding the results of the clustering analysis, the dendograms of both
264
genders are presented with two p-values. AU that is used for grouping
265
interpretation, and the BP that is the value of "probability bootstrap", less
266
precise than the AU value.
267
In men´s football, 15 clusters have been obtained (Fig. 1). Eleven of them are
268
formed by two variables: Goals conceded result - Red card with AU = 0.99 and
269
Ball possession in own half - Ball possession in own half seconds; Dribbles -
270
Dibbles successful; Extra attacking and key passes - Extra attacking and key
271
passes accurate; Shots - Attacking with shots positional; Interceptions in opp.
272
half - Recovered ball in opp. half; Crosses - Crosses accurate; Yellow card -
273
Fouls; Tackles - Tackles successful; Lost ball - Lost ball in own half all of them
274
with AU = 1.
275
A cluster with three variables: Attacks with shots set pieces attacks - Corners
276
- Set pieces attacks (AU = 1).
277
A cluster with four variables: Ball possession in opp. Half min. - Ball
278
possession in opp. half second - Ball possession in the final third of the field min
279
- Ball possession in the final third of the field (AU = 1).
280
Another cluster with six variables: Attacking challenges - Challenges in
281
attack won - Air challenges - Air challenges won – Challenges - Challenges won
282
- Defensive challenges - Challenges in defence won (AU = 0.96).
283
Finally, the largest cluster formed by eleven variables: Ball possession min -
284
Passes back - Passes back accurate - Passes forward - Passes forward accurate -
Passes to the right – Passes - Passes accurate - Passes to the left - Passes to the
286
left accurate (AU = 1).
287
288
Figure 1. Cluster dendogram with AU/BP values (%) men.
289 290
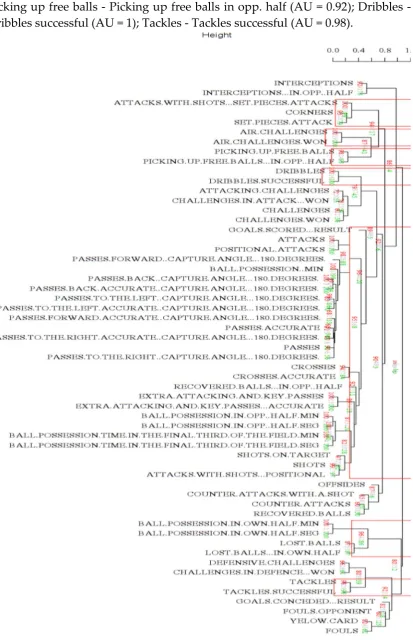
In the case of women's football (Fig.2), 7 clusters are detected. Four clusters
291
are formed by two variables: Air challenger - Air challenger won (AU = 0.1);
Picking up free balls - Picking up free balls in opp. half (AU = 0.92); Dribbles -
293
Dribbles successful (AU = 1); Tackles - Tackles successful (AU = 0.98).
294
295
Figure 2. Cluster dendogram with AU/BP values (%) women.
296 297
A cluster formed by three variables: Attacks with shots set pieces attacks -
298
Corners - Set pieces attacks (AU = 1).
A cluster of four variables: Ball possession in own half min. - Ball possession
300
in own half s. - Lost ball - Lost ball in own half (AU = 0.96)
301
Finally, a cluster formed by twenty-six variables (AU = 0.9): Goal scored -
302
Attack - Positional attack - Passes forward - Ball possession - Passes back -
303
Passes back accurate - Passes to the left - Passes to the left accurate - Passes
304
forward accurate - Passes accurate - Passes to the right accurate - Passes - Passes
305
to the right - Crosses - Crosses accurate - Recovery ball in opp. half - Extra
306
attacking and keys passes - Extra attacking and key passes accurate - Ball
307
possession in opp. half min. - Ball possession in opp. half s. - Ball possession
308
time in the final third of the field min. - Ball possession time in the final third of
309
the field s. - Shots on target - Shots - Attacks with shot positional.
310 311
6. Discussion
312
The objectives of the study were, on the one hand, to describe the
313
characteristics of women's football and, on the other hand, to identify the
314
differences in technical-tactical behavior between the male and female first
315
division football teams of the Spanish league. For this, 68 matches of both
316
competitions were analyzed, corresponding to the 2016/17 season. In this work
317
we intend to establish a comparative analysis to identify differences, not to
318
point them as weaknesses, but as a practice particularity of each gender.In this
319
context, it is the first study that analyzes technical-tactical performance factors
320
of elite women's football in a domestic league during the game’s dynamic
321
phase. Therefore, discrepancies can be found between the evidence found in
322
this study and those of previous works with samples corresponding to special
323
competitions (UEFA Euro, FIFA World Cup and UEFA Champions League),
324
among other reasons, by the type of competition analyzed.
325
Results obtained allow us to indicate the existence of technical-tactical
326
differences between elite football for women and men. Specifically, we can say
327
that women's football is characterized by carrying out a greater number of
328
attacks, both positional and counterattacks. This circumstance, together with a
329
greater number of recoveries and recoveries in the opposite field, will
330
necessarily be linked to the existence of a greater number of transitions,
331
producing more possession changes per game cycle prior to an interruption,
332
which makes it more dynamic. Keeping possession of the ball, first of the
333
objectives of the attacking game of high-level teams, seems that it has not yet
334
been achieved by women teams, perhaps it has something to do with a need to
335
improve the ability to keep the ball in situations of tactical commitment and
336
space-time pressure.
337
Another important difference found refers to the number of passes and
338
successful passes. Our work shows evidence that women make fewer passes of
339
any kind and fewer successful passes than men. These results corroborate those
340
of previous studies such as those of Hjelm [14], who analyzed the Swedish
men's and women's national teams during the 2002, 2006 and 2003, 2007 world
342
championships respectively. In his work he concludes that men make more
343
passes and short passes and women make more long passes and more
344
unsuccesful passes. Another work that corroborates these results is that of [37],
345
who also obtained a greater number of passes in men, as well as the work of
346
Bradley et al. [12] who analyzed gender differences in the UEFA Champions
347
League matches and concluded that women lose more balls and make fewer
348
successful passes than men. The fact of making fewer passes and a greater
349
number of lost balls clearly identifies a less evolved style of play, a style
350
currently abandoned by men's football, which is currently based on long
351
possessions [38–43] and high number of players interventions. We insist that
352
this feature of the game can be closely linked to a deficit in the ball’s domain, in
353
situations of time-space compromise. This data also helps to strengthen the
354
individual character of this game, as just mentioned when describing the type
355
of possessions of women's football.
356
The results of this study also indicate that in women's football a greater
357
number of attacking challenges, defensive challenges and defensive challenges
358
won, picking up free balls and picking up free balls in opposition half is
359
observed. These data coincide with those obtained in the work of Hjelm [14],
360
indicating that in women's football there is less control of the ball and it
361
remains for a longer time without a clear possessor, which leads to a greater
362
number of challenges to gain the ball’s control. We will, therefore, in front of a
363
game in which the percentage of split possession time should be higher than
364
that of male football, which reveals, again, a low technical level game, typical of
365
players in formation stages.
366
We have also found that in women's football there is a greater number of
367
interceptions, interceptions in opposition half, losses, recoveries and recoveries
368
in opposition half. These data are in line with the previous ones and do nothing
369
but strengthen the echo that in women's football there is less control of the ball
370
in real game situations. In the study by Hjelm [14], it is also indicated that
371
women make more mistakes than men, as in the work of Bradley et al. [12] who
372
indicates that women's football produces a greater number of lost balls than in
373
men's.
374
On the other hand, we have not detected differences regarding dribbling,
375
number of shots on target and goals, as Hjelm's work detects, [14], although
376
these differences may be because in their study only the matches of the national
377
Swedish teams were analyzed during the development of two world
378
championships. As in some previous works, we have not detected differences
379
in elements related to the number of corners, offsides, fouls, ball possessions,
380
shots and set pieces.
381
Results found through clustering analysis have also allowed us to identify
382
some relevant differences between the game of both genders. The number of
383
groupings in both genders has been different, as well as the relationships
between the different variables. The first thing we can see is that, in the case of
385
male football, a greater number of groupings have been found (15) and with
386
greater discrimination between the relationships of the different variables. In
387
women's football, the number of groupings has been lower (7) and there is less
388
differentiation between variables. Groupings of men's football allow
389
establishing a better relationship between similar technical-tactical actions,
390
while in female football this discrimination does not occur and a large number
391
of actions with a greater or lesser technical-tactical similarity are included in the
392
same grouping.
393
Of the groupings found in men´s football it is possible to emphasize the
394
narrow relation found between the circumstance of receiving a red card with
395
the number of conceded goals. Which indicates that receiving a red card will
396
entail conceding a greater number of goals. We also checked how the number of
397
shots on goal is related to positional attacks, which corroborates data shown in
398
previous analysis and indicates that male football is characterized by attacks,
399
mostly positional and that these types of attacks are the most successful, results
400
that coincide with some previous works [38–43].
401
In the case of women's football we have seen how challenges are mostly
402
aerial. It is not possible to discriminate different types of attack, passes,
403
possessions and recoveries and a very significant circumstance is that
404
possession time in one's own field is very related to the number of ball losses.
405
As indicated above, women's football is characterized by many ball losses, if we
406
maintain possession a long time in our midfield, this will cause a greater
407
probability of losses in that sector.
408
We can also affirm that women's football is characterized by a less controlled
409
team game, favouring the existence of a greater number of divided balls,
410
proposing a very different playstyle from male football, a game based on
411
dispute and individual duels, very contrary to what one might think by their
412
physical abilities, and that we believe may be related to deficits in their
413
coordinative structure. In this sense it would be necessary to reflect on the
414
suitability of certain changes in the structural elements of the sport itself, such
415
as the ball model and the playing field dimensions, a circumstance similar to
416
that which occurs in lower category competitions in which these elements are
417
modified, to facilitate the game action of players.
418
The data obtained in this study, in which the game of the Spanish league’s
419
first division is analyzed, allows to affirm the existence of functional differences
420
between male and female football and coincide with most of the previous
421
works that studied World Cups, UEFA Euro and UEFA Champions League
422
matches. Therefore, we can indicate that Spanish female elite football has
423
characteristics very similar to those played by national teams and local leagues
424
in other countries. We should ask ourselves if those differences represent a
425
problem to solve or we have to accept them as an identity factor of the women's
426
game.
Results found in this work allow to have greater knowledge of how the game
428
action is developed in women's football and what are the main differences with
429
male football, which will make possible to design a specific preparation, which
430
should pursue as its main objective the improvement of the players
431
coordinating structure. However, we believe that there is a long way to go in
432
the development of training processes that lead to an improvement in
technical-433
tactical skills, so it will be necessary to continue analyzing women's football in
434
depth, in order to have a more exact knowledge of their singularities, thus
435
being able to increase its performance.
436 437
Acknowledgmets
438
We gratefully acknowledge the support of Generalitat Valenciana proyect:
439
análisis observacional de la acción de juego en el fútbol de élite (Consellería
440
d´Educació, Investigació, Cultura i Esport) during the period: 2017-2019
441
(GV2017/044). We also acknowledge the support of Universidad Católica de
442
Valencia “San Vicente Mártir” project: Estudios en el deporte de élite desde los 443
Mixed Methods: técnicas de análisis de estudios comparativos, during the period 2018
444
[Grant UCV2017/230-002]
445 446
References
447 448
1. LeFeuvre AD, Stephenson EF, Walcott SM. Football frenzy: The effect of the 2011 world 449
cup on women’s professional soccer league attendance. J Sports Econ. 2013;14(4):440-8. 450
2. Meier HE, Leinwather M. Women as ‘armchair audience’? Evidence from German 451
national team football. Sociol Sport J. 2012;29(3):365-84. 452
3. Meier HE, Konjer M, Leinwather M. The demand for women’s league soccer in Germany. 453
Eur Sport Manag Q. 2016;16(1):1-19. 454
4. Kjaer JB, Agergaard S. Understanding women’s professional soccer: the case of Denmark 455
and Sweden. Soccer Soc. 2013;14(6):816-33. 456
5. Hoare D, Warr CR. Talent identification and women’s soccer: an Australian experience. J 457
Sports Sci. 2000;18(9):751-8. 458
6. Little T, Williams A. Specificity of acceleration, maximum speed, and agility in 459
professional soccer players. J Strength Cond Res. 2005;19(1):76-8. 460
7. Bangsbo J, Norregaard L, Thorso, F. Activity profile of competition soccer. Can J Sport Sci. 461
1991;16:110-6. 462
8. Barfield W, Kirkendal D, Yu B. Kinematic instep kicking differences between elite female 463
and male soccer players. J Sports Sci Med. 2002;3(1):72-9. 464
9. Mohr M, Krustrup P, Bangsbo J. Match performance of high standard soccer players with 465
special reference to development of fatigue. J Sports Sci. 2003;21:519-28. 466
10. Mohr M, Krustrup P, Anderson H, Kirkendal D, Bangsbo J. Match activities of elite 467
women soccer players at different performance levels. J Strength Cond Res. 2008;2(22):341-468
9. 469
11. Anderson H, Randers M, Heiner-Moller A, Krustrup P, Mohr M. Elite female soccer 470
players perform more high-intensity running when playing in international games 471
12. Bradley PS, Dellal A, Mohr M, Castellano J, Wilkie A. Gender differences in match 473
performance characteristics of soccer players competing in the UEFA Champions League. 474
Hum Mov Sci. febrero de 2014;33:159-71. 475
13. Unveren A. Investigating Women Futsal and Soccer Players’ Acceleration, Speed and 476
Agility Features. Anthropologist. julio de 2015;21:361-5. 477
14. Hjelm J. The bad female football player: women’s football in Sweden. Soccer Soc. 478
2011;12(2):143-58. 479
15. Althoff K, Kroiher J, Hennig EM. A soccer game analysis of two World Cups: playing 480
behavior between elite female and male soccer players. Footwear Sci. 2010;2(1):51-6. 481
16. Gómez M, Álvaro J, Barriopedro M. Patrón de actuación en las acciones de finalización en 482
el fútbol masculino y femenino. Kronos. 2009;VIII(14):5-14. 483
17. Pollard R, Gómez MA. Comparison of home advantage in men’s and women’s football 484
leagues in Europe. Eur J Sport Sci. 2014;14(1):77-83. 485
18. Wlodzimierz S, Józef B, Andrzej S. Movement symmetry and asymmetry of goal shots in 486
female football at European championships and at World Cup. Afr J Phys Health Educ 487
Recreat Dance. 2011;17(4):865-78. 488
19. Akalin T, Gümüş M, Göktepe M, Acar H, Tutkun E. Cerebral Laterality of Women 489
Soccer’s. Int J Acad Res. 2016;8:48-52. 490
20. Jiménez C, Díaz R, Rodríguez D. Análisis observacional de los saques de esquina y tiros 491
libres indirectos en el fútbol femenino de alto nivel. Kronos. 2016;15(2):1-13. 492
21. Taylor JB, Mellalieu SD, James N, Shearer DA. The influence of match location, quality of 493
opposition, and match status on technical performance in professional association 494
football. J Sports Sci. 2008;26(9):885-95. 495
22. A.P.A. Ethical principles of psychologists and code of conduct. 2010. 496
23. Belmont Report T. Ethical Principles and Guidelines for the Protection of Human Subjects of 497
Research. The National Commission for the Protection of Human Subjects of Biomedical 498
and Behavioral Research. Washintton; 1978. 499
24. Castellano J, Casamichana D, Lago C. The Use of Match Statistics that Discriminate 500
Between Successful and Unsuccessful Soccer Teams. J Hum Kinet. 2012;31(1):118-123. 501
25. Lago-Ballesteros J, Lago-Peñas C, Rey E. The effect of playing tactics and situational 502
variables on achieving scorebox possessions in a professional soccer team. J Sports Sci. 503
2012;30:1455-61. 504
26. Lago-Peñas C, Lago-Ballesteros J. Game location and team quality effects on performance 505
profiles in professional soccer. J Syst Sci Med. 2011;10(3):465-71. 506
27. Lago-Peñas C, Lago-Ballesteros J, Dellal A, Gómez M. Game-related statistics that 507
discriminated winning, drawing and losing teams from the Spanish soccer league. J Syst 508
Sci Med. 2010;9(2):288-93. 509
28. Liu H, Gomez M-Á, Lago-Peñas C, Sampaio J. Match statistics related to winning in the 510
group stage of 2014 Brazil FIFA World Cup. J Sports Sci. 21 de julio de 2015;33(12):1205-13. 511
29. Liu H, Hopkins W, Gómez MA, Molinuevo JS. Inter-operator reliability of live football 512
match statistics from OPTA Sportsdata. Int J Perform Anal Sport. 2013;13(3):803-21. 513
30. Tenga A, Holme I, Ronglan LT, Bahr R. Effect of playing tactics on goal scoring in 514
Norwegian professional soccer. J Sports Sci. 2010;28(3):237-44. 515
31. Tenga A, Ronglan LT, Bahr R. Measuring the effectiveness of offensive match-play in 516
professional soccer. Eur J Sport Sci. julio de 2010;10(4):269-77. 517
32. Tenga A, Holme I, Ronglan LT, Bahr R. Effect of playing tactics on achieving score-box 518
possessions in a random series of team possessions from Norwegian professional soccer 519
matches. J Sports Sci. febrero de 2010;28(3):245-55. 520
33. Suzuki R, Shimodaira H. Pvclust: an R package for assessing the uncertainty in 521
34. Gignac GE, Szodorai ET. Effect size guidelines for individual differences researchers. 523
Personal Individ Differ. noviembre de 2016;102:74-8. 524
35. Casella G, Berger RL. Statistical Inference. 2nd Edition. Pacific Grove: Duxbury Press; 2002. 525
36. Efron B, Tibshirani R. An Introduction To The Bootstrap. En: Journal of the American 526
Statistical Association. 1993. p. 436. 527
37. Miyamura S, Susuma S, Hisauki K. A time analysis of men’s and women’s soccer. Sci 528
Footb III. 1997;251-7. 529
38. Bloomfield JR, Polman RCJ, O´Donoghue PG. Effects of score-line on intensity of play in 530
midfield and forward players in the FA Premier League. J Sports Sci. 2005;23:191-2. 531
39. Carling C, Williams AM, Reilly T. Handbook of soccer match analysis: A systematic approach to 532
improving performance. Abingdon UK: Routledge; 2005. 533
40. Casal CA, Losada JL, Ardá T. Análisis de los factores de rendimiento de las transiciones 534
ofensivas en el fútbol de alto nivel. Rev Psicol Deporte. 2015;24(1):103-10. 535
41. Casal CA, Losada JL, Maneiro R, Ardá T. Influencia táctica del resultado parcial en los 536
saques de esquina en fútbol / Influence of Match Status on Corner Kick in Elite Soccer. Rev 537
Int Med Cienc Act Física Deporte. 2017;68:715-728 538
42. Hook C, Hughes M. Patterns of play leading to shots in ‘euro 2000’. Passcom UWIC. 2001; 539
43. James N, Jones PD, Mellalieu SD. Possession as a performance indicator in soccer. Int J 540
Perform Anal Sport. 2004;4:98-102. 541