Article
Parametric Cost Estimation Model for Li-ion Battery
Pack of E-motorcycle Conversion based on Activity
Based Costing
Sofi Desi Susanti*,1, Yuniaristanto1, Wahyudi Sutopo1,2, and Rina Wiji Astuti3
1 Department of Industrial Engineering, Faculty of Engineering, Universitas Sebelas Maret Surakarta 57126, Indonesia; [email protected] (SDS); [email protected] (YA);
[email protected] (WS)
2 National Center for Sustainable Transportation Technology (NC STT), Bandung, 40132, Indonesia
3 CEO of Start-Up Technology, PT Batex Energi Mandiri, Surakarta, Indonesia; [email protected] (RWA) * Correspondence: [email protected];
Abstract: Universitas Sebelas Maret (UNS) through SMART UNS Company has conducted research and development of e-motorcycle conversion using Li-ion battery pack as a substitute for ICE energy source from the conventional motorcycle. Currently, the battery-pack that used for e-motorcycle conversion is in the development phase towards commercialization. The challenge of estimating production costs is the complicated production process and storing hidden expenses that can be a problem. This hidden cost is often a missing or varied factor that costs less or more expensive. This study presents an integrated parametric cost estimation model with activity-based cost assignments to estimate production costs through cost calculations for each activity. Activity-based costs break the production process into a specific cost element for each step. Each activity's cost is put into a parametric cost estimation model to calculate the cost of each activity into the total cost of production. Cost estimation results will be analyzed using a regression method to determine which variables most affect the production cost of Li-ion battery packs for the conversion of e-motorcycles in the SMART UNS company.
Keywords: activity-based costing; battery pack; e-motorcycle conversion;
1. Introduction
The level of motorcycle sales in Indonesia in 2019 increased by 1.6% from the same period last year [1]. The motorcycle still uses the Internal Combustion Engine (ICE) technology, which is very influential on the level of fuel oil usage from fossil energy [2]. For ten years, the consumption of fossil fuels increased by an average of 1.3 percent annually [3] and its annual amount of 14% emissions caused by fossil fuels from the transportation sector. Emissions from the transport sector are mainly coming from vehicles that dominate the release of long-lived greenhouse gases. This makes increased contributions to the total effect of the anthropogenic greenhouse [4]. Emissions resulting from fossil fuels cause an increase in CO2 that results in climate change [5]. The growth rate of CO2 has a strong correlation with global temperature anomalies with CO2. Global warming rates have been accelerated in the last decade. The global surface temperature in 2019 is the 2nd highest in the period of instrumental measurement in the Goddard Institute for Space Studies (GISS) analysis. The global temperature 2019 is + 1.2 °c (~ 2.2 °f) warmer than in the base period 1880-1920 is a reasonable estimate of the 'pre-industrial' temperature [6]. Electric vehicles are automotive products that have capabilities to improve vehicle performance and mitigate the negative effects of the environment [7]. Electric vehicles contribute to the reduction of greenhouse gas emissions evidenced by previous research to date has shown that electric vehicles produce lower greenhouse gas emissions [8]-[9].
One alternative offered as an effort to overcome the problem in this is to use electricity technology to be used as an energy source in all types of vehicles. The use of batteries as energy
storage devices replace fossil fuels in the ICE system. There are two types of products in realizing electric motorcycles: the new design of electric motorcycles and the conversion of technology from ICE to electric technology. There are several previous studies on the new design of an electric motorcycle, including research conducted by Mutyala [10]; Godlewski & Pawlak [11]; and Zarandi, Ebrahimi [12]. The second type of electric motorcycle production is conversion electric motorcycle. This motorcycle converts conventional technology into electrical energy through the Battery-Pack, BMS, and Drivetrain, which substitutes motor and engine parts [13]. Although many countries have Produced BEVs, there are fewer researches that have been conducted for e-motorcycle conversion. SMART UNS has become a company that has conducted research and development on e-motorcycles conversion using lithium-Ion batteries as a substitute for ICE energy sources for conventional motorcycles. UNS as a member of the consortium team to develop a national electric vehicle is developing a lithium-ion battery (Li-Ion) for energy storage in electric vehicles. Battery-pack test results with power 1 kWh are E-motor conversion can travel about 35-40 km, with speeds that can reach 125 km/h. This result means that the battery can replace the vehicle's fuel oil. Following the research phase, UNS is currently researching to prepare the commercialization of Li-ion e-motorcycle conversion [14].
Technological developments allow electrochemical energy storage based on lithium-ion cells. In order to use the lithium-ion battery massively, one of the major constraints is low system cost [15]. Battery-Pack for the e-motorcycle conversion is a new product manufactured by SMART UNS that has a complicated production process and saves hidden costs. After determining the requirements for a particular vehicle (e.g., maximum speed, acceleration, and range), as well as the cellular portfolio arrangement to be considered in determining investment costs that indirectly affects the production cost [16]. Production costs include many variables, such as materials, machinery, equipment, and labor. These hidden costs often represent missing or unmeasured factors. It is important to estimate the cost to identify and select which variables can be used to determine the battery pack's final price. Revealing these hidden costs is required to make a good decision between making an alternate production process or developing a device. The parametric model approach is the most appropriate in estimating the cost of new products that are still under development [17].
Parametric estimation is a cost estimation technique using mathematical equations to integrate costs with physical parameters related to items to be estimated. In this study, the parametric cost estimation method is integrated with activity-based costing. The activity-based costing method can allocate costs accurately by charging product costs based on the consumption of resources needed for each activity. Horngren [18] states that one of the best ways to estimate costs is to implement a cost calculation system based on activity or activity-based costing (ABC). The main step of Activity-based costing (ABC) is to identify activities Activity-based on the system. This method identifies the costs needed for each activity to facilitate cost tracking. This activity improves the cost calculation system by identifying individual activities as fundamental (object) cost objects. Ben-Ariech & Qian [19] stated that the application of activity-based costing on a parametric cost estimate can improve the accuracy of the calculation. There have been some previous studies using this method conducted by Sutopo, Atikah, Purwanto, Danardono, & Nizam [14]; Ardiansyah, Sutopo, & Nizam [17]; Sutopo, Nizam, Purwanto, Atikah and Putri [20]; W. Sutopo; A. Eliza; R. Ardiansyah; Yuniaristanto; and M. Nizam. Parametric [21], MY Abu; KR Jamaludin; and MA Zakaria [22]. The cost estimation model will be analyzed using the regression analysis method to improve the accuracy of the estimated cost's final results and to identify variables that affect the cost of producing lithium-ion battery packs produced by SMART UNS.
2. Materials and Methods
2.1 Data Collection
This study developed a parametric cost estimation model with an activity-based costing approach. Figure 1 shows the flow of research using this approach. The initial phase of this research begins with collecting data such as the bill of materials from battery packs and business processes from the SMART UNS company. The bill of materials and business processes of the Li-ion battery pack by SMART UNS are shown in Figure 2 and Figure 3. Through these data, we can identify cost driver rates and cost centers for each activity. Cost driver rates are the main component in the parametric cost estimation model. The estimated cost estimation model is used to calculate production costs.
Figure 1. Research Process
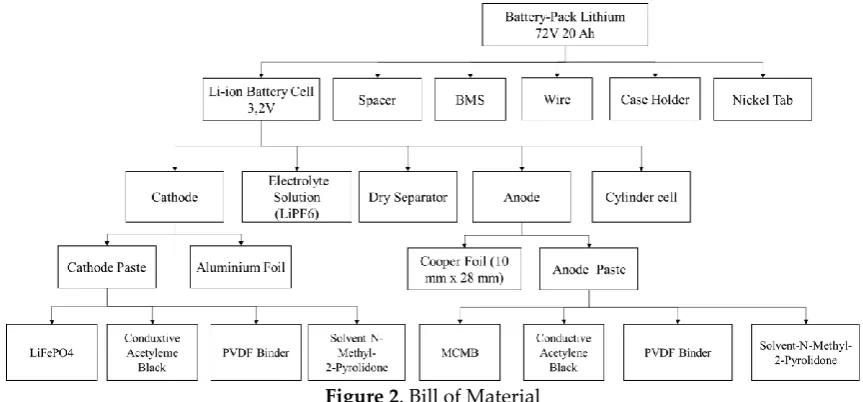
The development cost estimation model starts with identifying the BOM Li-ion battery pack. The BOM tree structure of a Li-ion battery is shown in Figure 2. Through the bill of material provides information related to the components forming a Li-ion battery pack. BOM is used as an essential data parameter in product life cycle management that represents product information such as the hierarchical part associated with a particular product. Through multi-levels BOM can be used to determine the engineering bill of materials needed in estimating costs.
Figure 2. Bill of Material
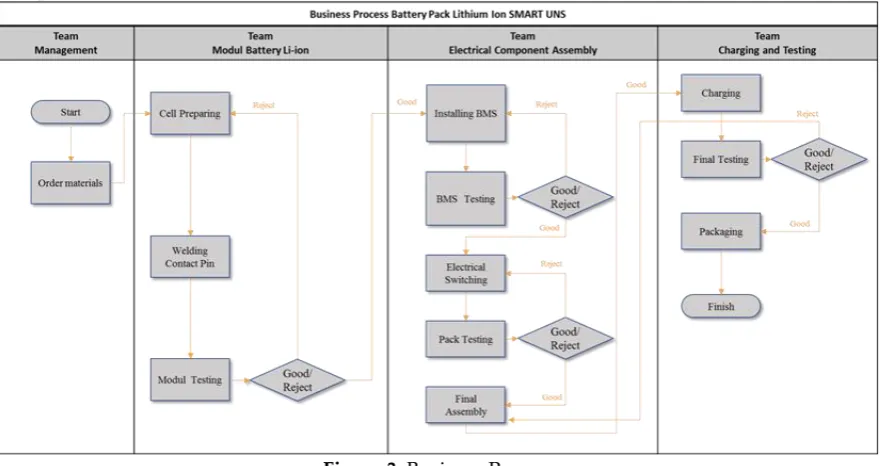
group working on the production process of the electrical component assembly stage. The charging and testing team is a group that is working on the final stages of the production process, namely charging and final tests. There are two types of li-ion battery packs produced at SMART UNS type A for 150cc and type B for 110cc. Both models have the same production process, and the difference is the specifications of the material used.
Figure 3. Business Process
2.2 Cost Driver and Cost Center Identification
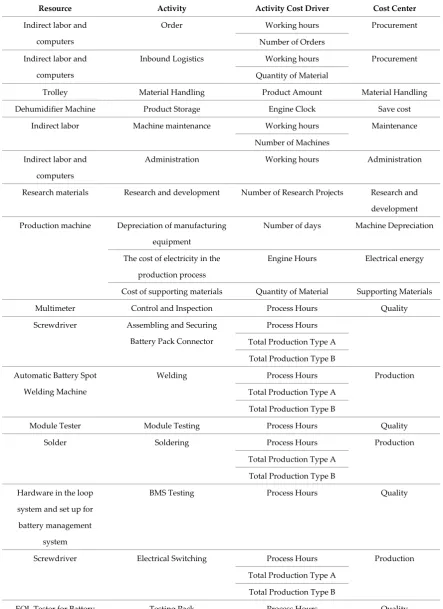
Activity-based costs are developed to get a more accurate cost estimate [23],[24]. The difference between activity-based costing with the traditional system is the determination of cost drivers [25]-[27]. Cost driver is a driving factor that triggers cost and intermediate factors between cost objects with activities and resources [28]. For selecting the cost driver should be done carefully to ensure the accuracy of the cost. Some researchers have conducted research related to cost drivers as conducted by Cokins and Căpuşneanu [27], Sheng [28], Geiger [29], Răvaş and Monea [30],Dražić-Lutilsky and Dragija [31].
According to Sheng, the cost driver has some specific characteristics such as concealment, relevance, application, and accountability [28]. Cost drivers must have a causality relationship with the activities and costs, it must be measured and explain the use of resources consumed during an activity [30]. Cost drivers should demonstrate correctly the relationship between specific activity and cost objects [31],[32]. One of the requirements of the construction of the cost driver is the cost parameter. Each cost driver relates directly to the process engineering, it can be used in creating task chains. The engineering process associated with this cost driver can be triggered to generate value for cost parameters.
Table 1. Cost Driver and Cost Center Identification
Resource Activity Activity Cost Driver Cost Center
Indirect labor and
computers
Order Working hours Procurement
Number of Orders
Indirect labor and
computers
Inbound Logistics Working hours Procurement
Quantity of Material
Trolley Material Handling Product Amount Material Handling
Dehumidifier Machine Product Storage Engine Clock Save cost
Indirect labor Machine maintenance Working hours Maintenance
Number of Machines
Indirect labor and
computers
Administration Working hours Administration
Research materials Research and development Number of Research Projects Research and
development
Production machine Depreciation of manufacturing
equipment
Number of days Machine Depreciation
The cost of electricity in the
production process
Engine Hours Electrical energy
Cost of supporting materials Quantity of Material Supporting Materials
Multimeter Control and Inspection Process Hours Quality
Screwdriver Assembling and Securing
Battery Pack Connector
Process Hours
Total Production Type A
Total Production Type B
Automatic Battery Spot
Welding Machine
Welding Process Hours Production
Total Production Type A
Total Production Type B
Module Tester Module Testing Process Hours Quality
Solder Soldering Process Hours Production
Total Production Type A
Total Production Type B
Hardware in the loop
system and set up for
battery management
system
BMS Testing Process Hours Quality
Screwdriver Electrical Switching Process Hours Production
Total Production Type A
Total Production Type B
EOL Tester for Battery
Module and Pack
Testing Pack Process Hours Quality
Screwdriver Install Case Process Hours Production
Total Production Type A
Total Production Type B
Resource Activity Activity Cost Driver Cost Center
EOL Tester for Battery
Module and Pack
Final Testing Process Hours Quality
2.3 Parametric Cost Estimation Model Development
In calculating the cost estimation model with the activity-based costing approach, it can generally be done by multiplying the cost driver rate by the number of driving activities as in equation (1).The cost driver rate is the cost that must be incurred for each activity undertaken. The equation (2) is used to calculate cost driver rates.
𝐶
𝑗= ∑
𝐾𝑘=1(𝑅
𝑗𝑘𝑥 𝑄
𝑗𝑘)
(1)
𝑅
𝑗𝑘=
𝑇𝐴𝑗𝑘𝑉𝑗𝑘
(2)
Where 𝐶𝑗 is activity costs j, 𝑅𝑗𝑘 is cost driver k for activity j, 𝑄𝑗𝑘 is number of activity in activity, 𝑇𝐴𝑗𝑘 is total activity costs j, 𝑉𝑗𝑘 is the predicts number of activity drivers k in activity j.
The total cost of the activity considers several things. In indirect activities, it is necessary to consider overhead costs such as indirect labor costs, machine depreciation costs, electricity costs, consumables costs, and other costs that support these activities. Whereas the direct activity costs that are considered in the calculation of activity costs are the direct labor cost and raw material costs. 2.4 Monte Carlo Simulation
In this research, monte Carlo simulations are carried out to produce data on the amount of production, considering that the battery pack is a new product with no historical data. The monte Carlo simulation through the generation of random numbers is performed using the function on equation (3). This data is used in multiple linear regression analysis to analyze the variables that affect the cost of making a battery pack at SMART UNS.
= RAND () * (Max Prod-Min Prod) + (Min Prod)
(3)
3. Results and Discussion
3.1 Parametric Cost Estimation Model
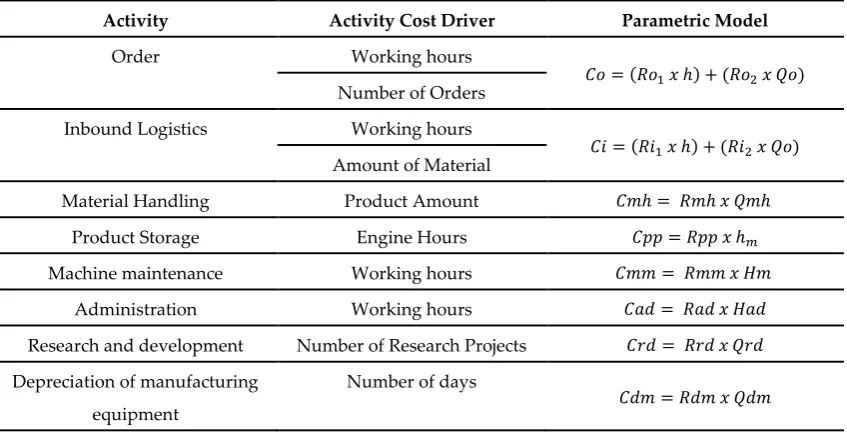
Through business processes and field observations, it was found that there were ten indirect activities and 11 direct activities. Through these activities, the cost driver is identified to build a parametric cost estimation model. Table 2 shows the parametric cost estimation model with an activity-based costing approach.
Table 2. Parametric Cost Estimation Model Based on Activity
Activity Activity Cost Driver Parametric Model
Order Working hours
𝐶𝑜 = (𝑅𝑜1𝑥ℎ) + (𝑅𝑜2𝑥𝑄𝑜) Number of Orders
Inbound Logistics Working hours
𝐶𝑖 = (𝑅𝑖1𝑥ℎ) + (𝑅𝑖2𝑥𝑄𝑜) Amount of Material
Material Handling Product Amount 𝐶𝑚ℎ = 𝑅𝑚ℎ𝑥𝑄𝑚ℎ
Product Storage Engine Hours 𝐶𝑝𝑝 = 𝑅𝑝𝑝𝑥ℎ𝑚
Machine maintenance Working hours 𝐶𝑚𝑚 = 𝑅𝑚𝑚𝑥𝐻𝑚
Administration Working hours 𝐶𝑎𝑑 = 𝑅𝑎𝑑𝑥𝐻𝑎𝑑
Research and development Number of Research Projects 𝐶𝑟𝑑 = 𝑅𝑟𝑑𝑥𝑄𝑟𝑑
Depreciation of manufacturing equipment
Number of days
The cost of electricity in the production process
Engine Hours
𝐶𝑒𝑙 = 𝑅𝑒𝑙𝑥ℎ𝑚
Cost of supporting materials Amount of Material 𝐶𝑖𝑚 = 𝑅𝑖𝑚𝑥𝑄𝑖𝑚
Quality Assurance Activities Process hour 𝐶𝑞𝑐 = 𝑅𝑞𝑐𝑥 ℎ𝑞𝑐
Production Activity Process Hours 𝐶𝑙𝑗= 𝑅𝑙𝑗𝑥ℎ𝑗
Total Production Type A
𝐶𝑚𝑖𝑗= ∑(𝑅𝑚𝑖𝑗 𝑥𝑄𝑖𝑗) 𝑛
𝑖=1 Total Production Type B
3.2 Numerical Example
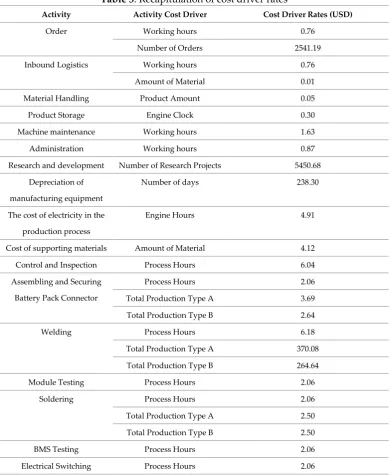
In this section, an estimated battery-pack production cost is calculated for one period. This section begins with calculating the cost driver rates for each activity using equation two and calculates the production cost using the parametric cost estimation model in table 2. Table 3 is a recapitulation of the calculation of cost driver rates for each activity.
Table 3. Recapitulation of cost driver rates
Activity Activity Cost Driver Cost Driver Rates (USD)
Order Working hours 0.76
Number of Orders 2541.19
Inbound Logistics Working hours 0.76
Amount of Material 0.01
Material Handling Product Amount 0.05
Product Storage Engine Clock 0.30
Machine maintenance Working hours 1.63
Administration Working hours 0.87
Research and development Number of Research Projects 5450.68
Depreciation of
manufacturing equipment
Number of days 238.30
The cost of electricity in the
production process
Engine Hours 4.91
Cost of supporting materials Amount of Material 4.12
Control and Inspection Process Hours 6.04
Assembling and Securing
Battery Pack Connector
Process Hours 2.06
Total Production Type A 3.69
Total Production Type B 2.64
Welding Process Hours 6.18
Total Production Type A 370.08
Total Production Type B 264.64
Module Testing Process Hours 2.06
Soldering Process Hours 2.06
Total Production Type A 2.50
Total Production Type B 2.50
BMS Testing Process Hours 2.06
Activity Activity Cost Driver Cost Driver Rates (USD)
Total Production Type A 0.55
Total Production Type B 0.55
Testing Pack Process Hours 2.06
Install Case Process Hours 2.06
Total Production Type A 9.67
Total Production Type B 9.67
Charging Process Hours 2.06
Final Testing Process Hours 2.06
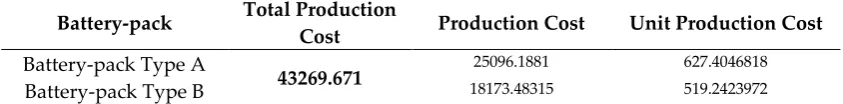
The calculation uses the parametric cost estimation model in table 2 for a period of 1 month with total production for type A is 40 units and type B for 35 units. Table 4 is calculated the estimated costs for total production and unit costs of each type of li-ion battery pack for e-motorcycle conversion. Detailed calculations of estimated production costs for one month are shown in Appendix A2.
Table 4. The Result of Calculating the Estimated Costs (USD) Battery-pack Total Production
Cost Production Cost Unit Production Cost
Battery-pack Type A
43269.671 25096.1881 627.4046818
Battery-pack Type B 18173.48315 519.2423972
3.3 Simulation Design
In this section, the Monte Carlo simulation design for the number of lithium-ion battery pack production for e-motorcycle conversion. Monte Carlo simulation aims to develop data that will be used to analyze multiple linear regression models. Monte Carlo simulations can predict errors from simulations that are proportional to the number of iterations. For new products, the specified error value is 58% [36]. Equation (4) to calculate the number of iterations needed to get a result with an error of 58%.
𝑁 = (
3 𝑥 𝜎𝜀
)
(4)
Where 𝑁 is the number of iterations, 𝜎 is a standard deviation, and 𝜀 is an error value. The results of the calculation of the number of repetitions using equation (4) are 1512 iterations. Table 5 is the result of random numbers generated through the RAND function of Microsoft Excel using equation (3) and the calculation of estimated costs using the parametric model in table 2.
Tabel 5. Li-ion Battery-pack Production Data
Iterate Battery Pack Type A
Unit Production
Cost (USD)
Battery Pack Type B
Unit Production
Cost (USD)
Total Production Cost (USD)
1 38 612.34 34 504.15 72 40411.00
2 35 628.75 32 520.63 67 38665.55
3 36 632.32 30 524.20 66 38489.53
4 37 618.66 33 510.47 70 39734.40
5 38 609.32 35 501.13 73 40695.13
⁞ ⁞ ⁞ ⁞ ⁞ ⁞ ⁞
1508 37 621.89 32 513.76 69 39450.26
1509 40 606.37 34 498.25 74 41195.65
1510 38 618.66 32 510.47 70 39842.59
1511 39 639.87 25 531.68 64 38245.62
3.4 Estimation of Multiple Linear Regression Models
This section analyzes multiple linear regression to establish the relationship between the dependent and independent variables. There are 3 regression models built, the first regression model to determine the total cost of producing lithium-ion battery packs for e-motorcycle conversions. The second and third regression models are used to determine the cost of production per unit of lithium-ion battery packs for Type A and Type B. In calculating cost estimatlithium-ion using activity-based costing, costs are triggered by the existence of resource usage activity. Each activity has an activity cost driver that determines the number of costs incurred according to the resources used. Wagner (2012) stating that production volumes are a fundamental trigger cost. Therefore, independent variables in multiple linear regression analyses used the number of total production and the number of battery-pack production for type A and type B. This section is used IBM SPSS Statistics 25 software to estimate the regression model between the dependent variable and the independent variable.
1st Model :
𝑦 = 15839.108 + 108.162 𝑥1+ 284.190 𝑥2 (5)
𝑦 : Total cost of production (USD)
𝑥1 : Total production of lithium-ion battery packs for Type A (Unit) 𝑥2 : Total production of lithium-ion battery packs (Unit)
2nd Model :
𝑦 = 864.806 − 0.016 𝑥
1− 3.505 𝑥
2 (6)𝑦 : Unit production cost of Lithium-ion pack-battery for Type A (USD) 𝑥1 : Total production of lithium-ion battery packs for Type A (Unit) 𝑥2 : Total production of lithium-ion battery packs (Unit)
3rd Model :
𝑦 = 756.554 − 0.015 𝑥
1− 3.504 𝑥
2 (7)𝑦 : Unit production cost of Lithium-ion pack-battery for Type B (USD) 𝑥1 : Total production of lithium-ion battery packs for Type A (Unit) 𝑥2 : Total production of lithium-ion battery packs (Unit)
3.5 Classical Assumption Test
The classic assumption test aims to provide certainty that the regression equation obtained has accuracy in estimation, is unbiased and consistent. The classical assumption test consists of 4 parts, namely, multicollinearity, autocorrelation, heteroscedasticity, and normality.
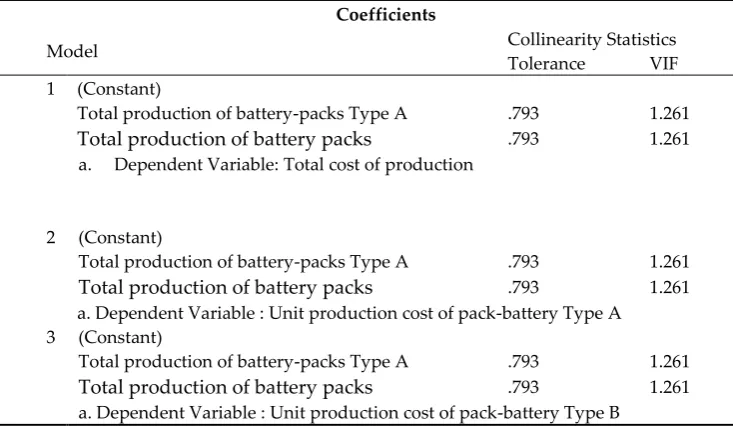
Table 6. Multicollinearity Test Results Coefficients
Model Collinearity Statistics
Tolerance VIF 1 (Constant)
Total production of battery-packs Type A .793 1.261 Total production of battery packs .793 1.261 a. Dependent Variable: Total cost of production
2 (Constant)
Total production of battery-packs Type A .793 1.261 Total production of battery packs .793 1.261 a. Dependent Variable : Unit production cost of pack-battery Type A
3 (Constant)
Based on table 6. the VIF value for each independent variable is less than 10. This shows a regression model free of multicollinearity.
Table 7. Autocorrelation Test Results
Model Model Summary
1 Durbin-Watson 2.041
DU 1.9166
4-DU 2.0833
a. Predictors: (Constant), total production of battery-packs Type A, total production of battery packs
b. Dependent Variable: Total cost of production
2 Durbin-Watson 1.972
DU 1.9166
4-DU 2.0833
a. Predictors: (Constant), total production of battery-packs Type A, total production of battery packs
b. Dependent Variable: Unit production cost of pack-battery Type A
3 Durbin-Watson 1.974
DU 1.9166
4-DU 2.0833
a. Predictors: (Constant), total production of battery-packs Type A, total production of battery packs
b. Dependent Variable: Unit production cost of pack-battery Type B
Based on table 7. these three models have a DW value between DU and 4-DU (DU<DW<4-DU) therefore the regression model is declared free of autocorrelation problems.
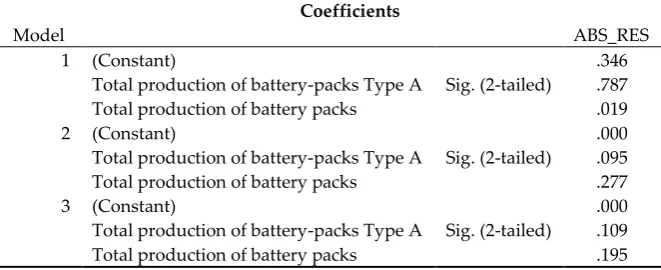
Table 8. Heteroscedasticity Test Results Coefficients
Model ABS_RES
1 (Constant)
Sig. (2-tailed)
.346 Total production of battery-packs Type A .787
Total production of battery packs .019
2 (Constant)
Sig. (2-tailed)
.000 Total production of battery-packs Type A .095
Total production of battery packs .277
3 (Constant)
Sig. (2-tailed)
.000 Total production of battery-packs Type A .109
Total production of battery packs .195
(a)
(b) (c)
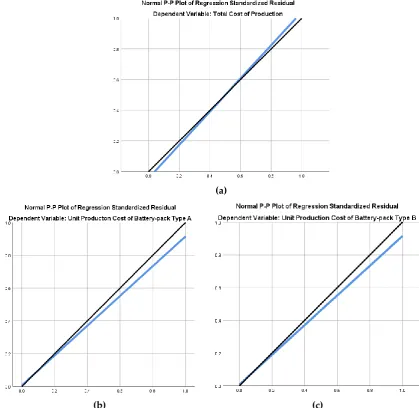
Figure 3. Normal Plot Graph (a) Model 1; (b) Model 2; (c) Model 3
Based on Figure 3 it is known that the distribution of points is relatively close to the diagonal line so that the residual data criteria are normally distributed with the Normal Plot approach.
3.6 Model Feasibility Test
In this section, test the estimation of the regression model that has been formed in section 3.4 to measure the accuracy of the regression model in estimating the actual value. This section uses the F test and the T test.
3.6.1 F Test
In this section, an F test is performed to determine whether the independent variables simultaneously affect the dependent variable. 2 hypotheses are used. In general, these two hypotheses are:
a. H0 = Simultaneous independent variables do not significantly influence the dependent variable.
b. H1 = Simultaneous independent variables simultaneously have a significant effect on the dependent variable.
Table 9. F Test Results ANOVAa
Model F Sig.
1 Regression 2325861160635.100 .000
a. Predictors: (Constant), total production of battery-packs Type A, total production of battery packs
b. Dependent Variable: Total cost of production
2 Regression 224077.572 .000
a. Predictors: (Constant), total production of battery-packs Type A, total production of battery packs
b. Dependent Variable: Unit production cost of pack-battery Type A
3 Regression 234110.173 .000
a. Predictors: (Constant), total production of battery-packs Type A, total production of battery packs
b. Dependent Variable: Unit production cost of pack-battery Type B
Because the significance value <0.05, the three models have a simultaneous influence between the independent variables on the dependent variable.
3.6.2 T Test
T-test is a method of testing the model to determine the effect of each regression coefficient on the dependent variable. There are 2 hypotheses are used, in general these two hypotheses are:
a. H0 = The independent variable has no significant effect on the dependent variable. b. H1 = The independent variable has a significant effect on the dependent variable.
Hypothesis testing is done by comparing the significance value with 5%. If the significance value <0.05 then H0 is rejected, and if the significance value> 0.05 then H0 is accepted.
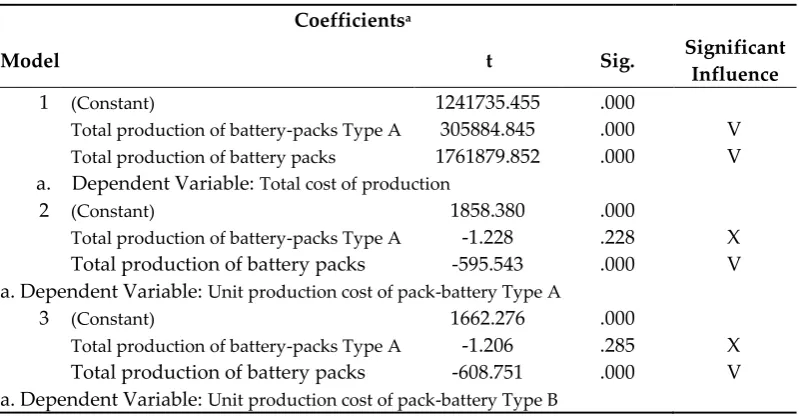
Table 10. T Test Result Coefficientsa
Model t Sig. Significant
Influence
1 (Constant) 1241735.455 .000
Total production of battery-packs Type A 305884.845 .000 V Total production of battery packs 1761879.852 .000 V a. Dependent Variable: Total cost of production
2 (Constant) 1858.380 .000
Total production of battery-packs Type A -1.228 .228 X Total production of battery packs -595.543 .000 V a. Dependent Variable: Unit production cost of pack-battery Type A
3 (Constant) 1662.276 .000
Total production of battery-packs Type A -1.206 .285 X Total production of battery packs -608.751 .000 V a. Dependent Variable: Unit production cost of pack-battery Type B
3.7 Determination of the Most Influential Variables
To find out the independent variables that most influence the dependent variable, use the Standard Coefficient Beta test. The highest beta coefficient marks the independent variable that has the biggest effect.
Table 11. Beta Coefficient Coefficientsa
Model Standardized
Coefficients Beta
Most Influential Variables
1 (Constant)
Total production of battery-packs Type A .159 X
Total production of battery packs .917 V
a. Dependent Variable: Total cost of production
2 (Constant)
Total production of battery-packs Type A .002 X
Total production of battery packs -.997 V
a. Dependent Variable: Unit production cost of pack-battery Type A
3 (Constant)
Total production of battery-packs Type A .002 X
Total production of battery packs -.997 V
a. Dependent Variable: Unit production cost of pack-battery Type B
The relation of total cost per unit with change of the activity output is known by reviewing the behavior of cost [37]. In literature, the cost behavior is described as fixed or variable with respect to changes in production volumes. Volumes of output as the fundamental cost driver. Variable costs change proportionally to the change in production volumes [38]-[39]. In standard cost models, variable costs change proportionately with changes in the activity driver, implying that the magnitude of a change in costs depends only on the extent of a change in the level of activity, not on the direction of the change [40].
Based on the first model, it is known that the number of production variables has the highest beta coefficient, 0.917. Therefore, production costs are more influenced by the number of production variables compared to other variables. The factor owned by the total variable production is positive, this shows that if the total production increases, the total production cost will increase as well. Based on the second model, it is known that the number of production variables has the highest beta coefficient, which is 0.997. Therefore, production costs are more influenced by the number of production variables compared to other variables. The coefficient owned by the total production variable is negative, this shows that if the total production increases, the production cost of type A battery units will be smaller. Based on the third model it is known that the number of production variables has the highest beta coefficient value, which is 0.997. Therefore, production costs are more influenced by the number of production variables compared to other variables. The coefficient owned by the total production variable is negative, this shows that if the total production increases, the cost of producing a B type battery unit will be smaller. In this study when the assumption expanded by enlarging the value of significance then it is possible that the H0 can be accepted even if it is wrong and resulting in a change of influence between the dependent variables to the independent variables. Based on the analysis, the company can maximize the amount of production according to the production capacity to reduce the cost of unit production. By maximizing the amount of production, the price of the product can be more competitive. To achieve production capacity, the company can create an operation process chart and apply standard operational procedures without override product quality.
4. Conclusions
view of product costs than traditional cost methods by identifying each activity element's entire cost. This method determines all activities related to the production process, allocates costs for these activities, and helps classify the production process costs more easily and faster.
The activity-based costing method is integrated with the parametric cost estimation method, which is the right method to be applied with the estimated cost of producing a Li-ion battery-pack for e-motorcycle conversion through a mathematical model. Cost estimation results that reflect a significant difference between product specifications. In addition, cost estimation also reflects the overall use of the company's resources. Activity-based costing helps companies in resource management to get a more competitive cost. Moreover, changes in the operation process for cost reduction will allow the company to fulfill customer needs. Therefore, the battery-pack company can use the activity-based costing method to accurately estimate the cost.
This research also used the regression analysis to analyze. The results of data processing show that the total production costs and unit production costs of the two types have the greatest influence on the total production. However, the total production variable has a different effect on the calculation of total production costs and unit production costs. In the calculation of the total production costs, if the amount of production is increases, the total production costs will increase. Whereas in the calculation of unit production costs it is known that if the total production amount increases, the unit production costs will decrease.
Author Contributions: Conceptualization, W.S. and S.D.S; methodology, S.D.S, and W.S, YA.; validation, W.S, and YA; data curation, S.D.S and R.W.A.; writing—original draft preparation, S.D.S.; writing—review and editing, W.S and YA..; visualization, S.D.S.; supervision, W.S, YA., and R.W.A. All authors have read and agreed to the published version of the manuscript.
Funding: This research was partially funded by the Indonesian Ministry of Research, Technology, and Higher Education under the WCU program, managed by Institut Teknologi Bandung.
Acknowledgments: This paper was supported by USAID through Sustainable Higher Education Research Alliances (SHERA) Program-Centre for Collaborative (CCR) National Center for Sustainable Transportation Technology (NCSTT) with grant No. IIE00000078-ITB-1.
Appendix A
Table A1. Notation Description
Notation Description
𝐶𝑜 Order Fees (USD)
𝐶𝑖 Logistics inbound costs (USD)
𝑅𝑜1 Fixed fee per hour for order activities (USD / order) ℎ Working hours (hours)
𝑅𝑜2 Tariff for one order (USD / order) 𝑄𝑜 Order Amount (order)
𝑅𝑖1 Fixed fee per hour for inbound logistic activities (USD / order) 𝑅𝑖2 Inbound logistics tariff per unit of material (USD / unit)
𝑄𝑖 Amount of material (unit) i Order number
𝐶𝑚ℎ Material handling costs (USD)
𝑅𝑚ℎ Hourly Material Handling Rates (USD / unit) 𝑄𝑚ℎ Number of products (units)
𝐶𝑝𝑝 Storage fee (USD)
𝑅𝑝𝑝 Product hourly storage rate (USD / hour) ℎ𝑚 Engine hours (hours)
𝐶𝑚𝑚 Machine maintenance costs (USD)
𝑅𝑚𝑚 Hourly engine maintenance rate (USD / hour) 𝐻𝑚𝑚𝑖 Number of technician working hours (hours)
𝐶𝑟𝑑 Research and development costs (USD)
𝑅𝑟𝑑 Research rates per research project (USD / project) 𝑄𝑟𝑑 Amount of research projects (Projects)
𝐶𝑎𝑑 Administration fee (USD) 𝑅𝑎𝑑 Hourly administration fee (USD) 𝐻𝑎𝑑 Total administrative hours (hours)
𝐶𝑑𝑚 Cost of depreciating machinery and production equipment (USD) 𝑅𝑑𝑚 Depreciation rates for machinery and production equipment per day
(USD / unit)
𝑄𝑑𝑚 Number of days in a month (unit)
𝐶𝑒𝑙 Production machine electricity costs (USD) 𝑅𝑒𝑙 Electric machine production hourly (USD / hour) 𝐶𝑖𝑚 Cost of supporting materials (USD)
𝑅𝑖𝑚 Rates of auxiliary materials per unit (USD / unit) 𝑄𝑖𝑚 Amount of auxiliary material used (unit)
𝐶𝑞𝑐 Quality control costs (USD)
𝑅𝑞𝑐 Hourly quality control and inspection rates (USD / hour) ℎ𝑞𝑐 Number of QC hours (hours)
Notation Description 𝑅𝑙 Hourly direct labor rates (USD / hour)
𝑅𝑚𝑖 Material tariff for series i battery packs per unit battery pack (USD / unit) 𝑄𝑖 Number of pack-battery (unit) production
World Electric Vehicle Journal 2020, 11, x; doi: FOR PEER REVIEW www.mdpi.com/journal/wevj Appendix B
1
Table A2. Calculation of Estimation Cost (USD)
2
Activity Cost Cost Driver
Rates Quantity
Unit Production
Cost Type A
Unit Production
Cost Type B Total
Order Order activity overhead 0.764 200 81.487958 71.301963 152.789922
Charge order fees 2541.187 1 1355.299696 1185.887234 2541.186929
Inbound Logistics Inbound logistic overhead 0.764 200 81.487958 71.301963 152.789922
Material costs 0.009 43980 234.357737 146.820268 381.178005
Material Handling Material handling costs 0.046 75 1.830622 1.601794 3.432416
Product Storage Save cost 0.296 525 82.910273 72.546488 155.456761
Machine maintenance Machine maintenance costs 1.629 200.0 173.796053 152.071547 325.867600
Administration General & administrative costs 0.936 200 99.794175 87.319904 187.114079
Research and development Research and development costs 5450.676 1 2907.027299 2543.648887 5450.676186 Depreciation of manufacturing
equipment
Depreciation of manufacturing equipment
204.934 30 3278.940294 2869.072758 6148.013052
The cost of electricity in the
production process
The cost of electricity in the production process
3.674 525 1028.643827 900.063349 1928.707176
Cost of supporting materials Cost of supporting materials 4.119 1 2.196746 1.922153 4.118899
Control and Inspection Labor costs 27.344 4.52 65.988739 57.740147 123.728885
Assembling and Securing Battery
Pack Connector
Labor costs 2.061 25.34 27.852706 24.371118 52.223824
Material costs for Type A 372.744 40 14909.754926 0.000000 14909.754926
Material costs for Type B 266.246 35 0.000000 9318.596828 9318.596828
Welding Labor costs 6.183 12.67 41.779059 36.556677 78.335736
Material costs for Type A 1.030 40 41.188989 0.000000 41.188989
World Electric Vehicle Journal 2020, 11, x; doi: FOR PEER REVIEW www.mdpi.com/journal/wevj
Activity Cost Cost Driver
Rates Quantity
Unit Production
Cost Type A
Unit Production
Cost Type B Total
Module Testing Labor costs 2.061 13.57 14.921093 13.055956 27.977049
Soldering Labor costs 2.061 12.67 13.926353 12.185559 26.111912
Material costs for Type A 2.504 40 100.171621 0.000000 100.171621
Material costs for Type B 2.504 35 0.000000 87.650168 87.650168
BMS Testing Labor costs 2.061 13.57 14.921093 13.055956 27.977049
Electrical Switching Labor costs 2.061 27.15 29.842185 26.111912 55.954097
Material costs for Type A 0.549 40 21.967461 0.000000 21.967461
Material costs for Type B 0.549 35 0.000000 19.221528 19.221528
BMS Testing Labor costs 2.061 13.57 14.921093 13.055956 27.977049
Install Case Labor costs 2.061 9.05 9.947395 8.703971 18.651366
Material costs for Type A 9.666 40 386.627308 0.000000 386.627308
Material costs for Type B 9.666 35 0.000000 338.298895 338.298895
Charging labor costs 2.061 54.30 59.684370 52.223824 111.908194
Testing Pack Labor costs 2.061 13.57 14.921093 13.055956 27.977049
References
1. Ministry of Industry. 2018. Avaible online: https://kemenperin.go.id/artikel/1984/Laju-Industri-Sepeda-Motor (accessed on 14 Januari 2020).
2. Sadeghinezhad, E.; Kazi, S. N.; Sadeghinejad, F.; Badarudin, A.; Mehrali, M.; Sadri, R.; and Safaei, M. R. A comprehensive literature review of bio-fuel performance in internal combustion engine and relevant costs involvement. Renewable and Sustainable Energy Reviews. 2014, 30, 29-44.
3. Statistical Review of World Energy 69th Edition. 2020. Available Online :
https://www.bp.com/content/dam/bp/business-sites/en/global/corporate/pdfs/energy-economics/statistical-review/bp-stats-review-2020-full-report.pdf (Accesed on : 20 June 2020)
4. E. Uherek, et al. Transport impacts on atmosphere and climate: Land transport. Atmospheric Environment 44. 2010, 4772-4816. DOI: 10.1016/j.atmosenv.2010.01.002.
5. Shiying Wang & Mengpin Ge. 2019. Everything You Need to Know About the Fastest-Growing Source of Global Emissions: Transport. World Research Institute. Available online:
https://www.wri.org/blog/2019/10/everything-you-need-know-about-fastest-growing-source-global-emissions-transport (Acessed on 27 June 2020)
6. James Hansen, et al. Global Temperature in 2019. 2020. Available online :
http://www.columbia.edu/~jeh1/mailings/2020/20200115_Temperature2019.pdf (Accessed on 27 June
2020)
7. Al-Alawi, B. M., & Bradley, T. H. Review of hybrid, plug-in hybrid, and electric vehicle market modeling Studies. Renewable and Sustainable Energy Reviews, 2013, 21, 190–203. DOI: 10.1016/j.rser.2012.12.048
8. Guerra, E. Electric vehicles, air pollution, and the motorcycle city: A stated preference survey of
consumers’ willingness to adopt electric motorcycles in Solo, Indonesia. Transportation Research Part
D: Transport and Environment, 2017. DOI:10.1016/j.trd.2017.07.027
9. Chang, Y. & Y. Li. 2019. Electric Vehicles and Energy Insecurity in ASEAN Countries: Renewable Energy Integration and Urban Air Quality. ADBI Working Paper 1025. Tokyo: Asian Development Bank Institute. Available Online : https://www.adb.org/publications/electricvehicles-energy-insecurity-aseancountries (Accessed on : 20 June 2020)
10. Mutyala, Srinivas. Design and Development of Electric Motorbike. International Research Journal of Engineering and Technology (IRJET), 12 December2019; 6(12),19-29. ISSN: 2395-0072.
11. Godlewski T., and Pawlak W. Design of supporting frame for light electric motorcycle. 12th Students'
Science Conference, Oficyna Wydawnicza Politechniki Wrocławskiej, 2015; 303-309. ISSN 1732-0240.
12. R. Nasiri-Zarandi and M. Ebrahimi. Extracting requirements for design a two-wheels electric vehicle and proposing a design procedure. 9th Annual Power Electronics, Drives Systems and Technologies Conference (PEDSTC),Tehran, 2018; pp. 462-468. doi: 10.1109/PEDSTC.2018.8343841
13. Nizam, M. Comparative study of electric vehicles in urban area in Indonesia. AIP Conference 485 Proceedings (Vol. 2217, No. 1, p. 030141). AIP Publishing LLC, 2020.
14. W. Sutopo; N. Atikah; A. Purwanto; D. P. T. D. Danardono and M. Nizam. A cost estimation model to assess the feasibility of Li-Ion battery development based on targeted cost by market approach. 2014 International Conference on Electrical Engineering and Computer Science (ICEECS). 2014, 376-380. DOI : 10.1109/ICEECS.2014.7045281.
15. Carloni, Andrea & Baronti, Federico & Di Rienzo, Roberto & Roncella, Roberto & Saletti, Roberto. Open and Flexible Li-ion Battery Tester Based on Python Language and Raspberry Pi,2018, Electronics, 7.,454. DOI : 10.3390/electronics7120454.
16. Becker, Jan & Nemeth, Thomas & Wegmann, Raphael & Sauer, Dirk. Dimensioning and Optimization of Hybrid Li-Ion Battery Systems for EVs. World Electric Vehicle Journal, 2018, 9. DOI 10.3390/wevj9020019.
17. R. Ardiansyah, W. Sutopo & M. Nizam. A parametric cost estimation model to develop prototype of electric vehicle based on activity-based costing, 2013 IEEE International Conference on Industrial Engineering and Engineering Management, Bangkok. 2013, 385-389. DOI:10.1109/IEEM.2013.6962439 18. Horngren,Charles T., et al. Akuntansi Biaya. Edisi 7. 2008. PT INDEKS GRAMEDIA: Jakarta.
20. W. Sutopo, M. Nizam, A. Purwanto, N. Atikah, AS Putri. A Cost Estimation Application for Determining Feasibility Assessment of Li-Ion Battery in Mini Plant Scale. International Journal on Electrical Engineering and Informatics. 2016, 8 (1), 189-199. DOI : 10.15676/ijeei.2016.8.1.13
21. W. Sutopo; A. Erliza; R. Ardiansyah; Yuniaristanto; and M. Nizam. Parametric Cost Estimation for Controlling the Development of Electric Vehicle Prototype. Jurnal Mekanikal. 2016, 3956-68.
22. MY Abu; KR Jamaludin; and MA Zakaria. Characterisation of activity based costing on remanufacturing crankshaft. International Journal of Automotive & Mechanical Engineering. 2017, 14 (2), 4211-24. https://doi.org/10.15282/ijame.14.2.2017.8.0337
23. Sharma, R., & Ratnatunga, J. Teaching note: Traditional and activity based costing systems,
Accounting Education, 2007, 6(4), 337–345. http://dx.doi.org/10.1080/096392897331406
24. Raz, T., & Elnathan, D. Activity based costing for projects. International Journal of Project
Management, 1999, 17(1), 61–67. http://dx.doi.org/10.1016/S0263-7863(97)00073-2
25. Geri, N.; & Ronen, B. Relevance lost: the rise and fall of activity-based costing. Human Systems
Management, 2005, 24(2), 133-144.
26. Oduoza, C.F. Reflections on costing, pricing and income measurement at UK higher education
institutions. Journal of Higher Education Policy & Management, 2009, 31(2), 133–147.
http://dx.doi.org/10.1080/13600800802559328
27. Cokins, G., & Capusneanu, S. Cost Drivers. Evolution and Benefits. Theoretical and Applied
Economics, 2010,8(549), 7–16.
28. Sheng, Y.M. Research on selection methods of cost driver. Journal of Modern Accounting and
Auditing, 2009, 5(9), 52, 47–49.
29. Geiger, D. R. Practical Issues in Cost Drivers Selection for Managerial Costing System. The
Government Accountants Journal, 1999, 48(3), 32.
30. Ravas, B., & Monea, A. The definition and determination of the cost drivers, basis elements in the ABC
system implemented in a tourism unit. Lucrari Stiintifice, 2009, 11(4), 1–6.
31. Dražic-Lutilsky, I., & Dragija, M. Activity based costing as a means to full costing–possibilities and
constraints for European universities. Journal of Contemporary Management Issues, 2012,17(1), 33–57.
32. Percevic, H., & Dražic-Lutilsky. Cost Allocation Accounting Methods Used in the Croatian Production
Sector. South East European Journal of Economics & Business, 2008, 3(1), 49–57. DOI:
10.2478/v10033-008-0006-8.
33. Fong, C.C. and Kumar, N. 2002, Cost Accounting, 2nd ed., HKAAT.
34. Erick ten Brinke. 2002. Costing support and cost control in manufacturing A cost estimation tool applied in the sheet metal domain. PrintPartners Ipskamp, Enschede, The Netherlands. ISBN 90-365-1726-5.
35. Katrin T & Tatjana P. Theoretical Framework and an Overview of the Cost Drivers that are Applied in Universities for Allocating Indirect Costs. Procedia - Social and Behavioral Sciences 110, 2014, 1014 – 1022. doi: 10.1016/j.sbspro.2013.12.948
36. Kahn, Kenneth B. An Exploratory Investigation of New Product Forecasting Practices. The Journal of Product Innovation Management 19, 2002, 133-143.
37. Riwayadi. Akuntansi Biaya.Pendekatan Tradisional dan Kontemporer. 2014. Jakarta: Salemba Empat. ISBN : 9789790615373
38. Hansen, Don R., Mowen, M. M. & Guan, L. Cost management: accounting & control, 6th ed. 2009. Mason: South-Western. ISBN : 9780324559675.
39. Weygandt, J., Kimmel, J. P. D. & Kieso, E. D. (2010), Managerial accounting: tools for business decision making, 5th ed. Hoboken, NJ: John Wiley & Sons. ISBN : 978-1-119-40405-7