Journal of Pain Research
Reliability of four experimental mechanical pain
tests in children
Ann-Britt L Soee1 Lise L Thomsen2 Birte Tornoe1,3 Liselotte Skov1
1Department of Pediatrics, Children’s
Headache Clinic, Copenhagen University Hospital Herlev,
Copenhagen, Denmark; 2Department
of Neuropediatrics, Juliane Marie Centre, Copenhagen University Hospital Rigshospitalet, København Ø, Denmark; 3Department of
Physiotherapy, Medical Department O, Copenhagen University Hospital Herlev, Herlev, Denmark
Correspondence: Ann-Britt L Soee Department of Pediatrics, Children’s Headache Clinic, Copenhagen University Hospital Herlev, Copenhagen, Denmark Tel +00 452 288 3153 Fax +00 453 868 5012 Email [email protected]
Purpose: In order to study pain in children, it is necessary to determine whether pain measurement tools used in adults are reliable measurements in children. The aim of this study was to explore the intrasession reliability of pressure pain thresholds (PPT) in healthy children. Furthermore, the aim was also to study the intersession reliability of the following four tests: (1) Total Tender-ness Score; (2) PPT; (3) Visual Analog Scale score at suprapressure pain threshold; and (4) area under the curve (stimulus–response functions for pressure versus pain).
Participants and methods: Twenty-five healthy school children, 8–14 years of age, participated. Test 2, PPT, was repeated three times at 2 minute intervals on the same day to estimate PPT intrasession reliability using Cronbach’s alpha. Tests 1–4 were repeated after median 21 (interquartile range 10.5–22) days, and Pearson’s correlation coefficient was used to describe the intersession reliability.
Results: The PPT test was precise and reliable (Cronbach’s alpha $ 0.92). All tests showed a good to excellent correlation between days (intersessions r = 0.66–0.81). There were no indica-tions of significant systematic differences found in any of the four tests between days. Conclusion: All tests seemed to be reliable measurements in pain evaluation in healthy children aged 8–14 years. Given the small sample size, this conclusion needs to be confirmed in future studies.
Keywords: repeatability, intraindividual reliability, pressure pain threshold, pain measurement, algometer
Introduction
Background
Chronic pain, which is often associated with mood disorders, lost social relations, and decreased school attendance, might have profound consequences for the child in every
aspect of their daily lives.1,2 Consequently, further investigation of the mechanisms
of pain perception in children is needed. Better knowledge might prevent chronifica-tion and ensure optimal treatment. In order to study pain percepchronifica-tion in children, it is necessary to determine whether the pain measurement tools used in adults are reliable measurements in children.
Tension-type headache (TTH) causes pain and is one of the two most frequent
primary headache disorders in children.3 The prevalence of TTH in schoolchildren and
adolescents is reported to be 10%–25%; however, 0.1%–5.9% of children suffer from
chronic TTH ($15 days/month).4,5 In adults suffering from frequent TTH, different
pain measurement tools have been used to hypothesize about the changes noted in
varying levels along the sensory pathway.6 Adult studies of TTH have demonstrated that
Dovepress
M E T H O D O L O g y
open access to scientific and medical research
Open Access Full Text Article
Journal of Pain Research downloaded from https://www.dovepress.com/ by 118.70.13.36 on 24-Aug-2020
For personal use only.
Number of times this article has been viewed
This article was published in the following Dove Press journal: Journal of Pain Research
increased tenderness in response to the palpation of
pericra-nial myofascial tissues is the most apparent abnormality.6
Until now, very few studies worldwide have focused on pain perception in children and adolescents suffering from TTH, and they primarily concentrated on the Total
Tenderness Score (TTS) in pericranial tissue,7–9 as well as
pressure pain thresholds (PPT).7,9–11 TTS is a sum score of
tenderness evaluated through the standardized palpation of
different pericranial muscles and tendons.12 Evaluated using
an algometer, PPT is defined as the minimum intensity of a
stimulus that is perceived as painful.13
Another way of evaluating pain perception in children could include the rating of stimuli at an individual PPT-adjusted suprathreshold (SupraPPT) by a Visual Analog Scale (VAS) score. This might allow a corrected comparison between children. Furthermore, a test that evaluates the child’s VAS scores after applying increasingly mechanical pressures to a particular muscle could provide a total mea-sure of the child’s pain perception while covering a broad range of pressure intensities. The total measure would be represented by the area under the curve (AUC) of the child’s various VAS scores. The latter tool has previously been used in research in adults.14
Used in children and adolescents in general, the valid-ity and reliabilvalid-ity of self-rating scales like the VAS have
previously been well described.15 However, research on the
reliability of experimental pain measurement tests has been quite limited. The preliminary conclusion of method studies of PPT is that PPT is a reliable pain measurement tool in
children.16–18 The reliability of TTS, VAS score at SupraPPT,
or the AUC has not yet been assessed.
Influenced by many factors such as demographics (age, sex, ethnicity), genetics, and psychosocial (cognitive pro-cesses, psychosocial history, social learning, personality) factors, the experience of pain is highly unique and
idio-syncratic across individuals.19 Pain perception studies may
nonetheless also be influenced by the measurement error, which refers to the degree to which the pain measurements obtained fail to reflect the actual pain experienced.
One issue, especially with regard to children, is whether or not respondents are cognitively capable of understand-ing the instructions given, and whether they can reproduce their own results. To test this question, our goal with this study was to determine the intraindividual variability. Intraindividual variability is also known as the repeatability or test–retest reliability of a test, and refers to the individual variation of outcome measures seen if the test is repeated with the exact same procedure, test room, rater, and assistant.
Intraindividual variability can be tested both in the same session (intrasession) or within a period of days in between testing (intersessions). In the present study, we focused on pain measurement tools used in the craniocephalic region to provide a basis for later research in children with or without frequent TTH.
Objectives
The aim of this study was to explore the intrasession reliabil-ity of PPT in healthy children. Furthermore, the aim was also to study the intersession reliability of the following four tests: (1) TTS; (2) PPT; (3) VAS score at SupraPPT; and (4) AUC (stimulus–response functions for pressure versus pain).
Methods
Study design
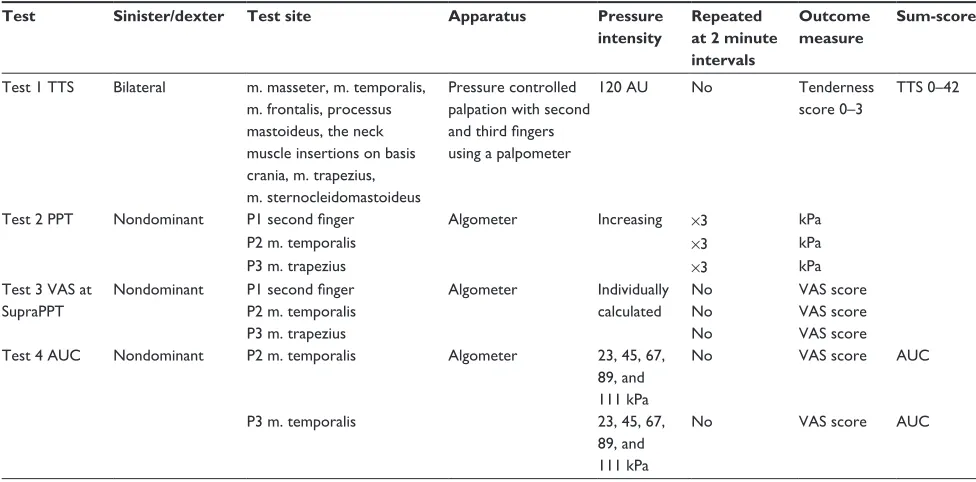
This is a test–retest study. An overview of the tests is found in Table 1.
Participants
Healthy children were recruited from two schools in the Copenhagen area. The enrolment and examinations took place from May 2009 to November 2010. The age of 7 years was assumed to be the limit of the cognitive capability required to perform the tests. The VAS score has previ-ously been tested as being reliable and valid in children over
5–6 years of age.15 In total, 28 classes with around 20 pupils
in each (aged 7–15 years) were told face-to-face about the study by a pediatrician in the classroom. Children who were interested in participating received a letter with written information to take home to their parents. The parents were asked to respond by email, and responding parents were subsequently contacted by telephone by the same pediatri-cian, and informed oral consent was given. Written informed consent was provided later.
The present study is part of a larger case-control study of the pathophysiological mechanisms involved in children with TTH. The participation of 60 healthy children was initially planned; some of these children are the participants of this study as well.
Sixty children responded; 57 children performed the tests, whereas three children were absent at the day of examination. The school boarders engaged in practical planning of the days to retest; 25 of the 57 children were randomly selected from the initial sample, and each child was tested twice. All of the children asked agreed to be retested. The exact same procedure, test room, rater, and assistant were used at the second test day. A priori, we planned to repeat the test Dovepress
Soee et al
Journal of Pain Research downloaded from https://www.dovepress.com/ by 118.70.13.36 on 24-Aug-2020
after 14 days. This time interval should ensure that the child could not remember their last answers, which might introduce bias. The examination of the 25 children who attended the test twice is described in the following section.
Children were excluded if they had more than 12 headache days per year, or if they had any kind of chronic illness. The exclusion criteria were determined by the assumption that infrequent TTH is a very common disease among children, making it difficult to recruit children with no headache at all. They were also determined by the assumption that the
pres-ence of eventual infrequent headache disease (,1 day per
month) would not affect the test–retest reliability of pain
measurements in children.3,5
Setting
The children were not permitted to take pain medication 12 hours prior to the tests so that the medication did not interfere with eventual pain perception in the myofascial tissues. The examination took place in a familiar room in the child’s own school during the school day.
During the tests, all children were examined by the same physiotherapist with pediatric experience, and each child was assisted by the same pediatrician. The physiotherapist was blinded to the child’s answers. The tests lasted 30 minutes in total, and were performed in the order outlined below. Children performed the examination alone. Parents were invited to
participate, but they all felt that that their child was secure. A comfortable environment was established by means of conver-sation. In order to prevent anxiety, the researchers did their best to inform the child about what to expect during the tests.
The child was placed in a vertical position in an adjustable chair with head- and armrests. The chair was individually adjusted to encourage relaxed muscles during the test. The child was examined while dressed, but was asked to uncover the shoulder and neck area. None of the children reported experiencing a headache during the tests.
Variables
The following variables were used: TTS, PPT, VAS score at SupraPPT, and AUC (stimulus–response functions for pres-sure versus pain).
Test 1 TTS
Tenderness in the pericranial structures was assessed by the
TTS system,12 which was previously proven to be reliable
in adults.20 The investigator was positioned in front of the
child. Seven myofascial structures were palpated bilaterally: m. masseter, m. temporalis, m. frontalis, processus mastoideus, the neck muscle insertions on the basis cranii, m. trapezius, and m. sternocleidomastoideus. Each structure was palpated with the pulpa of the second and third finger in a rotating manner, point to point, for a total of 4–5 seconds.
Table 1 Overview of tests performed during one session (30 minutes)
Test Sinister/dexter Test site Apparatus Pressure intensity
Repeated at 2 minute intervals
Outcome measure
Sum-score
Test 1 TTS Bilateral m. masseter, m. temporalis, m. frontalis, processus mastoideus, the neck muscle insertions on basis crania, m. trapezius, m. sternocleidomastoideus
Pressure controlled palpation with second
and third fingers
using a palpometer
120 AU No Tenderness
score 0–3
TTS 0–42
Test 2 PPT Nondominant P1 second finger Algometer Increasing ×3 kPa
P2 m. temporalis ×3 kPa
P3 m. trapezius ×3 kPa
Test 3 VAS at SupraPPT
Nondominant P1 second finger
P2 m. temporalis P3 m. trapezius
Algometer Individually calculated
No No No
VAS score VAS score VAS score Test 4 AUC Nondominant P2 m. temporalis Algometer 23, 45, 67,
89, and 111 kPa
No VAS score AUC
P3 m. temporalis 23, 45, 67,
89, and 111 kPa
No VAS score AUC
Abbreviations: TTS, Total Tenderness Score; AU, arbitrary units; PPT, pressure pain threshold; VAS, Visual Analog Scale; SupraPPT, pressure pain threshold-adjusted suprathreshold; AUC, area under the curve.
Dovepress Reliability of pain tests in children
Journal of Pain Research downloaded from https://www.dovepress.com/ by 118.70.13.36 on 24-Aug-2020
If a difference between the two sides was detected, each side was palpated separately to obtain a score. The palpation pressure was moderate and standardized according to 120 arbitrary units (AU) on a palpometer kindly on loan from the Danish Headache Centre, Glostrup University Hospital, Denmark. The palpometer has previously been described and validated as a useful tool for obtaining a standardized pressure, and 120 AU has been demonstrated to represent a
pressure equal to 353 g.21 Tenderness was evaluated on a
four-point scale: 0 = no visible reaction and denial of tenderness;
1 = no visible reaction but verbal report of discomfort or
mild pain; 2 = verbal report of painful tenderness, facial
expression of discomfort, or no reaction; and 3 = marked
grimacing or withdrawal, verbal report of marked painful tenderness, and pain. Values from both sides were summed to a TTS between 0 and 42.
Test 2 PPT
The PPT was assessed using a Somedic Algometer type II
(SBMEDIC Electronics, Solna, Sweden).22
The algometer is comprised of a gauge attached to a hard rubber tip, and the gauge is connected to a finger but-ton. Pressure was applied though the rubber surface area
of 1 cm2 at a rate of 10 kPa per second. The instrument
was placed perpendicular to the skin’s surface. Only the nondominant side was tested to avoid eventual differences in tissue composition and pain perception according to hand dominance. We tested PPT at three different sites: P1, dorsum of the second finger’s interphalanx; P2, the anterior temporal region where palpation revealed the belly of the muscle during contraction; and P3, m. trapezius, the halfway point between C7 and the acromion. The method was demonstrated one time at each site before testing to ensure that the participants were familiar with the test. The participants were asked to indicate when the pressure became painful based on this definition: “When you feel the sensation changes from pressure to the slightest pain press the button immediately.” The electronic display was then read. This procedure was conducted in accordance with the International Association for the Study of Pain’s definition of the pain threshold, which is, “the minimum intensity of
a stimulus that is perceived as painful.”13 Each measure site
was tested three times with 2 minutes between each test, but the site was changed at each measure.
Test 3 VAS score at SupraPPT
The SupraPPT in each individual child and test site is defined as the mean of the child’s three consecutive PPT measures
+ 50%. SupraPPT was calculated at the three test sites, P1,
P2 and P3. The algometer was placed perpendicular to the skin. The pressure of the calculated SupraPPT was applied to the child for a total of 3–4 seconds at each site. The child was asked to mark the pain level with a pencil on a printed VAS showing a happy face on one end and a crying face in the other end. The child was then told that the happy face represented no pain and the crying face represented the worst pain they could imagine. The VAS score was later measured at 0–10.0 cm.
Test 4 AUC (stimulus–response
functions for pressure versus pain)
The Somedic Algometer II (SBMEDIC Electronics) was used to apply pressure of five different intensities to the test sites: P2 (m. temporalis) and P3 (m. trapezius). Again, only the nondominant side was tested to avoid any differences in tissue composition and pain perception according to hand dominance. The intensities were: 23 kPa, 45 kPa, 67 kPa, 89 kPa, and 111 kPa. Each pressure was applied for a total of 4 seconds in a randomized order, alternating between the two muscles. The child was asked to score the pain level at a VAS score with the same procedure as explained in Test 3.
Only one similar study has been conducted assessing stimulus–response functions, but it was conducted on adults
using a palpometer/pressure controlled palpation.14 In order
to replicate the area of second finger pulpa to produce results
comparable to that of the previous study, a 2 cm2 tip was used
on the algometer. The technique in the present study differs slightly in that an algometer was used instead of
pressure-controlled palpation used by Bendtsen et al.14 Furthermore,
in order to compare results we standardized the stimuli on the algometer to the palpometer pressures (80–200 AU). The two highest stimuli equivalents (180 and 200 AU) were withdrawn, as a pilot study showed that stimuli above 111 kPa were too painful for some of the children, and this was ethically unacceptable due to the participants’ ages.
The previous study conducted on adults showed that the relationship between force applied to the palpometer and palpometer output (AU) was linear in the range from 80–200 units, and that the range was equivalent to a force
range of 235–1550 g.21 The Somedic Algometer type II
out-put is kPa (1 kPa = 10.20 g/cm2). The stimulus intensities
in our study (23 kPa to 111 kPa) were equivalent to the five lowest palpometer pressure units (80–160 AU), as used in
Bendtsen et al’s experiment,14 whereas 80 palpometer units
was equivalent to 23 kPa, and the increase in force for each stimulation was 22 kPa, which equaled 20 AU. In studies of Dovepress
Soee et al
Journal of Pain Research downloaded from https://www.dovepress.com/ by 118.70.13.36 on 24-Aug-2020
pain perception in children, using methods that are available, replicable, and reliable is crucial in allowing the comparison of results from different scientific groups and countries. Because the palpometer is not easily available for future studies, the present study uses the Somedic Algometer type II (SBMEDIC Electronics). The same algometer was used for all subjects and was calibrated with a 100 kPA weight before each test day.
Study size
The sample size of 25 participants was arbitrarily selected, but was stated in the protocol before inclusion. Power cal-culations were not possible a priori, as this is the first study of its kind in children.
Statistical methods
SPSS version 20 (IBM Corporation, Armonk, NY, USA) com-puter software was used for data analysis. A statistician was consulted for statistical approval of the methods applied.
Data (TTS, PPT, VAS at SupraPPT, and AUC) are char-acterized by the mean and standard deviation (SD). AUC was calculated for each of the two test muscles (P2, P3) using the trapezoidal method.
Intrasession reliability in the PPT test from session 1 was assessed by Cronbach’s alpha. Cronbach’s alpha, which provides a lower bound of intrasession reliability and can attend values between 0 (no internal consistency) and 1 (perfect internal consistency), is used as a measure of reli-ability of a test score for a sample of examinees.23 In order to
improve reliability during the statistical analyses, the mean of the three trials in each PPT site was calculated and used in the further analysis of intersession reliability.
Intersession reliability of the different tests was assessed using the Pearson product-moment correlation coefficient. In general, Pearson’s r below 0.4 is considered to represent poor reliability. Values between 0.4 and 0.75 represent good reliability, and values above 0.75 represent excellent reliability.24 The
differ-ence between sessions 1 and 2 was calculated for each participant in the different tests. The difference mean (SD) represents the mean of the differences for all participants in each test.
In order to analyze the systematic difference between each
pair of measurements, a one-sample t-test at the differences
between the first and second sessions was calculated for the individual tests. We used the Benjamini–Hochberg method to correct for multiplicity in the one-sample t-tests. According to this correction, P, 0.0056 indicates a statistically significant systematic difference in the results. We judged the results in light of this corrected P-value.
Results
Participants
Twenty-five children aged 10.8 years (SD 1.9, range 8–14 years), 16 females and nine males, participated and completed the test–retest sessions. Sessions 1 and 2 were per-formed with a median of 21 days between them (interquartile range, 10.5–22, range 7–30).
Outcome data
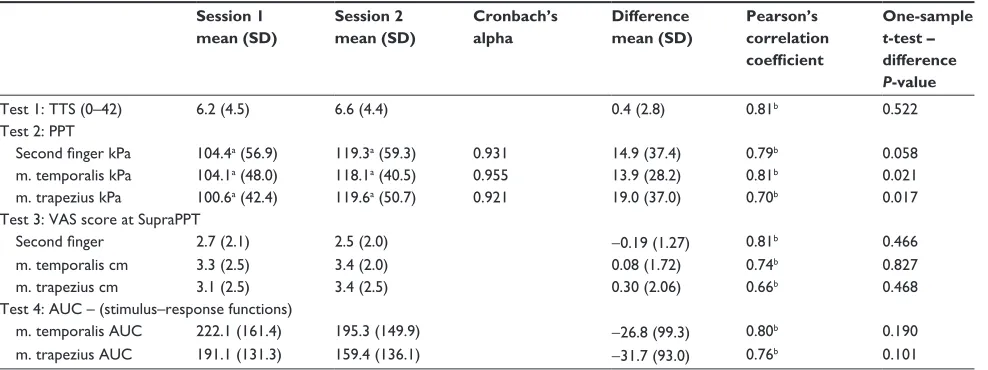
Data are presented in Table 2.
Intrasession reliability
The PPT test, the only test performed more than once on the same day, was repeated three times at the same site at 2 minute intervals. The test was precise and repeatable as the
Cronbach’s alpha (session 1) was $0.92 for all three sites
(second finger, m. temporalis, m. trapezius) (Table 2).
Intersession reliability
All calculated correlation coefficients were highly
statisti-cally significant (P , 0.001). The Benjamini–Hochberg
method to correct for multiplicity in the one-sample t-test did not show any indications of significant systematic differences in any of the tests (Table 2).
For test 1 (TTS), the correlation in TTS between the two different test days was excellent (r = 0.81).
For test 2 (PPT), the correlation was excellent in two of the three sites tested (second finger, r = 0.79; m. temporalis, r = 0.81), whereas the correlation was good in m. trapezius (r = 0.70).
For test 3 (VAS score at SupraPPT), the correlation was
excellent at the second finger (r = 0.81), but only moderate
in m. temporalis (r = 0.74) and m. trapezius (r = 0.66). For test 4 (AUC, stimulus–response functions for pressure versus pain), the correlation of AUC in both m. temporalis (r = 0.80) and m. trapezius (r = 0.76) was excellent.
Discussion
The present study indicates that TTS, PPT, VAS score at SupraPPT, and AUC (stimulus–response functions) are reli-able measurements in pain evaluation in healthy children of 8–14 years of age.
Intrasession reliability examined
at 2 minute intervals
PPT was measured three times at 2 minute intervals at the second finger, m. temporalis, and m. trapezius. The Cronbach’s
alpha was $0.92 at all three sites, which indicates that the
test is precise and repeatable. Children are able to define
Dovepress Reliability of pain tests in children
Journal of Pain Research downloaded from https://www.dovepress.com/ by 118.70.13.36 on 24-Aug-2020
their PPT very precisely and they are also capable of under-standing the procedure. However, low intrasession reliability could be expected if the child was confused and pressed the button when they felt it was expected of them, or if they just pressed it randomly when some pressure had been applied. Furthermore, the high Cronbach’s alpha indicates that the test is objective and standardized. Error in the instrument or method would induce bias and low repeatability. The only other study of PPT intrasession reliability in children was
conducted by Chaves et al,16 who found a moderate to
excel-lent intraclass correlation coefficient (0.65–0.81) in three consecutive measures of PPT in different masticatory muscles and in the right thenar region among 16 healthy children aged 7–12 years. The study was, however, smaller than the present study, and the researchers used a manual algometer (Kratos, model DDK-10, Kratos Ltd, Cotia, Sao Paulo, Brazil) with a different measurement technique, which might explain the lower reliability. In the present study, the examination lasted 30 minutes in total, which we assumed to be the upper limit of concentration in the participating children. We had to be selective about the tests used, which is why we did not asses the intrasession reliability of the other three tests.
Intersession reliability examined
on different days
To our knowledge, this study is the first to evaluate the intersession reliability of TTS, VAS score at SupraPPT, and
AUC (stimulus–response function for pressure versus pain) in children. In this study, the children showed excellent interses-sion reliability both in test 1 (TTS; r = 0.81) and test 4 (AUC; m. temporalis, r = 0.80; m. trapezius, r = 0.76).
In test 2 (PPT) and test 3 (VAS score at SupraPPT), however, the coefficients fell in the high range of the inter-val between a good correlation and an excellent correlation
(r = 0.66–0.81). These results are comparable with the PPT
intersession reliability found by Chaves et al.16,17 In adults,
TTS has proven to be a valid and reliable method for
measur-ing tenderness in pericranial structures.20 Furthermore, PPT
assessments in adults using an algometer were also found to be reliable.25,26 Since the body is a complex structure with
day-to-day fluctuations in tenderness and biological pro-cesses, the total correlation between sessions is beyond the bounds of possibility. We believe that the observed variances seen in our different tests are acceptable and expected.
Systematic differences can be introduced if all of the children are affected in some way at the first examination. Anxiety might induce decreased PPTs and increased VAS scores in the first session, if the children felt insecure and felt that they were not in a friendly environment. We did not find any significant systematic differences in any of the four tests between days.
Rater palpation pressure has previously been shown to
be stable from week to week.21 In order to standardize and
objectify the manual palpation pressure in the TTS test, the
Table 2 Measurements, intrasession and intersession reliability Session 1
mean (SD)
Session 2 mean (SD)
Cronbach’s alpha
Difference mean (SD)
Pearson’s correlation coefficient
One-sample
t-test – difference
P-value
Test 1: TTS (0–42) 6.2 (4.5) 6.6 (4.4) 0.4 (2.8) 0.81b 0.522
Test 2: PPT
Second finger kPa 104.4a (56.9) 119.3a (59.3) 0.931 14.9 (37.4) 0.79b 0.058
m. temporalis kPa 104.1a (48.0) 118.1a (40.5) 0.955 13.9 (28.2) 0.81b 0.021
m. trapezius kPa 100.6a (42.4) 119.6a (50.7) 0.921 19.0 (37.0) 0.70b 0.017
Test 3: VAS score at SupraPPT
Second finger 2.7 (2.1) 2.5 (2.0) -0.19 (1.27) 0.81b 0.466
m. temporalis cm 3.3 (2.5) 3.4 (2.0) 0.08 (1.72) 0.74b 0.827
m. trapezius cm 3.1 (2.5) 3.4 (2.5) 0.30 (2.06) 0.66b 0.468
Test 4: AUC – (stimulus–response functions)
m. temporalis AUC 222.1 (161.4) 195.3 (149.9) -26.8 (99.3) 0.80b 0.190
m. trapezius AUC 191.1 (131.3) 159.4 (136.1) -31.7 (93.0) 0.76b 0.101
Notes:aThe average of the three measurements on each test day; bP, 0.001. Results from Tests 1–4 in the first and second session are presented. Calculated in the first
session, Cronbach’s alfa is a measurement of the internal reliability of the individual test, ie, of the intrasession reliability. Difference mean (SD) represents the mean of the
difference initially calculated for each participant between sessions 1 and 2. Pearson’s correlation coefficient represents the intersession reliability of the different subtests.
The one-sample t-test tests the H0: diff = 0. According to the Benjamini–Hochberg correction for multiplicity, P , 0.0056 rejects H0: diff = 0 and indicates a statistically
significant systematic difference between sessions 1 and 2.
Abbreviations: SD, standard deviation; TTS, Total Tenderness Score; PPT, pressure pain threshold; VAS, Visual Analog Scale; SupraPPT, pressure pain threshold-adjusted suprathreshold; AUC, area under the curve.
Dovepress
Soee et al
Journal of Pain Research downloaded from https://www.dovepress.com/ by 118.70.13.36 on 24-Aug-2020
same rater was used throughout the study and trained in
applying a pressure of 120 AU using the same palpometer21
previously used in adult studies. Gender differences have been observed in measurements of PPT; however, we are not aware of data indicating gender differences in PPT
reliability.27 The sample size of 25 children in the present
study does not allow us to search for conclusions about gender differences among the four pain measurement tools.
The tests described in the current article may primarily be used for studying pain mechanisms in chronic pain disorders; however, one could imagine that the TTS might be used to determine the general craniocephalic tenderness of a child attending the clinic. The mean of the three trials in each PPT site was calculated and used in the further analysis of intersession reliability. In other studies, a similar procedure would have to be followed in order to achieve similar levels of reliability. At present, only very few studies of experi-mental pain measurement tests exist in children worldwide. The present study is, to our knowledge, the first for some of the measurement tools. However, the results of the present study are tentative due to the sample size. If the study had been more extensive, it would have been of great interest to determine the interrater reliability of the tests using a second rater on a third test day. Initially, we planned to examine all of the children with 14 days between, but practical difficul-ties in the available test days resulted in a variation in the number of days between tests. We believe that a longer test period might have decreased the reliability; however, we found moderate to excellent reliability in all tests. Finally, it was only the highly motivated children who participated, but we believe they represented the general population of schoolchildren, aged 8–14 years, in Denmark.
Conclusion
The present study indicates that pain measurement tools such as TTS, PPT, VAS score at SupraPPT, and AUC (stimulus– response functions for pressure versus pain) appear to be reliable measurements in pain evaluation in healthy children aged 8–14 years. However, given the small sample size, the conclusion needs to be confirmed in future studies.
Approval
Written informed consent was obtained from all participants. The study was approved by the local biomedical research ethics committee (H-D-2009-019) and the Danish Data Protection Agency (2009-41-3172).
Acknowledgments
We would like to thank the healthy children from the Sengeløse school and the Søndervang school who agreed to participate. We would also like to thank the Danish Headache Center, University Hospital of Copenhagen in Glostrup for providing the palpometer used in test 1. Finally, we would like to thank Professor Svend Kreiner at the Department of Biostatistics, University of Copenhagen for guidance in the statistical methods applied.
This work was supported by: the Lundbeck Foundation; the Dagmar Marshalls Foundation; the Master carpenter Jørgen Holm and wife Elisa F Hansen’s Memorial Trust; the Capital Region of Denmark; the Danish Headache Society; and the Torben Iversen’s Travelling Foundation.
Disclosure
The authors report no conflicts of interest in this work.
References
1. Andrasik F, Schwartz MS. Behavioral assessment and treatment of pediatric headache. Behav Modif. 2006;30(1):93–113.
2. Anttila P, Metsähonkala L, Aromaa M, et al. Determinants of tension-type headache in children. Cephalalgia. 2002;22(5):401–408. 3. Lewis DW, Gozzo YF, Avner MT. The “other” primary headaches in
children and adolescents. Pediatr Neurol. 2005;33(5):303–313. 4. Anttila P. Tension-type headache in childhood and adolescence. Lancet
Neurol. 2006;5(3):268–274.
5. Seshia SS, Abu-Arafeh I, Hershey AD. Tension-type headache in children: the Cinderella of headache disorders! Can J Neurol Sci. 2009;36(6):687–695.
6. Bendtsen L. Central sensitization in tension-type headache – possible pathophysiological mechanisms. Cephalalgia. 2000;20(5):486–508. 7. Anttila P, Metsähonkala L, Mikkelsson M, et al. Muscle tenderness
in pericranial and neck-shoulder region in children with headache. A controlled study. Cephalalgia. 2002;22(5):340–344.
8. Carlsson J. Tenderness of pericranial muscles in schoolchildren with headache. The Pain Clinic. 1996;9:49–56.
9. Fernández-Mayoralas DM, Fernández-de-las-Peñas C, Ortega-Santiago R, Ambite-Quesada S, Jiménez-García R, Fernández-Jaén A. Generalized mechanical nerve pain hypersensitivity in children with episodic tension-type headache. Pediatrics. 2010;126(1):e187–e194.
10. Fernández-de-Las-Peñas C, Fernández-Mayoralas DM, Ortega-Santiago R, Ambite-Quesada S, Gil-Crujera A, Fernández-Jaén A. Bilateral, wide-spread, mechanical pain sensitivity in children with frequent episodic tension-type headache suggesting impairment in central nociceptive processing. Cephalalgia. 2010;30(9):1049–1055.
11. Metsahonkala L, Anttila P, Laimi K, et al. Extracephalic tenderness and pressure pain threshold in children with headache. Eur J Pain. 2006;10(7):581–585.
12. Langemark M, Olesen J. Pericranial tenderness in tension headache. A blind, controlled study. Cephalalgia. 1987;7(4):249–255.
13. International Association for the Study of Pain – IASP Taxonomy [webpage on the Internet]. Seattle: International Association for the Study of Pain. Available from: http://www.iasp-pain.org/AM/Template. cfm?Section=Pain_Definitions. Accessed May 12, 2012.
14. Bendtsen L, Jensen R, Olesen J. Qualitatively altered nociception in chronic myofascial pain. Pain. 1996;65(2–3):259–264.
15. McMahon SB, Koltzenburg M. Wall and Melzack’s Textbook of Pain, 5th ed. London: Elsevier; 2006.
Dovepress Reliability of pain tests in children
Journal of Pain Research downloaded from https://www.dovepress.com/ by 118.70.13.36 on 24-Aug-2020
Journal of Pain Research
Publish your work in this journal
Submit your manuscript here: http://www.dovepress.com/journal-of-pain-research-journal The Journal of Pain Research is an international, peer-reviewed, open access, online journal that welcomes laboratory and clinical findings in the fields of pain research and the prevention and management of pain. Original research, reviews, symposium reports, hypoth-esis formation and commentaries are all considered for publication.
The manuscript management system is completely online and includes a very quick and fair peer-review system, which is all easy to use. Visit http://www.dovepress.com/testimonials.php to read real quotes from published authors.
16. Chaves TC, Nagamine HM, de Sousa LM, de Oliveira AS, Grossi DB. Intra- and interrater agreement of pressure pain threshold for masti-catory structures in children reporting orofacial pain related to tem-poromandibular disorders and symptom-free children. J Orofac Pain. 2007;21(2):133–142.
17. Chaves TC, Nagamine HM, de Sousa LM, de Oliveira AS, Grossi DB. Comparison between the reliability levels of manual palpation and pressure pain threshold in children who reported orofacial pain. Man Ther. 2010;15(5):508–512.
18. Wahlund K, List T, Dworkin SF. Temporomandibular disorders in chil-dren and adolescents: reliability of a questionnaire, clinical examination, and diagnosis. J Orofac Pain. 1998;12(1):42–51.
19. Fillingim RB. Individual differences in pain responses. Curr Rheumatol Rep. 2005;7(5):342–347.
20. Bendtsen L, Jensen R, Jensen NK, Olesen J. Pressure-controlled palpation: a new technique which increases the reliability of manual palpation. Cephalalgia. 1995;15(3):205–210.
21. Bendtsen L, Jensen R, Jensen NK, Olesen J. Muscle palpation with controlled finger pressure: new equipment for the study of tender myofascial tissues. Pain. 1994;59(2):235–239.
22. Algometer [product information]. Solna, Sweden: SBMEDIC Electron-ics. Available from: http://www.sbmedic.se/pdf/ALGOMETER%20 TYPE%20II_EN.pdf. Accessed August 15, 2012.
23. Bland JM, Altman DG. Cronbach’s alpha. BMJ. 1997;314(7080):572. 24. Fleiss JL. The Design and Analysis of Clinical Experiments. New York:
John Wiley and sons Inc; 1986.
25. Nussbaum EL, Downes L. Reliability of clinical pressure-pain algometric measurements obtained on consecutive days. Phys Ther. 1998;78(2):160–169.
26. Persson AL, Brogårdh C, Sjölund BH. Tender or not tender: test–retest repeatability of pressure pain thresholds in the trapezius and deltoid muscles of healthy women. J Rehabil Med. 2004;36(1):17–27. 27. Chesterton LS, Barlas P, Foster NE, Baxter GD, Wright CC. Gender
differences in pressure pain threshold in healthy humans. Pain. 2003;101(3):259–266.
Dovepress
Dovepress
Soee et al
Journal of Pain Research downloaded from https://www.dovepress.com/ by 118.70.13.36 on 24-Aug-2020