To Study of Scheduling and Implementation
Using Traditional and Primavera Approach of
Building
Saurabh Jain, Samkit Gandhi, Shreyans Agrawal, Laukik Parakh, Prof. V. P.Kulkarni
B.E Students, Department of Civil Engineering, Amrutvahini College of Engineering Sangamner, Ahmednagar,
Savitribai Phule Pune University Pune, India
Professor, Department of Civil Engineering, Amrutvahini College of Engineering Sangamner, Ahmednagar, Savitribai
Phule Pune University Pune, India
ABSTRACT: Extend observing and control is the way toward gathering, recording, and revealing data concerning venture execution. Extend controlling utilizations the information from screen action to convey real execution to arranged execution. The present review manages the venture observing procedure of a ten storeyed (G+9) building whose development is in advance at Tathawde, Pune. A correlation between the arranged advance of development work and real advance is performed in this review utilizing venture administration programming Primavera P6. Regardless of entrenched standards and approaches of venture observing the procedure itself may not be productively expert in a venture, due to those down to earth issues existing or emerging in the projectSuch an endeavor in understanding the handy issues in execution of venture checking and control will add to appropriate acknowledgment of the issue ranges and setting up the control procedure to amend the deviations.
KEYWORDS: Planning, Scheduling, Project Planning Software, Primavera.
I. INTRODUCTION
TABLE I. CASE STUDY DETAILS
Name of the Building: Sai Apartment
Description: Building
Address: Tathawade Pune. 411033 MH, INDIA.
Society Name: SaiApartment
Main steps involved in factory construction work apart from initial planning are 1. Mobilisation
2. Piling
3. Column& beam concreting 4. Slab & stair concreting 5. Post concreting works 6. Masonry work 7. Plastering 8. Flooring, dado
9. External wall plastering 10.Finishing
II. METHODOLOGY OF MONITORING THE PROJECT WITH PRIMAVERA
The construction projects have become so vast and complex that the application of information technology has become inevitable. Companies started developing softwares for project management such as Primavera P6, P3, Suretrack, MS project, etc.
This study involves monitoring and controlling the project using Primavera P6. The progress at site must be incorporated in the Primavera schedule and updated. These updates needs to be thoroughly monitored using Primavera. Tools and techniques involved in this process are:
Earned value management (EVM)
Earned value management is a commonly used method ofperformance measurement. It integrates scope, cost, and schedule measures to help the project management team assess and measure project performance and progress. This technique requires the formation of an integrated baseline against which performance is measured for the duration of the project. This can be effectively done in Primavera.The project performance baseline is used to measure, monitor, and control overall cost performance on the project.
Work performance measurements
The calculated cost variance, schedule variance, CPI, values for WBS components, in particular the work packages and control accounts, needs to be documented and communicated to stakeholders.
Steps involved in monitoring and control of this project are 1) Creating an ideal schedule
2) Enterprise project structure (EPS)
Create the structure of the company with its branches, which is executing the project. This is known as Enterprise project structure (EPS).
3) Organizational breakdown structure (OBS)
After the EPS, OBS is created which is a hierarchy that reflects the persons responsible for theprojects in the enterprise.
4) Creating new projects
A project is a set of activities and associated information that constitutes a plan for creating a product or service. The project is created under the respective divisions in EPS and assigned the person in charge from OBS to it. The project can be given planned start and must finish dates. The project is assigned a calendar which can be global, resource or project calendar.
5) Work breakdown structure (WBS)
WBS is a hierarchy of work that must be accomplished to complete a project. Each project has its own WBS hierarchy with top level WBS element being equal to that of each EPS node or project. Each WBS element may contain more detailed WBS levels, activities, or both.
6) Defining activities
Activities are the fundamental work elements of a project and form the lowest level of a WBS and, are the smallest subdivision of a project. An activity has the following characteristics like activity ID, name, start and finish dates, activity calendar, activity type, activity codes, constraints, expenses, predecessor and successor relationships, resources, roles etc.
7) Relationship between activities
To from a network, the activities should be connected to each other, which is done by assigning preceding and succeeding activities with significant relationship to the activities.
8) Determining activity duration
When planning the work, the duration is entered in the original duration field. The actual duration can only be entered for the activities, which are completed.
9) Activity dates
The following are the types of activity dates available in the primavera; actual start, actual finish, planned start, planned finish.
10) Activity cost
The activity cost is the sum of all the cost incurred to complete the activity.
11) Creating baselines
A simple baseline plan is a complete copyof the original schedule which provides a target against which a project’s performance is tracked.
12) Updating schedule
If the project is progressing exactly as planned, then only needed to estimate progress.
If the project is not progressing as planned many activities are starting out-of-sequence, actual resource use is exceeding planned use, and then update should be done for activities and resources individually.
13) Tracking
Tracking window is used for monitoring a project’s progress using different types of layoutssuch as labour costs, project cost, resource forecasting, resource allocation unit wise and cost wise.
14) Earned value
Earned value is a technique for measuring project performance according to both project cost and schedule. The technique compares the budgeted cost of the work to the actual cost.
15) Claim digger
The claim digger is a schedule analysis tool that enables a company to generate a report that compares selected data fields in a revised project and a corresponding baseline.
16) Project thresholds
Project thresholds consist of parameters assigned to WBS elements; they are used to monitor projectsand generate issues.
17) Project issues
Project issues are the problems within a schedule that must be addressed before the project can be completed. They can either be created by thresholds or manually.
Preliminary steps to be done in updating
Choose project. Maintain baseline. Then add and save a copy of current project as a new baseline B1. Then choose projectbaseline as B1 and assign primary baseline as B1.
Daily updates to be made:
a) Start date and end date
Choose the activity to be updated. Then in the activity details window, select status tab. Then tick mark started if the activity has been started and select the date. Tick mark finished if the activity has been finished and select the finish date.
b) Resource
In activity details window, select resource tab. Then select the resources which are to be added to the particular activity
c) Code
In activity details window, select code tab. Then select the activity code for each resource.
d) Notebook
In activity details window, select notebook tab. Select the topic which we want to note and write the details in notebook topic.
e) Steps
In activity details window, select steps tab. Then if the activity has any steps update the activity in percentage complete and put a tick mark if the activity has been completed.
f) Feedback
g) Work products and documents (WPs & Docs)
In activity details window, select the WPs & Docs tab. Then the drawings, documents, specifications have to be uploaded here.
Weekly updates to be made:
a) Threshold
In directory bar choose threshold tab. Then 3 variances are to be monitored regularly; finished date variance, start date variance and cost variance.
b) Issues
In directory bar choose project issues. The values which fall outside the threshold values are indicated in the issues. Contractor also has to add issues if there are any.
c) Reports
Choose tools. Then choose the data date which we want to update the progress. All the activities done in that week has to be selected. Then select update progress.
Schedule analysis and forecasting
Schedule variance (SV)
It determines whether a project is behind or ahead of the schedule. It is calculated by subtracting planned value from the earned value.
Schedule variance = Earned value (EV) -Planned value (PV)
The Schedule Variance can be expressed as a percentage by dividing the schedule variance (SV) by the planned value (PV):
SV% = SV / PV
Schedule performance index (SPI)
It indicates efficiency with which the project team is using its time.
Schedule performance index = Earned value / Planned value
Time estimate at completion {EAC(t)}
We can generate a rough estimate of when project will be completed
Estimate at complete {EAC(t)} = (BAC/SPI)/ (BAC/months)
BAC = Budget at completion
Cost analysis and forecasting
Cost variance (CV)
It shows whether a project is under or over budget.
Cost variance (CV) = Earned value (EV) - Actual cost (AC)
This number can be expressed as a percentage by dividing the cost variance (CV) by the earned value (EV). CV% = CV / EV
It is one of the clearest indicators of the cumulative cost efficiency of the project.
Cost performance index (CPI) = Earned value (EV) / Actual cost (AC)
III. RESULTS AND DISCUSSIONS Ideal baseline for Project
An ideal baseline B1 was created in Primavera for the this case study. The work breakdown structure, activities and steps for activities are being discussed here. The structure for the baseline is presented from the WBS levels. In WBS a level may be again sub divided. Activities come under the WBS.
Gantt chart
1.The time scale of the Gantt chart should be weekly basis. 2.All relationships should be clearly given in the Gantt chart.
Fig.1 Gantt chart window(Source: Google)
Calendar
The work is carried out in 6 days per week. So the standard 6 day workweek calendar is made with necessary holidays in it.
A break of one hour is given in the afternoon.
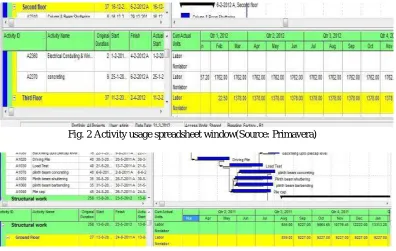
Activity usage spreadsheet and resource usage spreadsheet
Fig. 2 Activity usage spreadsheet window(Source: Primavera)
Fig. 3 Resource usage spreadsheet window(Source: Primavera)
Activity usage profile and resource usage profile
These show graphical representation of cumulative values activity usage and resource usage at any stage of the construction project. This is based on classic WBS layout.
Fig. 5 Resource usage profile window(Source: Primavera)
Based on the guidelines from literature review and methodology described, it was possible to monitor the progress of this construction project. Till now we have gone through step by step procedure followed in monitoring the project using Primavera P6. The numerical results obtained after following the previously mentioned methodology is discussed in the following sections.
Master schedule with key dates
A schedule is being created using the key dates of the activities. The baseline project start date is on 9th March 2016 and baseline project finish date is on 12th July 2018. The actual start of project was on 15th March 2016. It shows that the actual start of project was as per baseline schedule. After knowing the dates of all key activities, all the constituent activities are arranged sequentially and logically to form a schedule. This schedule shows a slow and ever increasing gap between baseline schedule and actual work progress. The actual progress started shifting from planned schedule, from the second activity mobilisation of resources itself.
Resource assignments and usage
The resource assignment window shows all the resource assignments, grouped by resource for the project. An approximate rate analysis was done to arrive at rates of individual resource groups, considering the various component resources. Most of the resources are taken as material. Machines are taken as non–labour and human involvement is listed as labour.
The resource usage profile obtained using Primavera P6 shows that there has been a slight variation in the quantity of each resource used during the project life cycle.
Tracking of the Project
Threshold calculation
The parameter which is checked in the threshold is start day variance and finish day variance for the started activities. Threshold calculation of the factory project shows that 88 activities show start date variance and 88 activities show finish date variance. All these thresholds which fall outside are reported as issues. Hence 88 issues are identified for finish date variance and 88 issues are identified for start date variance.
Delay analysis
The following reasons were observed during this thesis work, which can be held responsible for delays;
Lack of knowledge about advanced tracking methods and softwares.
Insufficiently skilled staff.
Lack of proper fund flow throughout the project progress
A major portion of labour force was from West Bengal and Orissa. Regional festivals in these areas cause sudden delays in work progress.
Even though delay due to monsoon rain was already accounted in the baseline schedule, unexpected extension of monsoon caused further delay in project progress.
Sand unavailability due to legal restrictions.
Late delivery of resources.
Comparison of revised project schedule with baseline using claim digger
The revised project is compared with the baseline of the project. The output of Claim digger shows that 43 WBS have been added to and 45 WBS have been deleted from the project.
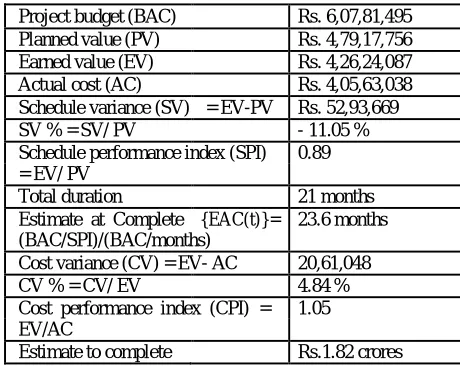
Earned value analysis
The earned value of the work has been calculated after including the actual cost of each activity inclusive of expenditures. The following details were obtained from calculations using data obtained from Primavera P6
TABLE II. RESULTS OBTAINED FROM PRIMAVERA
Project budget (BAC) Rs. 6,07,81,495 Planned value (PV) Rs. 4,79,17,756 Earned value (EV) Rs. 4,26,24,087 Actual cost (AC) Rs. 4,05,63,038 Schedule variance (SV) = EV-PV Rs. 52,93,669
SV % = SV/ PV - 11.05 %
Schedule performance index (SPI) 0.89 = EV/ PV
Total duration 21 months
Estimate at Complete {EAC(t)}= 23.6 months (BAC/SPI)/(BAC/months)
Cost variance (CV) = EV- AC 20,61,048
CV % = CV/ EV 4.84 %
Cost performance index (CPI) = 1.05 EV/AC
S Curve
It is graphical representation of financial cash flow of a project. It is derived from activity usage profile, and it shows an “S” like shape, flatter at the beginning and end and steeper in the middle. This shows that costs involved in the project is low in the beginning as well as in the end, whereas it increases at a rapid rate when the project is in its middle stage.
Fig.6 S-curve of this project(Source: Primavera)
System-IV.CONCLUSIONS
The fundamental target of this review was to comprehend the part of observing and control in the advance and opportune consummation of a development extend. This goal was accomplished through update of writings and techniques required in checking and control. The contextual analysis turned out to be a rule in understanding the advance of this development work and furthermore to distinguish the particular issues emerging amid the procedure. Consequences of this review demonstrate the disadvantages of the present venture administration framework in this venture and the significance productive arranging, observing and controlling, and additionally the need and adequacy of venture administration programming like Primavera P6 in a development extend.
REFERENCES
1. Satinder Chopra “Developing an Efficient Schedule in Primavera P6: Significance of Activity ID & Descriptions” International Journal of Innovative Research in Science, Engineering and Technology (An ISO 3297: 2007 Certified Organization) Vol. 3, Issue 7, July 2014.
2. RAJ SARAN “PLANNING AND SCHEDULING OF A TWO STOREY BUILDING USING PRIMAVERA P6” Proceedings of 26th IRF International Conference, 12th June, 2016, Bengaluru, India, ISBN: 978-93-86083-38-8
3. S M Abdul MannanHussain “SCHEDULING OF AN RESIDENTIAL BUILDING USING PROJECT MANAGEMENT TECHNIQUES”
IJARSE March 2017.
4. Lekshmi A L “Work Breakdown Structure Scheduling for Repetitive Construction Projects with Soft Logics” International Journal of Science and Research (IJSR) ISSN (Online): 2319-7064 Index Copernicus Value (2015): 78.96 | Impact Factor (2015): 6.391
5. P.Arunadhevi “Optimization of Construction Project Scheduling by International Journal of Advanced Research Trends in Engineering and Technology (IJARTET) Vol. 3, Special Issue 2, March 2016Using Linear Programming”
6. Ch. Chowdeswari “OPTIMAL PLANNING AND SCHEDULING OF HIGH RISE BUILDINGS” International Journal of Civil Engineering and Technology (IJCIET) Volume 8, Issue 1, January 2017, pp. 312–324, Article ID: IJCIET_08_01_035
7. Mohamed Abd El razek “RISK FACTORS IN CONSTRUCTION PROJECTS CASH-FLOW ANALYSIS” IJCSI International Journal of Computer Science Issues, Vol. 11, Issue 1, No 2, January 2014 ISSN (Print): 1694-0814 | ISSN (Online): 1694-0784
8. SushantPradhan “PLANNING, SCHEDULING AND RESOURCE OPTIMISATION OF MULTIPLE PROJECTS USING ORACLE
PRIMAVERA P6” IJRET: International Journal of Research in Engineering and Technology eISSN: 2319-1163 | pISSN: 2321-7308
9. SUNIL SHARMA “Transportation Project Planning and Modeling” Recent Researches in Circuits, Systems, Mechanics and Transportation Systems
10. Arthur W T Leung “SCHEDULING FOR HIGH-RISE BUILDING CONSTRUCTION USING SIMULATION TECHNIQUES” Department