HO, PHU NGUYEN. Intelligent Energy Distribution for Series PHEVs Using Optimal Driving Patterns Determined via a Genetic Algorithm. (Under the direction of Dr. Eric Klang.)
This research introduces an intelligent energy distribution scheme for series Plug-in Hybrid Electric Vehicles (PHEVs) that incorporates the complexity of human driving behavior. Hybrid Electric Vehicles (HEVs) have been shown to improve fuel economy, reduce vehicle emissions and maintain drivability by incorporating electric motors into the drivetrain and a battery as a secondary power source. HEVs ability to meet driver demands by distributing load through multiple power sources yields significant benefits over conventional Internal Combustion Engine (ICE) vehicles. However, due to the highly complex system design and vehicle architecture of hybrid vehicles, sophisticated Energy Management Strategies (EMS) are required to optimize vehicle performance. Currently, the power management system for HEVs is based on static thresholds optimized on a fixed drive cycle for a given vehicle.
Intelligent Energy Distribution for Series PHEVs Using Optimal Driving Patterns Determined via a Genetic Algorithm
by Phu Nguyen Ho
A dissertation submitted to the Graduate Faculty of North Carolina State University
in partial fulfillment of the requirements for the Degree of
Doctor of Philosophy
Mechanical Engineering
Raleigh, North Carolina 2013
APPROVED BY:
_______________________________ ______________________________ Dr. Eric Klang Dr. James Rigsbee
Chair of Advisory Committee
DEDICATION
BIOGRAPHY
Phu Nguyen Ho’s academic interests include the energy efficiency of dynamic systems, model reduction, embedded systems, system optimization, motorsports and advanced materials. His current research focuses on intelligent energy distribution for series hybrid electric vehicles using optimal driving patterns determined via a genetic algorithm. His fascination in motorsports and embedded systems have steered him into automotive research and development, with three years as a senior technical contributor for Wolfpack Motorsports, a university-sponsored formula SAE racing team.
ACKNOWLEDGMENTS
TABLEOFCONTENTS
LIST OF TABLES ... vii
LIST OF FIGURES ...viii
NOMENCLATURE ... x
Chapter 1 Introduction ... 1
1.1 Research Motivation ... 5
1.2 Problem Statement ... 7
Chapter 2 Literature Review ... 9
2.1 Topics Pertaining to Vehicle Efficiency ... 10
2.2 Topics Pertaining to Control Strategy ... 16
2.3 Topics Pertaining to Vehicle Communication... 27
2.4 Summary ... 33
Chapter 3 Model-based Determination of Optimal Driving Patterns (Part 1) ... 35
3.1 Experimental Setup... 36
3.2 Optimization Objective ... 38
3.3 Mathematical Formulation ... 39
3.5 Distance Sensitivity ... 43
3.6 Conclusion ... 44
Chapter 4 Adaptive Control Strategy Development (Part 2) ... 46
4.1 Control Strategy ... 48
4.2 Simulink Model ... 50
4.3 Controller Parameter Tuning ... 53
4.4 Results & Discussion ... 65
4.5 Conclusion ... 72
Chapter 5 Vehicle Communication ... 73
5.1 Creating CAN message in Simulink ... 75
Chapter 6 Concluding Remarks ... 80
6.1 Future Work ... 81
REFERENCES ... 82
APPENDIX ... 89
Appendix ASimulink/ADVISOR ... 90
Appendix BLumped Capacitance ... 94
LIST OF TABLES
Table 3.1: GM Ecotec engine parameters used in this experiment... 36
Table 3.2: Fuel consumptions comparison for GA determined driving patterns and EPA drive cycles... 42
Table 4.1: 2013 Chevrolet vehicle data and components used in ADVISOR simulations... 47
Table 4.2: Bandwidth parameter for driving modes 1 and 2 effect on fuel economy. ... 61
Table 4.3: Final design parameters for the adaptive control strategy. ... 65
LIST OFFIGURES
Figure 2.1: Sample GA bit encoding and crossover adapted from Holland 1992. ... 12
Figure 2.2: Genetic algorithm optimization scheme. ... 13
Figure 2.3: CAN data frame adapted from Bosch GmbH 1991. ... 29
Figure 2.4: CAN devices and bus termination on both ends. ... 30
Figure 2.5: Mototron engine control module (Woodward 2011). ... 31
Figure 2.6: MicroAutoBoxII 1401/1501 with connector (dSPACE 2011). ... 32
Figure 3.1: Experimental GM Ecotec 2.0L supercharged engine setup with dynamometer and data acquisition system. ... 37
Figure 3.2: Experimental GM Ecotec engine fuel flow rate at 100 percent engine load. ... 37
Figure 3.3: GA optimal driving pattern for city scenario with the lowest fuel consumption. 41 Figure 3.4: GA optimal pattern for highway scenario with the lowest fuel consumption. ... 42
Figure 3.5: Distance traveled effect on vehicle fuel economy for the city scenario. ... 43
Figure 3.6: Distance traveled effect on vehicle fuel economy for the highway scenario. ... 44
Figure 4.1: (a) Power required for traction motor vs. vehicle speed (b) ESS SOC vs. vehicle speed. ... 49
Figure 4.3: Adaptive control strategy Subsystem_lo block. ... 52
Figure 4.4: Zero effects on ESS performance with = 0.95 and = 0.2. ... 54
Figure 4.5: Pole effects on ESS performance with = 0.74 and = 0.2. ... 56
Figure 4.6: Gain parameter for the lag controller with = 0.74 and = 0.95. ... 57
Figure 4.7: US06 (x15) drive cycle with lag controller as designed. ... 59
Figure 4.8: SOC performance for four selected bandwidth combinations. ... 62
Figure 4.9: Upper and lower limits ratio effect on SOC for US06 (x1.5) drive cycle. ... 64
Figure 4.10: Adaptive SOC for US06 drive cycle (a) vehicle speed (b) ESS SOC with newly defined upper and lower limits in blue and red, respectively (c) generator power (d) ESS current. ... 67
Figure 4.11: US06 (x15) drive cycle with adaptive SOC bonds and without control (a) SOC and (b) generator power. ... 69
Figure 4.12: ESS temperature rise for adaptive control and without control during US06x15 drive cycle. ... 71
Figure 5.1: Vehicle model with input, output and supervisory controller. ... 74
Figure 5.2: ESS state-of-charge from the BCM on the CAN bus in Simulink. ... 77
NOMENCLATURE
= alternating current
= Advanced Vehicle Simulator = artificial neural network = battery control module
= controller area network = charge depleting
= charge sustaining = distance
= direct current
= degree of hybridization = engine control unit
= resistance heating
= energy management strategies = environmental protection agency
= energy storage system
= fuel consumption objective function = objective function
= genetic algorithm = lag controller
= distance constraints = constraints
= hybrid electric vehicle = high speed CAN
= high voltage
= overall transmission ratio = electric current
= internal combustion engine = lag controller gain value ̇ = mass fuel flow rate = mile per gallon
̇ = mass fuel flow rate at vehicle speed = engine speed
= rated power for electric traction motor
= plug-in hybrid electric vehicle
= rated power for internal combustion engine
= effective tire radius = electrical resistance = state of charge = state of health
= vehicle speed
Chapter 1
Introduction
The high demand for alternative energies has led to the emergence of Hybrid Electric Vehicles (HEVs) in the automotive industry. HEVs have been shown to have improved fuel economy and reduced vehicle emissions, while maintaining drivability. This efficiency is achieved by incorporating electric motors into the drivetrain and a battery as a secondary power source. The HEV’s ability to meet driver demands by distributing load through multiple power sources yields significant benefits over conventional Internal Combustion Engine (ICE) vehicles. With the added complexity of the Energy Storage System (ESS) and other subsystems in HEVs more advanced control strategies are required to manage the energy distribution between multiple energy sources. Yet, to date, there is no past research on improving vehicle fuel efficiency that considers an adaptive control strategy for series Plug-in Hybrid Electric Vehicles (PHEVs) usPlug-ing optimal drivPlug-ing patterns determPlug-ined via a genetic algorithm.
methodologies. Micro-hybrid vehicles with auto-start-stop based on the conventional 14V electrical system with brake energy regeneration have been shown to reduce fuel consumption by three percent (Shaeck et al. 2009). Others have studied advanced control strategies using optimization methods such as the stochastic fuzzy controller, artificial neural networks and genetic algorithms to maintain vehicle performance and reduce fuel consumption (Junghwan et al. 2010; Paladini et al. 2007). Barsali et al. (2004) proposed an algorithm to reduce fuel consumption (1.6-5%) for HEVs through the forecasting of future vehicle load. Other researchers have looked at on-board estimation of the State-of-Charge (SOC) using methods such as equivalent resistor-capacitor circuits and extended Kalman filters to estimate the battery state of health; all aiming to better control the energy distribution for HEVs (Hu et al. 2011; Junghwan et al. 2010; Plett 2004). Nonetheless, while employing complex control algorithms which are known to improve the fuel economy of passenger cars, it is critical to understand how driving styles can affect fuel economy to improve vehicle efficiency.
feedback to the driver and provide speed limitations, they are mainly designed for safety and comfort (Saerens et al. 2009). A clear understanding of driving patterns can lead to better understanding of real-world vehicle performance and ultimately a more efficient vehicle control strategy.
One tool that can help understand driving patterns is the Genetic Algorithm (GA). In recent years, GAs have become a popular optimization tool for many areas of research, including automotive engineering. Researchers in electrical and mechanical engineering have shown that GAs provide effective solutions to complex problems such as the traveling salesman, engine parameters optimization and active suspension control for vehicles (Chiou and Liu 2009; Fujita et al. 1998; Moon et al. 2002). The present research introduces an intelligent energy distribution scheme for series PHEVs by using optimal driving patterns determined via a genetic algorithm to improve fuel economy. The remainder of this manuscript will be arranged into two main parts to help organize the flow of this research:
Part 1 - Model-based determination of optimal driving patterns via a genetic algorithm
driving patterns, which will allow us to develop an adaptive control strategy for a series PHEV that improves vehicle fuel efficiency.
Part 2 – Adaptive control strategy development for series PHEVs
Chapter 4 introduces an adaptive control strategy for series PHEVs, which is derived from the optimal driving patterns obtained in Part 1. The aim is to reduce fuel consumption while maintaining the system’s integrity by adjusting the energy distribution between the ICE and ESS for a series PHEV. The adaptive control strategy is modeled in Simulink and integrated in Advanced Vehicle Simulator (ADVISOR) via MATLAB to evaluate different aspects pertaining to the vehicle performance over a drive cycle.
Further, Chapter 4 evaluates the design of the adaptive control strategy, and the parameters are tuned to meet the desirable performance for a series PHEV. Three parameters are considered: lag controller design, bandwidth parameter, and upper and lower limits ratio, which allows us to see how it affects the ESS SOC and discharge rate. The best performing combination parameters are selected based on the design target and desirable characteristics of the SOC for the ESS.
1.1 Research Motivation
The motivation of this research is to develop a successful and robust control algorithm to reduce fuel consumption while maintaining vehicle performance and consumer acceptability. To this aim, this research focuses on creating an adaptive control strategy for a series PHEV using determined optimal driving patterns to improve vehicle efficiency. With this framework, the control strategy can be integrated with the existing communication platform (Controller Area Network) in the vehicle with minimal additional computational expense.
HEVs have been shown to have improved fuel economy and reduced vehicle emissions, while maintaining drivability by incorporating electric motors into the drivetrain and a battery as a secondary power source. While parallel and series-parallel HEVs have been well studied for power-splitting, series HEVs remain a challenge at highway speeds due to the inherent nature of low torque of electric machines when operating at high speeds (Zeraoulia et al. 2006).
For this research, a series PHEV is selected as the vehicle architecture, which has the simplest powertrain configuration among different hybrid vehicles. Most beneficial is the ability to operate the ICE at the most efficient point to deliver electric power via the generator to the traction motor or to charge the battery.
1.2 Problem Statement
Modern automobiles have evolved into complex mechanical and digital systems that require advanced control strategies to function adequately. Further, the complexity of the recently introduced hybrid vehicle requires an innovative way to obtain greatest efficiency in a system that distributes power requirements across multiple power sources. However, current control strategies with static thresholds may limit the maximum potential of vehicle fuel efficiency. Yet, to date, there is no past research on improving vehicle fuel efficiency that considers an adaptive control strategy for series PHEVs using determined optimal driving patterns via a GA. This research aims to reduce fuel consumption while maintaining vehicle performance through an adaptive control strategy for series PHEVs using optimal driving patterns determined via a GA.
With this in mind, and in order to derive an effective control strategy, it is essential to have insight into individuals’ driving patterns (time and speed) along with the power requirements of the electric traction motor. These driving patterns will allow us to determine the vehicle speeds that are least efficient for a series PHEV, and determine how to govern the ICE active state. In this research, the adaptive control strategy is modeled in Simulink in the MATLAB environment, which is the de facto design platform in the Control Engineering community, and integrated in ADVISOR (Gladwin et al. 2009). The following aspects will be addressed in this research:
Chapter 2
Literature
Review
This chapter provides a brief literature review on the topics of interest pertaining to this research. The chapter is divided into three sections covering topics including vehicle efficiency, controls strategy, and vehicle communication as follows:
Section 2.1 covers topics pertaining to Part 1 of this research regarding the model-based determination of driving patterns. It addresses the current research in vehicle efficiency and optimization methods. Additionally, Section 2.1 discusses state-of-the-art optimization methods such as GAs and ANNs used to optimize vehicle parameters and control algorithms for vehicle efficiency.
Section 2.2 covers topics pertaining to Part 2 of this research which deals with the control strategy development for a series PHEV. There, the basics of HEVs along with current research to improve vehicle efficiency are considered. Additionally, the current optimization methods for improve HEVs efficiency will be discussed as well as the importance of the ESS and thermal characteristics in HEVs application.
micro-controller used by the NCSU EcoCAR2 team for implementing advanced control algorithms. In addition, the serial communication Controller Area Network (CAN) protocol will be discussed.
2.1 Topics Pertaining to Vehicle Efficiency
As environmental concerns continue to increase, it is imperative to improve fuel efficiency in today’s automobiles while maintaining drivability and reducing vehicle emissions (Michalek et al. 2004). Currently, smaller vehicles, including hybrid electric and electric vehicles, are seen as key to the goal of improving fuel economy and lowering greenhouse gases. In this direction, many of the developers of these vehicles have used strategies that focus on altering physical vehicle parameters such as engine downsizing, components optimization and complex control strategies, while research on individual driving styles has received little attention.
Varesi and Randan (2011) proposed a method to optimize the Degree of Hybridization (DOH) and battery sizing for a parallel HEV using a GA to improve vehicle performance. Others have demonstrated that the use of advanced optimization methods through complex control algorithms, and Artificial Neural Networks (ANNs) to optimize engine parameters including intake runner length, cam phasing and air/fuel ratio can increase efficiency (Wu et al. 2005; Zhao et al. 2011).
These algorithms are seen in the use of multi spray angle fuel injection, dynamics stability controls and even crash detection (Hannan et al. 2008; Hou et al. 2011; Schicbahn et al. 2008). Complex control algorithms in hybrid vehicles have been shown to increase fuel economy, reduce vehicle emissions and maintain drivability by adjusting the energy balance between the ESS and the ICE (Ho and Klang 2013; Hu et al. 2010; Junghwan et al. 2010; Paladini et al. 2007). It is well established that advanced control strategies such as stochastic fuzzy logic controls, ANNs and GAs are shown to improve vehicle performance and reduce fuel consumption (Junghwan et al. 2010; Paladini et al. 2007).
Genetic algorithms (GAs) have been used to solve complex engineering problems across a wide range of disciplines. Researchers have shown that GAs provide effective solutions to complex problems such as the traveling salesman, engine parameter optimization and active control suspension for vehicles (Chiou and Liu 2009; Fujita et al. 1998; Moon et al. 2002). GAs are powerful optimization schemes which mimic the basic biological mechanisms of reproduction and “survival of the fittest” (Chiou and Liu 2009).
The genetic algorithm is different from the conventional optimization methods in that it starts with an initial set of random solutions called a population (Gen and Cheng 1997). Each individual in the population is a chromosome, which represents a solution to the problem (Gen and Cheng 1997). A population is assigned based on the non-dominated sorting technique to preserve diversity among solutions (Deb et al. 2002).
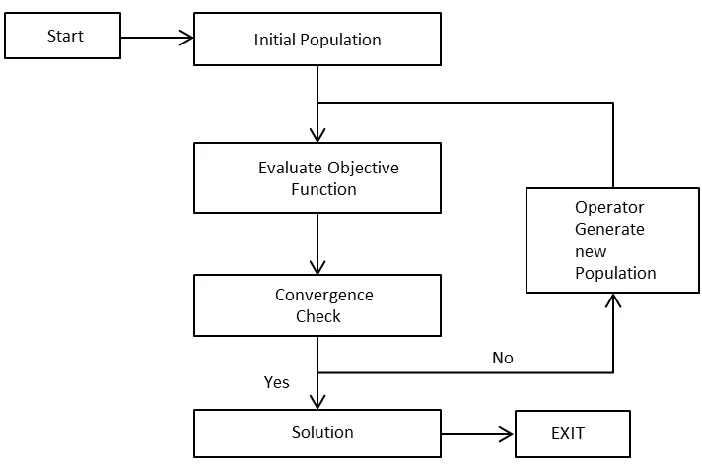
Figure 2.1 illustrates a bit encoding with a single point crossover for a sample set of a GA solutions (adapted from Holland 1992). The parent solutions (represented in all white or gray) are used to create new children (solutions) that contain parts of both parents. The new solutions are then used in an iterative process with operation such as crossover and mutation to arrive at the optimal solutions. The optimization begins by evaluating the fitness function with the set of the initial population. Then convergence criteria are checked to see if the solutions are optimal solutions. If the convergence criteria are not satisfied, then, genetic operators are applied to find a new set of solutions to carry on to the next generation and the process repeats until the convergence criterion is met (Karen et al. 2006). Figure 2.2 shows a flow diagram of a typical GA optimization scheme.
While the process is randomized, it efficiently exploits historical information to speculate on new search points with expected improved performance of the solution (Goldberg 1953). A larger set of initial populations would likely yield a good global optimum solution. In contrast, a smaller population might not have enough good information for reproduction and can produce a suboptimal solution. Hence the trade off—a large population would require more computing time, which could be more expensive.
One advantage of GAs is the stochastic nature of this optimization process to arrive at the optimal solution. The random assignment of solutions or genes to arrive at the best fitness values over different generations allows for diversity among solutions. Operators such as crossover and mutation allows for exploration of the design space from generation to generation to preserved good genetic information. This is critical in an optimization process, where a local minimum could occur in highly complex systems. Moreover, a wide range of highly nonlinear problems can be represented, formulated and solved using GAs. While there are advantages to GAs, researchers are looking for ways to overcome some fundamental challenges associated with this optimization method.
2.2 Topics Pertaining to Control Strategy
The high demand of alternative energy has led to the emergence of HEVs in the automotive industry. HEVs have been shown to improve fuel economy, reduce vehicle emissions and maintain drivability by incorporating electric motors into the drivetrain and a battery as a secondary power source. The ability to distribute multiple power sources in HEVs to meet driver demands can yield significant benefits over conventional internal combustion engine vehicles. Micro-hybrid vehicles with auto-start-stop based on the conventional 14V electrical system with brake energy regeneration have been shown to reduce fuel consumption by three percent (Shaeck et al. 2009). Many researchers have studied advanced control strategy using optimization methods such as stochastic fuzzy controller, artificial neural network and genetic algorithm to maintain vehicle performance and reduce fuel consumption (Junghwan et al. 2010; Paladini et al. 2007). Barsali et al. (2004) proposed an algorithm to reduce fuel consumption (1.6-5%) for HEVs through the forecasting of future vehicle load. Anderson and Pettit’s (1995) work provides a good explanation of individual components and the load-leveling device for HEVs (full details can be found in Anderson and Pettit 1995).
series-parallel, parallel through the road and others have been well studied (Bianchi et al. 2010; Liu et al. 2008; Schulz 2004; Syed et al. 2006).
This research focuses on a series PHEV powertrain configuration, where the vehicle can be plugged into the power grid and charged when not in operation. A series PHEV uses the ICE exclusively to power the generator to deliver the electrical power to the high voltage bus or charge the battery. The traction motor is coupled directly to the drivetrain. Two benefits of a series PHEV are the utilization of the ICE at the most efficient point during operation and the simplicity of powertrain configuration. Some of the drawbacks for PHEVs are large capacity batteries requirement which equate to a heavier ESS along with a more stringent cooling system. The most imminent drawback is the inefficiency when the vehicle operates at high speed due to the inherent nature of electric machines’ low torque at high speed (Zeraoulia et al. 2006). To alleviate the inadequacy of torque available, the vehicle is designed in a way that the electric drive handles the instantaneous load transient conditions and the engine handles the average road load (Plett 2004). Other researchers have studied advanced control strategy optimization such as stochastic fuzzy controllers, ANNs and GAs to maintain vehicle performance and reduce fuel consumption (Choy et al. 2006; Paladini et al. 2007; Wuet al. 2005; Zhao et al. 2011).
strategies utilize a fixed threshold control for the ICE active state (Anderson and Pettit 1995). While thermostat control strategies are well-known in coolant systems (active when hot), HEVs use similar concept to control the ICE (active when the SOC limit has reached a prescribed limit). The basic thermostat control strategy related to the battery SOC for a typical series HEV is as follows:
ICE is off when SOC is too high
ICE is on if power required is higher than what is available ICE is on when SOC is too low
Anderson and Pettit’s (1995) work provides a good explanation of individual components and the load-leveling device for HEVs along with two extreme control algorithms. The authors discussed the use of the auxiliary power unit (engine) and a load levering device (battery) to accommodate drivers demand and maintain energy efficiency. Specifically, the authors discussed two extremes in the spectrum of control strategies (thermostat control algorithm and power follower). The authors noted that in the thermostat mode, the battery must accommodate all the transient power requirements (Anderson and Pettit 1995). On the other hand, for the power follower, the ICE must operate over its entire range of power levels and perform fast power transient, which can reduce the efficiency and affect emission characteristics (Anderson and Pettit 1995).
proposed to distribute the energy flow in HEVs. The three modes of operation for series PHEVs are as follows:
Charge Depleting (CD)
The vehicle is in CD mode when the ESS provides all the energy to electric motor as a mean for vehicle propulsion. In the CD mode the ESS is the main energy provider, until it can no longer meet the power demand from the electric motor. As the stored energy in the ESS depleted from the initial SOC to the lower SOC limit, the vehicle enters the Charge Sustaining (CS) mode. This allows the vehicle to utilize the ICE and generator to provide additional energy to drive the vehicle.
Charge Sustaining (CS)
Charging
Charging is the accumulation of electrical energy in the ESS for future usage. While charging can occur in CD mode, plugging into the electrical grid while the vehicle is not in use through a charger will be the primary mode of charging.
It is critical to have a control strategy that accommodates the different driving modes at various electrical current load conditions. In the case of CD mode, a high ESS discharge rate is required, due to all the electrical power drawn from the ESS. The CS mode on the other hand, drew less electrical current from the ESS but experienced charging during normal operation. A balanced distribution of the energy between the ESS and ICE would give the desirable vehicle performance and can ultimately improve the ESS service life.
Barsali et al. (2004) have proposed a control strategy to minimize fuel consumption of a series HEV based on future load predicting method. The authors proposed a control strategy that required signals that can be used to forecast future vehicle loads. The future vehicle load is derived from the equivalent ripple in the root mean square of the power demand or using sliding average values (Barsali et al. 2004). While improvements in fuel economy were seen, the author suggested that advanced tools such as fuzzy logic and or ANNs could improve the vehicle load forecasting parameter (Barsali et al. 2004).
Randan (2011) proposed a method to optimize the Degree of Hybridization (DOH) for a parallel HEV using a GA to improve vehicle performance. Furthermore, the authors noted the selection of the ESS (number of battery modules) depends on two key design factors; maximum charge and discharge capacity during the analysis (Varesi and Ranan 2011). It is worthy to note that the authors found that for a DOH greater than 0.65, the system could not provide the necessary propulsion power (Varesi and Randan 2011). The DOH is defined as:
Where is the rated power for the electric traction motor, and is the rated power for the ICE. All the parameters in the study were extracted from ADVISOR for a DOH range of 0.3 to 0.65 to formulate the weighed cost function to be used in the GA (Varesi and Randan 2011). By using the GA to optimize these parameters, the authors reported that fuel economy increases as the DOH increases (Varesi and Randan 2011).
Wu et al. (2011) investigated a multi-objective self-adaptive differential evolution (MODASE) algorithm to optimize component sizing in parallel HEVs to increase fuel economy. The authors’ goal is to find a set of Pareto optimal solutions to provide alternative schemes to assist the design selection criteria (Wu et al. 2011). The diversity of the Pareto solutions is preserved based on a progressive comparison truncation operator which in turn is based on normalized nearest neighbor (Wu et al. 2011). The authors concluded that the use of MOSADE can provide a useful guide in the HEV development process, particularly in the earlier design phase (Wu et al. 2011).
Others have investigated the use of ANNs to improve vehicle efficiency. ANNs are a mathematical representation of the human brain network intended to imitate the learning and memory instinct of the human brain (Zhao et al. 2011). It stores new ‘knowledge’ by adjusting the weights of neurons in the ANN. Once the ANN is established the training process can begin (Zhao et al. 2011). At the most basic level, the ANN consists of an input layer, hidden layer, and output layer. It is well known that an ANN is a data-driven ‘black-box’ model due to the complex hidden layer (Zhao et al. 2011)
and reduce emissions while improving fuel economy (Wu et al. 2011). Domenico et al. have demonstrated the use of ANNs for on-line sensor fault detection, isolation and accommodation in automotive engines (2003).
While there are benefits to ANNs, there are drawbacks associated with this method. Due to the learning nature of ANNs, training data is required for a successful implementation. Choy et al. have reported that for some applications, the use of certain online learning methods in an ANN actually yields suboptimal results and inconsistent performance (Choy et al. 2006). The shortcoming is that there is no standard or set of rules when selecting the ANN structure that can guarantee an optimal solution.
time, which help real-time applications (Ippolito et al. 2003). Since knowledge based systems consist of a database whose structure and size affects the computation directly, the authors utilized a fuzzy-based clustering to mitigate the size of the database (Ippolito et al. 2003). Clustering is a means to partition the data set into smaller manageable sets with similar measures. The multi-objective optimization problem proposed by the authors is to optimize hydrocarbon, carbon monoxide, nitrogen oxide and state-of-charge. With this regard, conflicting objectives are compromised in order to arrive at a solution. The energy flow is managed by generating a database of knowledge for a specific drive cycle through optimization off-line. This data is then stored to be used during real-time. The authors claimed that a processor time reduction up to 85 percent is seen through simulations done in MATLAB with the imposed multi-objective functions and fuzzy c-means clustering (Ippolito et al. 2003).
training and test data sets was used in the simulation. The optimization for geometric compression ratio and operating parameters was done using a GA to obtain initial parameters (Zhao et al. 2011). The optimization shown for a combined GA and ANN method for the Atkinson cycle engine produced an improvement in average fuel economy of 8.5 percent for engine speed below 4400 rpm (Zhao et al. 2011).
In addition to reducing fuel consumption, the ESS thermal characteristics play a significant role in HEVs. Many researchers have looked at battery performance under extreme conditions such as high temperature or over voltage and metal oxide cathode degradation that may cause thermal runaway for automotive applications (Roth 2007; Shaeck et al. 2009). Others have looked at on-board estimation of the SOC through methods such as equivalent resistor-capacitor circuits and extended Kalman filters to estimate the battery state of health; all aiming to better control the energy distribution within the vehicle (Hu et al. 2011; Junghwan et al. 2010; Plett 2004). The root of the problem remains that batteries lose performance due to chemical instability when the SOC is near the critical lower limit.
moving charge with a transformer-based system can help improve the battery life and performance (Plett 2004). Plett pointed out for commercial success, the cycle life of the battery must meet or exceed the lifetime of the vehicle (Plett 2004). Cycle life is typically defined as the number of times a battery can be charged and discharged before its capacity falls below 70 or 80 percent of its original capacity (A123 2011). Equally important is the power characteristics at the lower SOC limit of the ESS, where most lithium ion battery technologies lose a significant amount of discharge power (A123 2011).
The Battery Control Module (BCM) monitors and communicates the battery State-of-Health (SOH); SOC, power fade, capacity fade and instantaneous available power to the entire vehicle. These parameters are critical for operation and it is continuously being monitored when the vehicle is in operation. Plett (2004) have demonstrated advanced prediction method of these parameters using the extended Kalman filter for lithium-ion polymer battery parameters estimation for HEV application. The authors noted that Kalman filters are an intelligent—and sometimes optimal—means for estimating the present value of the time-varying “state” of a dynamic system (Plett 2004). The estimation method allows for tracking of the cells’ degradation and age changing cell characteristics. This is important in applications such as HEV, where the harsh environment is very demanding on batteries and the BCM, and that precise estimation of some parameters will improve performance and robustness, and ultimately lengthen the useful lifetime of the pack (Plett 2004).
significantly shortened when the battery is fully charged or discharged (A123 2011; Hu et al. 2011; Plett 2004). Furthermore, overcharging (especially in the case of lithium ion battery) can cause permanent cell damage that leads to catastrophic failure in the form of thermal runaway (A123 2011; Hu et al. 2011; Plett 2004). The ESS charge and discharge rate is a major concern for HEVs where a high electrical current relative to the capacity of the cells is required. The present HEVs can demand up to 20 times the capacity rating, C-rate (Plett 2004). Such stringent requirements of electrical current from the traction motor translate into heat generation at the ESS that may cause disastrous failure. The thermal characteristics of the ESS have a significant impact on the performance and life in HEVs where the ESS can experience temperature variations ranging from -30 to 50 (Plett 2004).
2.3 Topics Pertaining to Vehicle Communication
pathway between micro-controllers through the Controller Area Network (CAN) used in modern vehicles.
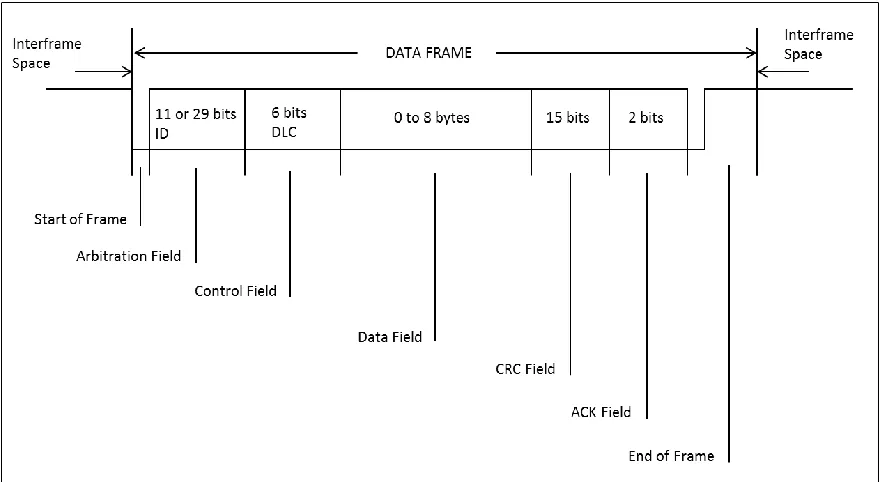
CAN is a serial communications protocol to support real-time control with a high level of security developed by Robert Bosch GmbH in 1983 (Bosch GmbH 1991). The aim is to improve efficiency of the communication pathway within a system. In automotive application, the electronics components such as engine control units, sensors and subsystems are connected using CAN with bitrates up to 1 Mbps. The CAN standard specification helps unify the communication protocol of these components by different manufactures. The CAN bus topology contains three entities; object layer, transfer layer and physical layer (for a complete CAN standard see Bosch GmbH 1991).
Figure 2.3: CAN data frame adapted from Bosch GmbH 1991.
A single vehicle usually contains multiple CAN buses in order to handle the vast amount of signals required for proper functionality. The 2013 Chevrolet Malibu, used as a test vehicle for the NCSU EcoCAR2 team contains one low speed GM LAN at 33.3 Kbps and 3 high speed (HS) CAN at 500 Kbps (HS CAN, chassis expansion and powertrain expansion). The high speed buses used the 11-bit (standard) identification while the single wire GM LAN utilized a 29-bit extended identification.
Low CAN lines must be 120 Ohm terminated on both ends of the bus for proper signals on the bus. The resistance is needed because the CAN signal is a differential signal. Figure 2.4 illustrates the 120 terminal on both ends of the CAN bus with four CAN devices implemented on the CAN bus.
Figure 2.4: CAN devices and bus termination on both ends.
The CAN serial communication allows sensors and subsystems to transmit the information within the vehicle with minimal wire requirement. The CAN protocol provides a simple communication pathway for a highly complex system to transmit information between subsystems. This pathway is critical for the design of HEVs where numerous subsystems (ESS, ICE, generator, battery charger, etc.) require large amounts of communication for normal operation. By having a common communication protocol, various components built by different manufactures can be seamlessly integrated.
Freescale microprocessors, it proven to be robust and reliably delivering complex control strategy (Woodward 2011). The ECU come with the Freescale MPC565 56 MHz microprocessor with 1M Flash, 548 K RAM, 8K serial EEPROM, 64Kx8 Parallel REPROM operating between 9-32Vdc. The experimental GM Ecotec engine used in this research uses the MPC565 ECU as the stand alone engine controller as shown in Figure 2.5. In the experiment, analogs and digital I/Os, PWM and frequency inputs are used to control and calibrate the engine parameters. The MotoHawk’s suite development software and hardware tools were used enabling a rapid development of complex controls for the engine. The engine performance and data were logged using the data acquisition capability onboard the ECU.
Figure 2.5: Mototron engine control module (Woodward 2011).
controller in the vehicle under normal operations or can be linked temporarily to a Personal Computer (PC) for reprograming, calibration and data analysis.
Figure 2.6: MicroAutoBoxII 1401/1501 with connector (dSPACE 2011).
One of the benefits of using this controller is that the host interface between the controller and the PC is via the standard Ethernet TCP/IP protocol. Moreover, by having the programing environment through Simulink/MATLAB the controls development process can be done visually rather than through conventional coding. This allows for a quick and simple way to identify errors or control logics during the development process. The MicroAutoBox provides 78-pin analog and digital I/O, PWM, LIN, serial interface, USB connector and two onboard CAN channels suitable for automotive applications. Computationally, the MicroAutoBoxII runs on the ultrafast PPC750GL processor with clock speed of 900 MHz and 16 MB of RAM allowing for high computing environment.
subsystems into the vehicle. Understanding of the CAN protocol and Simulink programing environment is critical for the development and implementation of the control strategy for the NCSU hybrid vehicle.
2.4 Summary
Section 2.1 covered the current research on vehicle efficiency, optimization methods and communication protocol used in modern vehicles. Importantly, by altering physical parameters and employing complex control algorithms, improvement in vehicle efficiency can be expected. Heuristic optimization methods such as GAs on the other hand, are important because they allow us to solve a highly nonlinear problem such as determining optimal driving patterns.
Section 2.2 covered the basics of HEVs, vehicle operating modes for series PHEVs, and the thermal characteristics of the ESS and demonstrated that HEVs can yield significant benefits over conventional internal combustion engine vehicles by utilizing multiple power sources. By understanding the different driving modes in a series PHEV, an innovative control strategy to maximize fuel economy can be developed. Further, the charge and discharge rate of the ESS play a critical role in the operation of the HEV and can be managed with an appropriate control strategy to avoid catastrophic failure.
common communication protocol, a new control strategy can be implemented with the existing vehicle communication with minimal computing requirements.
Chapter 3
Model
-
based
Determination of Optimal
Driving Patterns (Part 1)
Driving style can have a significant impact on fuel consumption, but it is often unclear how one should drive to get the optimal fuel efficiency (Hooker 1988). This chapter introduces a model-based method to determine the optimal driving patterns with the lowest fuel consumption utilizing a GA optimization method. In recent years, GAs have become a popular optimization tool used in engineering to solve complex problems. This is important because it allows us to handle highly nonlinear systems and arrive at an optimal solution.
3.1 Experimental Setup
The experimental data from a 2006 General Motors (GM) Ecotec 2.0L supercharged engine is used as input for the numerical model; the data was obtained under the direction of Dr. Richard Gould, where engine performance and fuel efficiency were investigated. This engine utilizes an Eaton M-62 helical roots-type supercharger that can produce a maximum boost pressure of 12 psi (General Motors 2005). In this experiment, the engine is controlled by a standalone ECU by Mototron and is mapped to produce the maximum allowable torque and horsepower for this engine. The engine torque is measured through an Omega load cell, coupled to a Go-power water brake dynamometer. Table 3.1 shows the engine parameters in this experiment. Figure 3.1 shows the experimental setup with the engine coupled to the water brake dynamometer. The data is then logged through the Mototron built-in data acquisition system for analysis. The mass fuel flow rate ̇ can then be computed from the logged injection timing and fuel rail pressure at different engine speeds.
Table 3.1: GM Ecotec engine parameters used in this experiment.
Engine 2.0L GM Ecotec Supercharged Inline-4
Displacement 121.9 cu in
Bore 3.39 in
Stroke 3.39 in
Compression 9.5:1
Power 205 bhp @ 5600 rpm
Torque 200 ft lbs @ 4400 rpm
Figure 3.1: Experimental GM Ecotec 2.0L supercharged engine setup with dynamometer and
data acquisition system.
The relationship between the engine speed and vehicle speed is given by (Bosch GmbH 2010).
(1)
Where n is the engine angular rotation in revolutions per minute (rpm), v is the vehicle speed in miles per hour (mph), i is the overall transmission ratio between the engine and driven wheels and r is the effective tire radius. The overall transmission ratio of 2.88 and effective tire radius of 12.8 inches were used to find the vehicle speed from the known engine speed. While there are many variables involved in a real driving scenario, the vehicle is assumed to operate in the highest gear—5th—throughout the driving duration, holding the power transmission constant.
3.2 Optimization Objective
fuel consumption (BSFC) for a given engine is optimal near 80% load, where 80% engine load is assumed for normal driving condition (Bosch GmbH 2010).
3.3 Mathematical Formulation
The standard form of a multivariable objective function is used to model the fuel consumption as shown below. Where is a set of design variables for all real in the subset of X, the feasible design space with dimension n. The solution would give the minimal value to the objective function subjected to the constraints and boundary conditions (Vanderplaats 2007).
(2)
Subject to (3)
For (4)
The fuel efficiency model for optimization is as follows:
∑ ̇ (5)
∑ (6)
̇ (7)
The mass fuel flow rate (gal/hr) as a function of vehicle speed ̇ is a 6th degree polynomial having the form of Eq. (7). The coefficient for , was found from the experimental data using the least squares regression method with ( ), where is the vehicle speed
(mph) and is the time duration in hours. The speed limits of 20-45 mph for city and 45-70 mph for highway driving are chosen to be the upper and lower bounds, respectively, while d is the distance traveled in the two driving scenarios considered: city (low speed, 10 mi distance) and highway (high speed, 100 mi distance). By combining Eq. (7) and Eq. (8), the objective function for city and highway can be obtained as follows:
̇ (9)
̇ (10)
By minimizing Eq. (9) and Eq. (10) and subjecting them to the constraints, the lowest amount of fuel consumed would yield the optimal driving patterns for both the city and the highway scenarios. A population size of p = 500, type = double vector, selection = stochastic uniform, crossover = scattered and stopping tolerance of 1E-6 are used in the MATLAB genetic algorithm solver for both city and highway scenarios.
3.4 Results & Discussion
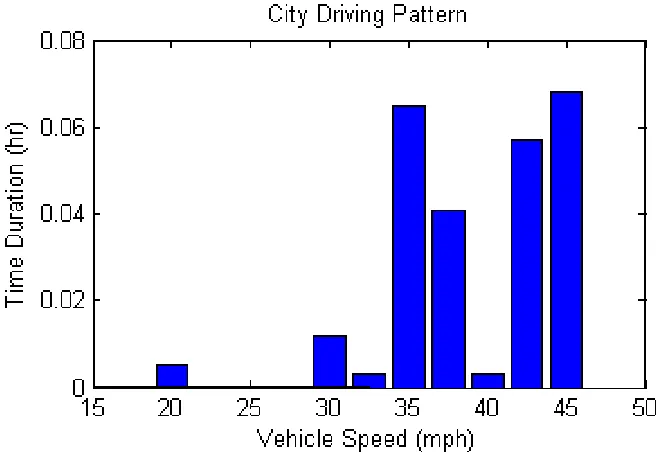
respectively. The most fuel efficient speeds for the city driving scenario were determined to be near 35 and 45 mph because they provided the longest driving duration as shown in Figure 3.3. For the highway scenario, a speed of around 62.5 mph was the most efficient (see Figure 3.4). However, while these three key speeds occurred for the longest duration, transitional speeds are required to achieve the lowest fuel consumption as seen in Figures 3.3 and 3.4. The determined patterns reflect real-world driving conditions for both scenarios, where highway travel is predominately at speeds near 60 mph and common city speed limits are 35 mph and 45 mph. The corresponding fuel economy for the driving patterns in Figures 3.3 and 3.4 are 20 and 26 mile per gallon (MPG), respectively.
Figure 3.4: GA optimal pattern for highway scenario with the lowest fuel consumption.
Two predefined drive cycles by the EPA were used as a benchmark for the determined driving patterns via the GA. Using the FTP and US06 drive cycles in Eq. (7) for comparison; Table 3.2 demonstrates the improved fuel economy for the determined driving patterns via the GA over the predefined cycles.
Table 3.2: Fuel consumptions comparison for GA determined driving patterns and EPA drive
cycles.
Distance (mi) Avg. Spd. (mph) MPG
GA city 10 38.32 20.35
GA hwy 100 62.18 25.62
FTP 11.04 21.21 16.22
3.5 Distance Sensitivity
Distance sensitivity studies were done to see the effect of distances selected for both the city and the highway scenarios used in the model. Figure 3.5 shows an average fuel consumption of 19.4 MPG with 3.8% variation for distances between d = 5 to 20 miles for the city scenario. The highway driving scenario shows an average mpg of 25.5 mpg with a slight decrease of 1.2% between the distance range of d = 50 to 200 miles (see Figure 3.6). It is safe to say that the distance used for both the city and highway scenarios in the model (10 and 100 mi.) have minimal impact on the results.
Figure 3.6: Distance traveled effect on vehicle fuel economy for the highway scenario.
For the EcoCAR2 competition, the team will be scored on how much petroleum energy is
consumed by the vehicle when travelling the required distance of 200 miles. While the competition requires that the vehicle has to be able to travel a distance of 200 miles, the mass of liquid fuel consumed during the trip of approximately 100 miles will be calculated for scoring. The figures above show the robustness of the optimal driving patterns determined using a GA optimization method up to 200 miles for the highway scenario.
3.6 Conclusion
optimization method. By utilizing experimental engine data as input parameters, a numerical model was developed to determine the optimal driving patterns for the two scenarios. An optimal driving pattern is a collection of driving times and driving speeds used to cover a given distance with the least amount of fuel. For the city driving scenario, driving speeds near 35 and 45 mph were found to yield the lowest amount of fuel consumption; around 60 mph for the highway driving scenario. Remaining around these speeds means that drivers minimize the driving period when the ICE would perform at inefficient levels; the period of lower speeds when an engine’s torque and horsepower is low, but fuel requirement thresholds must be maintained.
Chapter 4
Adaptive
Control
Strategy
Development
(Part 2)
This chapter introduces an adaptive control strategy for a series PHEV which incorporates the complexity of human driving behavior. The optimal driving patterns determined in Chapter 3 provide a piece of the puzzle to develop the adaptive control strategy. By taking these known driving patterns for the conventional ICE vehicle along with the inefficiency of the electric traction motor at high speed, an intelligent EMS can be derived to improve vehicle efficiency. With this information, an adaptive control strategy is derived to adjust the energy distribution between the ICE and the ESS for a series PHEV. This control strategy is modeled and integrated in the Advanced Vehicle Simulator (ADVISOR) software using the Simulink/MATLAB platform. The results of the vehicle performance and efficiency for the adaptive control strategy will be discussed in this chapter.
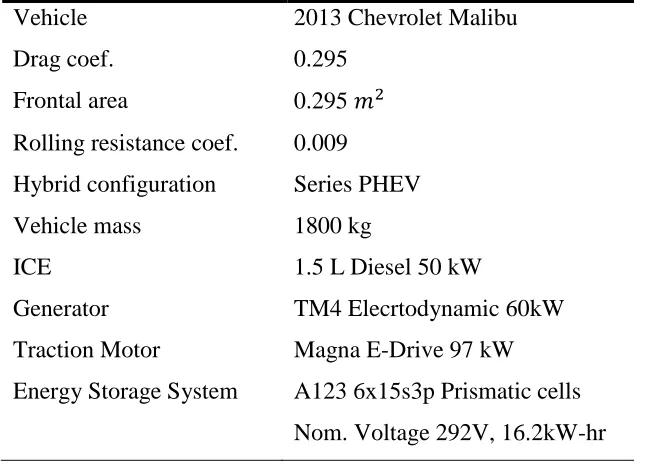
vehicle. These hybrid vehicles must be designed to reduce fuel consumption, reduce tailpipe emissions and maintain consumer acceptability in the area of performance, utility and safety. Given this specification, the team was provided with a 2013 Chevrolet Malibu to use as the integration platform for the new hybrid design vehicle. The 2013 Chevrolet Malibu vehicle parameters are used in ADVISOR to investigate the performance of the adaptive control strategy relating to the vehicle performance and efficiency. Table 4.1 shows the 2013 Malibu parameters along with the components used for modeling the series PHEV. The ESS has a nominal of 292 V rated at 16.2 kW-hr provided by A123 Systems. The 97 kW electric traction motor is manufactured by Magna. A 60 kW generator by TM4 Electrodynamics is directly coupled to a 50 kW Kubota diesel ICE.
Table 4.1: 2013 Chevrolet vehicle data and components used in ADVISOR simulations.
Vehicle 2013 Chevrolet Malibu
Drag coef. 0.295
Frontal area 0.295
Rolling resistance coef. 0.009
Hybrid configuration Series PHEV
Vehicle mass 1800 kg
ICE 1.5 L Diesel 50 kW
Generator TM4 Elecrtodynamic 60kW
Traction Motor Magna E-Drive 97 kW Energy Storage System A123 6x15s3p Prismatic cells
Based on the selected components and parameters in Table 4.1, the DOH for the vehicle can be calculated as follow:
While the DOH of the NCSU series PHEV is marginally larger than 0.65, it is within reasonable limit to provide the necessary power required for vehicle propulsion.
4.1 Control Strategy
The concept of a control strategy is to facilitate the communication pathway and the energy available onboard of the vehicle for best performance and efficiency. For this research, the term control strategy is used to describe the power distribution between the ESS and the ICE. The goal is to balance the ESS electrical power demand and the ICE to achieve the most efficient energy combination to maintain vehicle performance and drivability.
conventional ICE vehicles; however, they are not efficient driving speeds for series PHEVs due to the inefficiency of the traction motor operating at high speed.
As shown in Figure 4.1 (a), the power required for vehicle propulsion is nonlinear as vehicle speed increases. As the gradient increases, the efficiency of the traction motor decreases. Similarly, the ESS SOC gradient decreases as the vehicle speed increases in a nonlinear fashion (see Figure 4.1 (b)). Due to the inefficiency at these relatively high driving speeds caused by the large energy gradient required by the traction motor, an adaptive upper and lower bound of the SOC limit is introduced to manage the power demand between the ESS and the ICE during a drive cycle.
4.2 Simulink Model
This section looks at the development of the adaptive control strategy in Simulink and implementation in ADVISOR. The adaptation of the SOC upper and lower limits is a simple concept: once the vehicle speed crosses an undesired velocity condition, new upper and lower bounds are defined based on the SOC and vehicle speed, and they remain true until the condition is no longer satisfied. The new SOC bounds are constantly changing and adapting to the driving conditions. An if-then rule-based control is applied to ensure the conditions are satisfied.
to a lower limit and force an exit due to violating the if-then conditions. A more detailed procedure of the Simulink model for the adaptive control strategy can be found in Appendix A.
Figure 4.2: Simulink model of adaptive control strategy.
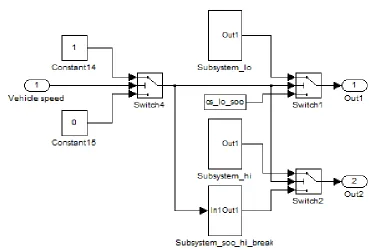
Moreover, the Subsystem_gain_lo also set the bandwidth parameters for mode 1 and mode 2 in the control strategy.
Figure 4.3: Adaptive control strategy Subsystem_lo block.
The adaptive control for the ICE active state is as follows:
ICE is on if the velocity conditions are true (vehicle speed ) and violate the lower SOC limits.
ICE is off if the velocity conditions are true (vehicle speed ) and violate the upper SOC limits.
of 0.7, SOC lower limit of 0.2 and SOC upper limit of 0.8 are used in this study along with the parameters in Table 4.1. The model is built in Simulink and integrated in ADVISOR using MATLAB 2010b. Tuning the parameters of the adaptive control strategy is shown in the subsequent section.
4.3 Controller Parameter Tuning
This section examines the different parameters of the adaptive control strategy and how they affect the vehicle performance and efficiency. The aim is to tune the controller design to yield the best overall performance and maintain robustness throughout the duration of a drive cycle. Of interest is the SOC characteristic, where the linear and predictable SOC over a drive cycle is desired. The three variables of interest pertaining to the proposed adaptive control strategy are as follows: the lag controller design, bandwidth limits, and upper and lower limits ratio.
4.2.1 Lag Controller Design
A lag controller is used to define the new upper and lower limits in the adaptive control strategy. A lag controller is similar to a proportional-integral controller; it is useful for reducing the step-response steady-state tracking error and overshoot (Chow et al. 2002). Consider a continuous-time transfer function in the form of:
(
Where is the lag compensator, is the gain, is the zero and is the pole. With this first-order continuous-time transfer function a controller was designed and tuned to meet the desired performance for the adaptive upper and lower limits. As previously mentioned, the ability of the upper and lower limits to follow the SOC will have a significant impact on the performance of the vehicle. This section evaluates the effect of different values, values and values on the ESS SOC over a drive cycle. Figure 4.4 illustrates the effects of different values on the ESS performance over the US06 (x8) drive cycle.
Figure 4.5: Pole effects on ESS performance with = 0.74 and = 0.2.
ability to follow the power demand without drastically depleting the ESS during a drive cycle.
Figure 4.6: Gain parameter for the lag controller with = 0.74 and = 0.95.
the lag controller as it exhibits the best performance and meets the design target. The final design parameter of the lag controller takes the form of:
The final design of the lag controller exhibits good performance and adaptability for a series PHEV. Figure 4.7 shows the performance and adaptability of the final lag controller design over the US06 (x15) drive cycle. As can be seen in Figure 4.7 (b) the upper and lower SOC limits follows the SOC closely to ensure the desirable performance over the drive cycle. While the upper and lower SOC limits effect the ESS characteristics, the bandwidth values of these limits can impact the adaptive controller performance significantly.
4.2.2 Bandwidth Value
Table 4.2: Bandwidth parameter for driving modes 1 and 2 effect on fuel economy.
Bandwidth US06 (x8) - MPG US06 (x10) - MPG US06 (x15) - MPG
Mode 1 0.05
Mode 2 0.02 44.2 44.2 40.2
Mode 2 0.05 44.2 44.2 40.2
Mode 2 0.08 44.2 44.2 40.2
Mode 1 0.1
Mode 2 0.02 46.1 46.6 40.2
Mode 2 0.05 46.1 46.6 40.2
Mode 2 0.08 47.7 46.7 40.2
Mode 1 0.15
Mode 2 0.02 47.8 44.7 40.2
Mode 2 0.05 47.8 44.7 40.2
Mode 2 0.08 49.1 44.7 40.2
Mode 1 0.2
Mode 2 0.1 48.8 44.6 40.2
Mode 2 0.15 48.7 44.6 40.2
Mode 2 0.2 48.7 44.6 40.2
in Table 4.2) that exhibit the best fuel economy are selected to examine the SOC characteristics as shown in Figure 4.8.
Figure 4.8: SOC performance for four selected bandwidth combinations.
compared to the 47.8 MPG for mode 1 = 0.15 and mode 2 = 0.05, the sharp decrease at the start of the drive cycle corresponds to a high ESS discharge rate, which is undesirable. In order to preserve the desired design performance, mode 1 = 0.15 and mode 2 = 0.05 were selected as the final the bandwidth values.
4.2.3 Upper and Lower Limits Ratio
Figure 4.9: Upper and lower limits ratio effect on SOC for US06 (x1.5) drive cycle.
vehicle performance and efficiency. The final parameters for the adaptive control strategy are selected to meet the design criteria for good performance with the desirable ESS discharge rate as shown in Table 4.3.
Table 4.3: Final design parameters for the adaptive control strategy.
0.74 0.95 0.2
Mode 1 bandwidth 0.15
Mode 2 bandwidth 0.05
Variable U/L ratio 1-SOC
This section looked at the effects of the lag controller design, bandwidth values, and U/L limits ratio on the adaptive control strategy. The final parameter selection is based on the best combinations of lag controller, bandwidth values, and U/L ratio. While it is difficult to take all variables into account, the variables studied have been shown to be highly sensitive to the overall design goal and performance. The selected parameters exhibit good performance, stability, efficiency and linear characteristics for the design of the adaptive control strategy.
4.4 Results & Discussion
Figure 4.10: Adaptive SOC for US06 drive cycle (a) vehicle speed (b) ESS SOC with newly
defined upper and lower limits in blue and red, respectively (c) generator power (d) ESS
Table 4.4 shows the fuel economy in miles per gallon (MPG) for the US06 drive cycles (x8, x10 and x15) with and without the adaptive control strategy. Controlling the upper and lower limits at the two vehicle speeds, and , results in an improvement in fuel economy up to 15 percent (as shown in Table 4.4) for the US06 (x10) and (x15) drive cycles for a distance of 80 and 120 miles, respectively. On the other hand, a shorter distance (US06x8) of 64 miles shows an improvement of only 13 percent. This smaller gain in fuel economy can be explained by the larger percent of the ICE active for the distance traveled. For a shorter distance, the percent of ICE active is larger compared to a longer distance, hence smaller benefit is seen.
Table 4.4: Fuel economy with adaptive control strategy and without control strategy.
Control Strategy Cycl. Distance (mi) MPG
Adaptive SOC US06x8 64 47.8
US06x10 80 44.7
US06x15 120 40.2
Without control US06x8 64 42.3
US06x10 80 38.8
US06x15 120 34.9
(4)
Where is the energy generated (W), is the electrical current (Amp) and is the electrical resistance (ohm). A complete formulation of the lumped capacitance model used for the ESS thermal analysis can be found in Appendix B.
Figure 4.10 (d) illustrates a lower current profile when the generator is on compared to when the ICE is off. Figure 4.12 shows the temperature profile for the duration of the drive cycle with the adaptive SOC upper and lower bounds compared to without adaptive control. For the US06 (x15) drive cycle, the ESS experiences a 5°C lower temperature than without the adaptive control method (see Figure 4.12).
4.5 Conclusion
The benefits of an adaptive SOC limit for a series PHEV using determined optimal driving patterns were demonstrated in this chapter. By adjusting the upper and lower SOC limits, improved usable power capacity and a widened range of SOC over a greater distance is seen. Additionally, modulating the ICE will lower the amount of electrical current that is drawn from the ESS during a drive cycle. Having the ICE partially deactivated for a finite duration of the drive cycle will reduce the amount of fuel being consumed and potentially lower emissions. The proposed adaptive control strategy using information determined from optimal driving patterns:
Increased fuel economy by having the ICE partially active.
Improved vehicle performance by increasing the ESS usable power capacity over a wide range of SOC over a greater distance.
Reduced the ESS discharge rate over a drive cycle by lowering the electrical current profile.
Chapter 5
Vehicle Communication
The component manufacturer usually provides the dbc allowing the engineer to easily communicate and interact with the component. In some cases, only the message ID and bitwise information is available, while the control developer has to create the dbc file or manually input specific information required to have proper CAN communication. For the NCSU EcoCAR2 team, all sponsored and purchased components come with a dbc file, which makes programing more composed.
The vehicle model platform is organized in subcategories: physical signals and a supervisor model (input/output) as shown in Figure 5.1. The physical signals block organized all the inputs and outputs used in the vehicle that are utilized by the supervisory control. In order to have a robust and successful implementation of the proposed control strategy, the signals must be reliable and not overload the CAN buses. By utilize existing CAN signals for the adaptive control strategy the payload on the CAN buses can be reduced.