Effect of WEKA Filters on the Navie Bayes
Data Mining Algorithm
K.Srilakshmi
1, N. Siva Prasad
2, D. Mukesh
3PG Scholar, Dept. of Computer Science and Engineering, SVEC, Tirupati, AP, India1
PG Scholar, Dept. of computer Science and Engineering, AITS, Tirupati, AP, India2, 3
ABSTRACT: Data mining is the process of selecting, exploring and modeling a large database in order to discover model
and patternthat are unknown. Enormous gathered data in Health care Information society are scattered with different
archive systems which are not connected with one another. This unorganized data leads to delay in monitoring, improper planning, defocus the analysis which leads to inaccuracy in decision making. The purpose of this study is to explore Supervised and Non Supervised WEKA filters on the data mining algorithm NavieBayes which is used for classification the data sets of Arrhythmia and Parkinson’s diseases. This in turn helps in increasing the performance accuracy of the classifier used for knowledge discovery. Both the Datasets were taken from UCI Repository.
KEYWORDS: Filters, Parkinson’s Data, Arrhythmia Data, NavieBayes, Performance Matrices
I. INTRODUCTION
An arrhythmia is an abnormal heart rhythm. It may feel like fluttering or a brief pause. It may be so brief that it doesn’t change your overall heart rate. Or it can cause the heart rate to be too slow or too fast. Some arrhythmias don’t cause any symptoms. Others can make you feel lightheaded or dizzy. In the USA, it is estimated that there are nearly one million CHD patients, 15–20% with disease of severity to warrant surgical intervention. Arrhythmias complicate the care of many adults with CHD [4].This article will review the evaluation and management of these more common arrhythmia problems in adults with CHD using machine learning techniques.
Parkinson’s disease (PD) was first described in 1817.Sscientists have pursued the causes and treatment of the disease. In the early 1960s, scientists identified the primary problem underlying the disease, the loss of brain cells that produce a chemical called dopamine, which helps to coordinate and control muscle activity. Research suggests that PD
affects at least 500,000 people in the United States, which pays $6 billion annually to society [5]. In Scotland,
there arebetween 120 and 230 patients with PD per 100,000 people [6], while the population of Scotland remains stable, the age related incidence of PD means that the number of cases will increase by 25–30% over the next 25 years.
II. METHODOLOGY
In this research WEKA (The Waikato Environment for Knowledge Analysis) for running several algorithms has been chosen. The NavieBayes classifier has been chosen as the mining algorithm as its publicity and results in the recent published literature.
A. NavieBayes
assuming attributes as statistically independent. The word Naive means strong. All attributes of the data set are considered as independent and strong of each other [8]. This method is based on probabilistic knowledge. This method goes by the name Naïve Bayes, because it’s based on Bayes’s rule and “naively” assumes independence- it is only valid to multiply probabilities when the events are independent [9]. Thus the naïve Bayes rule outputs probabilities for the predicted class of each member of the set of test instance. Naïve Bayes is based on supervised learning. The goal is to predict the class of the test cases with class information that is provided in the training data. The Naïve Bayes classification reads a set of examples from the training set and use the Bayes theorem to estimate the probabilities of all classifications. For each instance, the classification with the highest probability is chosen as the prediction class. The naïve Bayesian classifier traditionally makes the assumption that a single Gaussian distribution generates numeric attributes [10].
III. DATASETS
To review the performance of the classifier NavieBayes on the Arrhythmia and Parkinson’s datasets the data has to go initially go through few preprocessing steps which makes the good quality data, ready to use by the classifier. These steps are as follows:
A. Data Preprocessing
An important step in the data mining process is data preprocessing [11]. One of the challenges that face the knowledge discovery process in medical database is poor data quality. For this reason we tried to prepare data carefully to obtain accurate and correct results. First we choose the most related attributes to the mining task [12].
B. Data Mining Stages
The data mining stage was divided into four phases. At each phase all the algorithms were used to analyze the health datasets. The testing method adopted for is parentage split that train on a percentage of the dataset, cross validate on it and test on it the remaining percentage. Sixty six percent (66%) of the health dataset which were randomly selected was used to train the dataset using the classifier. The validation was carried out using ten folds of the training sets. The models were now applied to unseen or new dataset which was made up of thirty four percent (34%) of randomly selected records of the datasets. Thereafter interesting patterns representing knowledge were identified.
i. Classification
The basic classification is based on supervised algorithms. Algorithms are applicable for the input data. Classification is done to know the exactly how data is being classified. The Classify Tab is also supported which shows the list of machine learning algorithms. These algorithms in general operate on a classification algorithm and run it multiple times manipulating algorithm parameters or input data weight to increase the accuracy of the classifier. Two learning performance evaluators are included with WEKA. The first simply splits a dataset into training and test data, while the second performs cross-validation using folds. Evaluation is usually described by the accuracy. The run information is also displayed, for quick inspection of how well a classifier works.
ii. Manifold machine learning algorithm
The main motivation for different supervised machine learning algorithms is accuracy improvement. Different algorithms use different rule for generalizing different representations of the knowledge. Therefore, they tend to error on different parts of the instance space. The combined use of different algorithms could lead to the correction of the individual uncorrelated errors. As a result the error rate and time taken to develop the algorithm is compared with different algorithm.
iii. Algorithm selection
(10-fold cross-validation) on the training set and selects the best one for application on the test set. Although this method is simple, it has been found to be highly effective and comparable to other methods. Several methods are proposed for machine learning domain. The overall cross validation performance of each algorithm is evaluated. The selection of algorithms is based on their performance, but not around the test dataset itself, and also comprising the predictions of the classification models on the test instance. Training data are produced by recording the predictions of each algorithm, using the full training data both for training and for testing. Performance is determined by running 10- fold cross-validations and averaging the evaluations for each training dataset. Several approaches have been proposed for the characterization of learning domain. The algorithms are ranked according to their performance of the error rate [13].
iv.Manuscript details
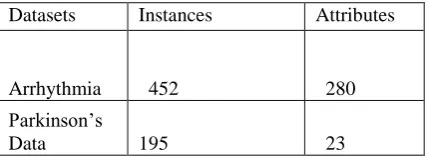
This paper deals with NavieBayes. Experimental setup is discussed using the Datasets of Arrhythmia and Parkinson’s
Data. Arrhythmia Dataset has 452 instances and 280 while as Parkinson’s data contains 195 instances and 23 attribute as
given below in table. The performance analysis is done among these algorithms based on the accuracy and time taken to build the model.
Table 1. Datasets and their types used
Datasets Instances Attributes
Arrhythmia 452 280
Parkinson’s
Data 195 23
IV. EXPERIMENTAL DESIGN
The NavieBayes classifier was used for the classification on the processed data of Arrhythmia and Parkinson’s datasets. This Algorithm is selected by evaluating each supervised machine learning algorithms by using supervised learning assessment (10-fold cross-validation) on the training set. Performance is determined by running 10- fold cross-validations and averaging the evaluations for each training dataset. Several approaches have been proposed for the characterization of learning domain. Firstly the NavieBayes algorithm is used on both the datasets of Arrhythmia and Parkinson’s diseases using 10- fold cross validation and the corresponding performance parameters are noted down. Then the Discrete attribute filter from the supervised filters in WEKA is used on both the datasets, which divides the input values of the datasets to a range of values, and its performance parameters are also correspondingly measured.
Similarly, the Numeric Transform from attribute in unsupervised filters in WEKA filters is used on both the datasets .Numeric Transform uses a predefined function “java.lang.Math” and the default method name in WEKA is “abs”, which has to be replaced by “floor” method. Also the “attribute Indices” has to be mentioned in order to make this predefined conversion function understand which attributes in input dataset has to be transformed. Upon transforming the NavieBayes algorithm is again used and correspondingly the performance parameters are measured.
V.PERFORMANCE METRICS
lower left cell denoting the number of samples classified as false while they actually were true (i.e., false negatives), and the upper right cell denoting the number of samples classified as true while they actually were false (i.e., false positives).Once the confusion matrixes were constructed, the accuracy, sensitivity and specificity are easily calculated as: sensitivity = TP/(TP + FN); specificity =TN/(TN + FP). Accuracy = (TP + TN)/(TP + FP + TN + FN); where TP, TN, FP and FN denotes true positives, true negatives, false positives and false negative. More Matrices include used are as:
Time: This is referred to as the time required to complete training or modeling of a dataset. It is represented in seconds.
Kappa Statistic: A measure of the degree of nonrandom agreement between observers or measurements of the same
categorical variable.
Mean Absolute Error: Mean absolute error is the average of the difference between predicted and the actual value in all
test cases; it is the average prediction error.
ROC Curves: ROC curves are similar to lift charts. It stands for “Receive Operating Characteristics “.These are Used in
signal detection to show tradeoff between hit rate and false alarm rate over noisy channel. It also Differences to lift chart: y axis shows percentage of true positives in sample rather than absolute number¨ x axis shows percentage of false positives in sample rather than sample size.
VI. EXPERIMENTAL RESULTS A. Before Applying Filter
Table 2 NaviesBayes Performance measures on Arrhythmia Datasets
Performance Matrices NavieBayes
Time 0.03ms
Kappa Statistics 0.442
MAE 0.0473
RMSE 0.2146
RAE% 55.25%
RRSE% 104.39%
Accuracy=TP+TN/TP+
FP+TN+FN 62.3894%
Sensitivity =TP/TP+FN 90.43%
Specificity=TN/TN+FP 57.58%
Precision 0.627
Recall 0.624
FMeasure=2*Precision *Recall/Precision+Rec
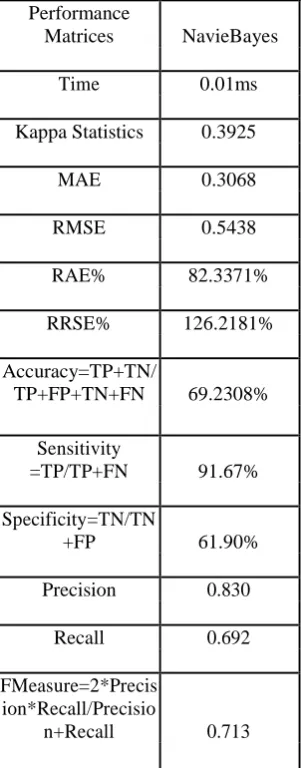
B) After applying Supervised Filter
Table 3 NaviesBayes Performance measures on Parkinson’s Datasets
Performance
Matrices NavieBayes
Time 0.01ms
Kappa Statistics 0.3925
MAE 0.3068
RMSE 0.5438
RAE% 82.3371%
RRSE% 126.2181%
Accuracy=TP+TN/
TP+FP+TN+FN 69.2308%
Sensitivity
=TP/TP+FN 91.67%
Specificity=TN/TN
+FP 61.90%
Precision 0.830
Recall 0.692
FMeasure=2*Precis ion*Recall/Precisio
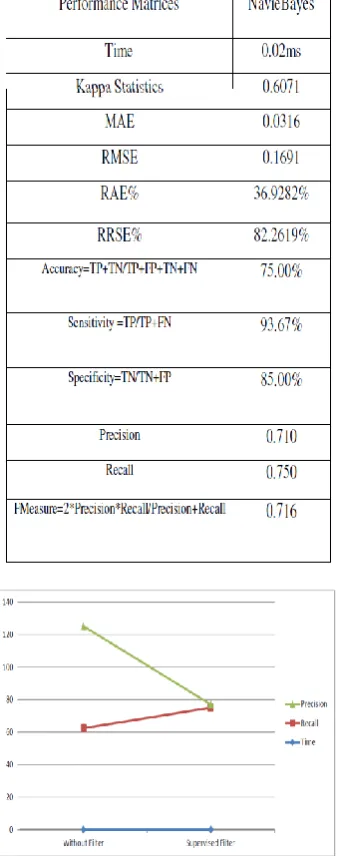
Table 4 NavieBayes Performance measures on Arrhythmia Datasets
Fig. 2 Shows the effect of Applying Unsupervised Filter w.r.t the classification with no filters in case of Parkinson’s Disease
C. After applying Non Supervised Filter
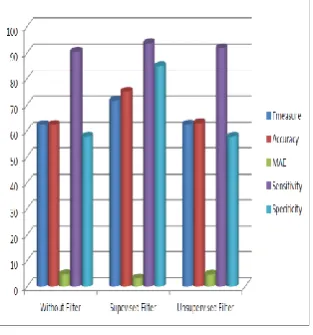
Fig. 3 Comparison of various Parameters on Arrhythmia data set before and after applying the WEKA filters
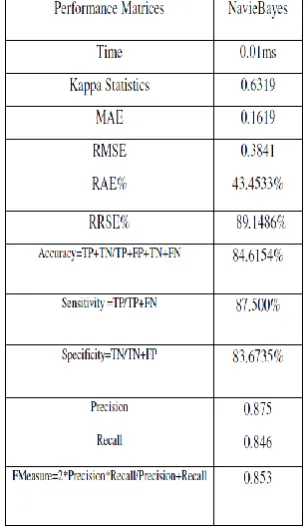
Table 7 NavieBayes Performance measures on Parkinson’s Datasets
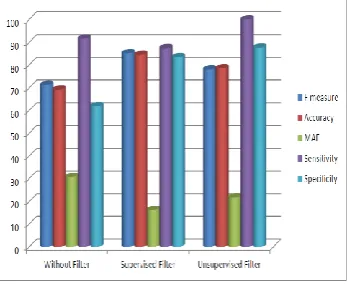
Fig. 4 Comparison of various Parameters on Parkinson’s data set before and after applying the WEKA filters
VII. CONCLUSION AND FUTURE SCOPE
REFERENCES
[1] I.H. Witten, E. Frank. Data Mining: Practical machine learning tools and techniques, 2nd Edition. Morgan Kaufmann, San Francisco, 2005. [2] Basilis Boutsinas Nikolaos Mastrogiannis and Ioannis Giannikos. A method for improving the accuracy of data mining classification algorithms.
Computers & Operations Research, vol. 36, no. 10, pp. 2829-2839, 2009.
[3] A. Asuncion, D.J. Newman. UCI Machine Learning Repository. Irvine, CA: University of California, School of Information and Computer Science,2007,http://www.ics.uci.edu/~mlearn/MLReposito ry.html.
[4] Arrhythmia’s in adults with congenital heart disease John K Triedman Heart 2002; 87: 383 389.
[5] Parkinson’s Disease , Challenges ,Progress And Promise ,November 2004 , National Institute Of Neurological Disorders and Stroke ,National Institutes Of Health.
[6] Diagnosis and Pharmacological Management Of Parkinson’s Disease, A National Clinical Guideline By Scottish Intercollegiate Guidelines Network.
[7] G.H.John and P.Langley, ―Estimating Continuous Distributions in Bayesian Classifiers,ǁ Proceedings of the 11th Conference in University in Artificial Intelligance,San Francisco,1995,pp.338-345.
[8] D. Pedro and M. Pazzani "On the optimality of the simple Bayesian classifier under zero-one loss". MachineLearning, 29:103–137, 1997. [9] Witten, T.H and Frank, E. 2000 Data mining: Practical machine learning tools and techniques with Java implementations. Morgan Kaufmann, San
Francisco.
[10] Hirdes J.P., Perez E., Curtin-Telegdi N., et al, 1999. RAI-Mental Health (RAI-MH) Training manual and resource Guide Version 1.0. [11] P.T.Kavitha, Dr.T.Sasipraba , Knowledge Driven HealthCare Decision Support System using Distributed Data Mining, Indian Journal of Computer
Science and Engineering (IJCSE) , Vol. 3 No.3 Jun-Jul 2012.
[12] Blaz Zupan Riccardo Bellazzi. Predictive data mining in clinical medicine. International Journal of Medical Informatics, vol. 77, no. 2, pp. 81-97, 2008.
[13] Nickolas Savarimuthu Sarojini BalaKrishnan, Ramaraj, NarayanaSwamy and Rita Samikannu. Feature Selection using FCBF in TYPE II Diabetes Databases. Proceedings of 7th Annual Conference on Information Science, Technology and Management New Delhi, 2009.
BIOGRAPHY
Mrs. K.Srilakshmi received her M.Tech Degree in Software Engineering from the JNTUA, Aananthapuramu in 2014. B.Tech Degree in Information Technology from JNTUA, Aananthapuramu, 2012. Her Area of Interest are Data Mining, Software Engineering, Data Structures.
Mr. D. Mukesh received his M.Tech Degree in Computer Science from the JNTUA, Aanantapuramu in 2014. B.Tech Degree in Information Technology from JNTUA, Anantapuramu, 2012. His Area of Interest is Operating Systems, Cloud Computing. ,Computer Networks,Data Mining.