Improve De-Noising Based on Singular Value
Decomposition
Nidhal K. El Abbadi, Naseer R. M. AlBaka, Ghadeer Hakim
Dept. of Computer Science University of Kufa, Najaf, Iraq
Dept. of Computer Science, University of Kufa, Najaf, Iraq
Dept. of Mathematical, University of Kufa, Najaf, Iraq
ABSTRACT: Noise is a random variation of image intensity and appear as grains in the image. There are many methods suggested for de-noising. One of them is filtering image by using singular value decomposition, this filter work well but did not remove all the noise in the color image.
In this paper we suggested to improve the performance of this filter by combined it with suggested filter based on total least square value.
The proposed algorithm tested with (Salt and pepper and Speckle noise) and different concentration of noise and gives promised results. Also proposed algorithm compared with other de-noising algorithms and the results were better.
KEYWORDS: SVD, de-noising, TLS, noise filter, image processing.
I. INTRODUCTION
Noise reduction is one of the most essential processes for image processing. The goal of the noise reduction is how to remove noise while keeping the important image features as much as possible [1].
Image noise is the random variation of brightness or color information in image.Noise can occur during image capture, transmission, etc. Noise removal is an important step in image processing. In general the results of the noise removal have a strong effect on the quality of the image processing technique [2].
Image noise can also originate in film grain and in the unavoidable shot noise of an ideal photon detector. Image noise is generally regarded as an undesirable by-product of image capture. Although these unwanted fluctuations become known as "noise" by analogy with unwanted sound, they are inaudible, such as dithering. There are several noises that may degrade the quality of an image: Poisson noise(shot noise), Speckle noise, Amplifier noise(Gaussian noise), Salt-and-pepper noise [3].
II. RELATED WORK
(Lin Hu, et. al.) suggested a method of noise reduction based on singular value decomposition (SVD) applied to digital receiver front-end. To determine the optimal de-noising order, a new method is presented according to the curvature of the increment of singular entropy. Verification tests are taken using the simulation signal and the actual output signal from the receiver, respectively. The results show that this method has obviously reduction of the background noise and can guarantee the integrity of the information contained in the signal after noise reduction; in other words, the method can effectively improve the signal-to-noise ratio(SNR) of the receiver front-end [4].
Four types of noise (Gaussian noise , Salt & Pepper noise, Speckle noise and Poisson noise) is used by (Patidar, et. al.). Image de-noising performed for different noise by Mean filter, Median filter and Wiener filter. Further results have been compared for all noises [5].
III. SINGULAR VALUE DECOMPOSITION (SVD)
The SVD has also applications in digital signal processing, e.g., as a method for noise reduction. The central idea is to let a matrix A represent the noisy signal, compute the SVD, and then discard small singular values of A. It can be shown that the small singular values mainly represent the noise, and thus the rank-k matrix Ak represents a filtered signal with less noise. Since the singular values of S display in a diagonal in descending order, the algorithm was able to remove the lower values (corresponding to the noise).
Let A be m × n real matrix, then there exist matrices U orthogonal matrix of size m × m, V orthogonal matrix of size n × n and S diagonal matrix of size m × nwhere all the entries s are 0 when i≠j
=
Where U U = I, V V = I and s ≥s ≥ ⋯s ≥0, where p = min{m, n}.
The columns of U are orthonormal eigenvectors of AA , The columns of V are orthonormal eigenvectors of A A, And S is a diagonal matrix containing the square root of eigenvalue from U or V in decreasing order [6].
IV. THE PROPOSED METHOD
A. Implementing Singular Value Decomposition Algorithm
1. Input image will be decomposed to three matrices (U,S,V) by using the Singular Value Decomposition. 2. The matrix (s) which is diagonal matrix, will process by removing the least values in the diagonal to get (S’), then reconstruct the image by multiplication the three matrices (U*S*VT), this process will help to remove some of image noise.
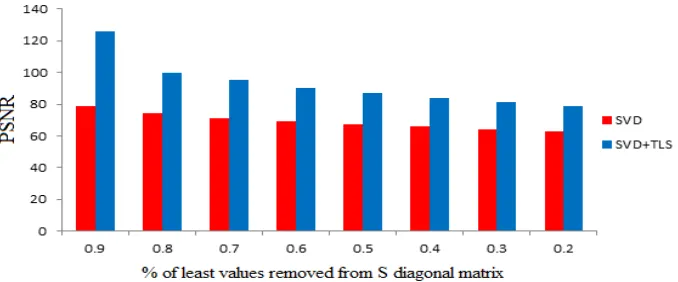
3. The present of elements removed by step two determined by experiment. We test to remove (20% … 90%) of least value in diagonal matrix.
4. The best percent of least values removedfrom diagonal matrix was (80% and 70%), that mean the reminding values of main diagonal will be (20 or 30 %).
5. The input image tested with above values after inserting (Salt and pepper,Speckle noise ) in image. 6. Input image tested with different percent of noise and different types of noise.
7. Each image with specific value of noise and noise type tested with all the steps from(1-4). B. Implementing Total Least square(TLS)
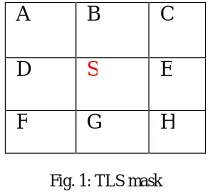
Suppose that we have a window of nine holes and move this window on the entire image from left to right and top to down. At each time the TLS will be determined, and according to it, the value at the center of the window will be change.
A B C D S E F G H
Fig. 1: TLS mask
The TLS determined by the following relation according to the mask in figure 1:
R = (E−S) + (H−S) (G−S) + (F−S) + (D−S) + (A−S) + (B−S) + (C−S)
We start to increase the value at the center by one and then check the value of (R) if this value become less than its previous value then we continue to increase the center value at each step with one until we get value of (R) greater than the previous one, at this step we get the final value of the (S) and we have to change the old value of (S) with new one. Otherwise if from the first step when increasing (S) with one we get value of (R) greater than its previous value, at this case we change the process to decrease the (S) value by one and continue to decreases (S) with one at each step until we get (R) value greater than the previous which mean end of process and get the final value to (S). The best result is when we get (R) equal to zero.
V. THE RESULTS
A. Visual Results
Fig.2: A. origin image. B. noisy image with salt & pepper noise. C. image after de-noising using SVD.
D. image after de-noising using SVD+TLS.
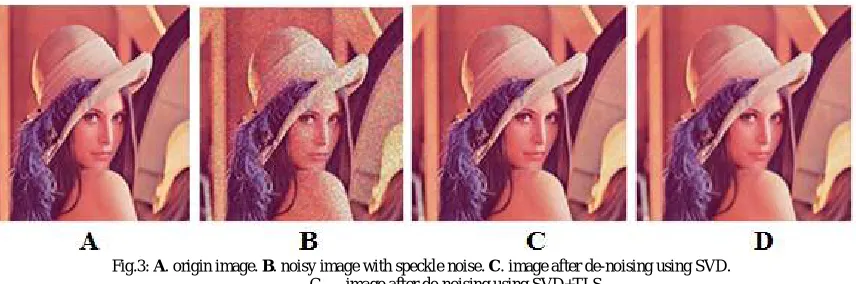
Fig.3: A. origin image. B. noisy image with speckle noise. C. image after de-noising using SVD. C. image after de-noising using SVD+TLS.
In figure 2we choose Lena image and noisy it with salt and pepper noise, while the same image in figure 3 noisy with speckle noise. Both images in figure 2 and 3 noisefirst by using SVD and the result showed in image C, also de-noise them by using SVD followed by TLS as the results showed in D. It is clear the image in D for both figures look better than images in C for both figures 2 and 3.
B. Determine the PSNR
Fi g. 4 : P SN R a ga in s t % o f l ea st va lu e r e m ov e d fr o m dia g o na l ma t r i x, w h e n u s e d ( sa lt a n d p e p p er n oi s e ) wi th ( 0 .0 1 ) n o i s e d e n sit y f or L ea n i ma g e .
Fi g. 5 : P SN R a ga in s t % o f l ea st va lu e r e m ov e d fr o m dia g o na l ma t r i x, w h e n u s e d ( sa lt a n d p e p p er n oi s e ) w it h ( 0 .0 0 1 ) no i s e d e n si ty f or L ea n i ma g e .
Fi g. 7 : P SN R a ga in s t % o f l ea st va lu e r e m ov e d fr o m dia g o na l ma t r i x, w h e n u s e d ( sa lt a n d p e p p er n oi s e ) w it h ( 0 .0 1 ) n oi s e d e n si t y f o r p e p p er i ma g e.
Fi g. 8 : P SN R a ga in s t % o f l ea st va lu e r e m ov e d fr o m dia g o na l ma t r i x, w h e n u s e d ( s p e ck l e) wi t h ( 0 .0 1 ) no i s e d e n si ty f or p e p p er i ma g e. C. Compare (SVD+ TLS) with other methods
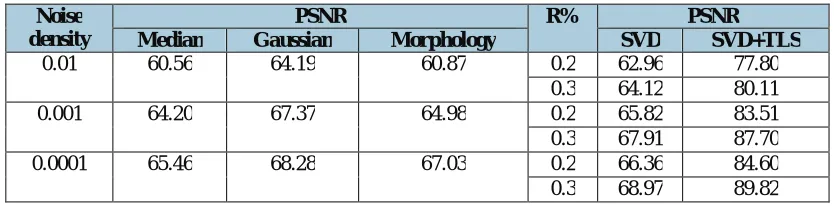
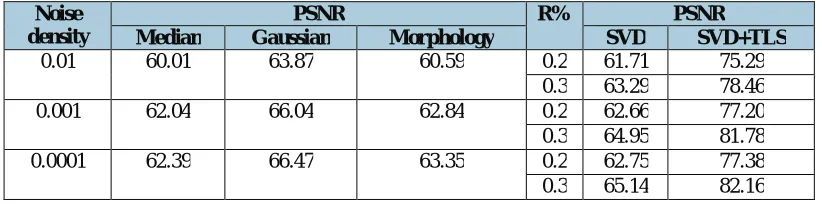
The suggested algorithm comparedthe PSNR with other noise removing methods such as (Median, Gaussian and Morphology). The following tables explain the application of our method and comparisons on RGB(Lena, Baboon and Pepper)images with type noise (Salt and pepper and Speckle).
Table 1: comparing PSNR for different filters (median, Gaussian, Morphology, SVD, and proposed algorithm SVD+TLS), at different salt and pepper noisedensity,when we useddifferent percent of reminder elements in diagonal matrix (R) (0.2 and 0.3). Lena image.
Noise density
PSNR R% PSNR
Median Gaussian Morphology SVD SVD+TLS
Table 2: comparing PSNR for different filters (median, Gaussian, Morphology, SVD, and proposed algorithm SVD+TLS), at different speckle noise density,when we useddifferent percent of reminder elements in diagonal matrix (R) (0.2 and 0.3). Lena image.
Noise density
PSNR R% PSNR
Median Gaussian Morphology SVD SVD+TLS
0.01 60.63 64.27 63.00 0.2 63.60 79.07 0.3 64.89 81.66 0.001 64.22 67.38 66.24 0.2 66.13 84.14 0.3 68.58 89.03 0.0001 65.46 68.27 67.20 0.2 66.40 84.67 0.3 69.05 89.98
Table 3: comparing PSNR for different filters (median, Gaussian, Morphology, SVD, and proposed algorithm SVD+TLS), at different salt and pepper noise density,when we useddifferent percent of reminder elements in diagonal matrix (R) (0.2 and 0.3). Pepper image.
Noise density
PSNR R% PSNR
Median Gaussian Morphology SVD SVD+TLS
0.01 60.36 6397 60.73 0.2 62.90 77.68 0.3 63.98 79.84 0.001 63.94 66.94 64.78 0.2 65.79 83.46 0.3 67.47 86.81 0.0001 65.03 67.76 66.49 0.2 66.45 84.77 0.3 68.50 88.88
Table 4: comparing PSNR for different filters (median, Gaussian, Morphology, SVD, and proposed algorithm SVD+TLS), at different speckle noise density,when we useddifferent percent of reminder elements in diagonal matrix (R) (0.2 and 0.3). Pepper image.
Noise density
PSNR R% PSNR
Median Gaussian Morphology SVD SVD+TLS
0.01 60.85 64.40 63.22 0.2 63.05 77.98 0.3 64.17 80.22 0.001 64.14 67.12 66.13 0.2 66.17 84.21 0.3 68.14 88.16 0.0001 65.06 67.75 66.84 0.2 66.52 84.91 0.3 68.64 89.16
Table 5: comparing PSNR for different filters (median, Gaussian, Morphology, SVD, and proposed algorithm SVD+TLS), at different salt and pepper noise density,when we useddifferent percent of reminder elements in diagonal matrix (R) (0.2 and 0.3). Baboon image
Noise density
PSNR R% PSNR
Median Gaussian Morphology SVD SVD+TLS
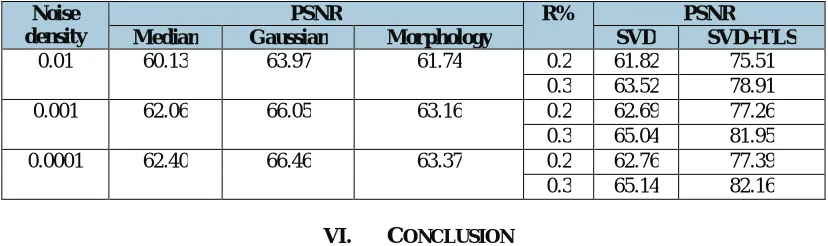
Table 6: comparing PSNR for different filters (median, Gaussian, Morphology, SVD, and proposed algorithm SVD+TLS), at different speckle noise density,when we useddifferent percent of reminder elements in diagonal matrix (R) (0.2 and 0.3). Baboon image.
Noise density
PSNR R% PSNR
Median Gaussian Morphology SVD SVD+TLS
0.01 60.13 63.97 61.74 0.2 61.82 75.51 0.3 63.52 78.91 0.001 62.06 66.05 63.16 0.2 62.69 77.26 0.3 65.04 81.95 0.0001 62.40 66.46 63.37 0.2 62.76 77.39 0.3 65.14 82.16
VI. CONCLUSION
In this paper we improve the image noise removing based on SVD by proposed TLS noise removing filter followed the SVD filter which enhance the image resulted from SVD. The suggested algorithm tested on color images with different type of noise and different density of noise. The combination of SVDwithTLSperform well and highly improve the noise removing for color image.The algorithm tested with different type of noise, different concentration of noise, and different images.Results were promised when compared with other noise removing algorithms such as median, Gaussian, morphology, and SVD.All the tested (visual and PSNR) showed that SVD de-noise enhanced with significant amount when using TLS de-noising after SVD. Also it behave better than other known methods.All the experiments were implemented on RGB images by MATLAB 10, using 2.4 GHz core (TM) i7 processor.
REFRENCES
A. SomkaitUdomhunsakul, “Noise Reduction using adaptive Singular Value Decomposition”, INTERNATIONAL JOURNAL OF CIRCUITS, SYSTEMS AND SIGNAL PROCESSING, Issue 2, Volume 7, 2013.
B. Mythili C., and Kavitha V., "Efficient Technique for Color Image Noise Reduction", The Research Bulletin of Jordan ACM – ISWSA, Vol. I I ( I II ), pp. 41-44, 2011.
C. Kaur P., and Singh J., "A Study Effect of Gaussian Noise on PSNR Value for Digital Images", International Journal of Computer and Electrical Engineering, Vol. 3, No.2, pp. 1793-8163, 2011.
D. Lin Hu, Hong Ma ; Li Cheng, “Method of noise reduction based on SVD and its application in digital receiver front-end”, proceeding in Communications (APCC), 2012 18th Asia-Pacific Conference on , Jeju Island, pp. 511 – 515, 2012, doi: 10.1109/APCC.2012.6388246. E. Patidar P. and Gupta M., "Image De-noising by Various Filters for Different Noise",International Journal of Computer Applications (0975 –
8887), Vol. 9, No.4, pp. 45-50, November 2010.
F. B. Kolman and D. Hill, "Elementary Linear AlgebraWith Applications", Pearson Education, Inc., Ninth Edition, 2008.
BIOGRAPHY
Nidhal El Abbadi, received BSc in Chemical Engineering, BSc in computer science, MSc and PhD in computer science, worked in industry and many universities, he is general secretary of colleges of computing and informatics society in Iraq, reviewer for a number of international journals, has many published papers and three published books, his research interests are in image processing, security, and steganography, He’s Associate Professor in Computer Science in the University of Kufa – Najaf, IRAQ.
Naseer R. M. AlBaka, received his BSc in mathematical from university of Basra at the year 1981, and received his MSc in applied mathematics from the university of Technology at the year 1996. He published many papers. He worked now at the university of Kufa since 1996. Currently he is head of computer science department in Education college.