INVESTIGATION
Consistent and Heritable Alterations of DNA
Methylation Are Induced by Tissue Culture in Maize
Scott C. Stelpflug,* Steven R. Eichten,†Peter J. Hermanson,†Nathan M. Springer,†and Shawn M. Kaeppler*,1 *Department of Agronomy, College of Agricultural and Life Sciences, University of Wisconsin, Madison, Wisconsin 53706, and
†Department of Plant Biology, University of Minnesota, St. Paul, Minnesota 55108
ABSTRACTPlants regenerated from tissue culture and their progenies are expected to be identical clones, but often display heritable molecular and phenotypic variation. We characterized DNA methylation patterns in callus, primary regenerants, and regenerant-derived progenies of maize using immunoprecipitation of methylated DNA (meDIP) to assess the genome-wide frequency, pattern, and heritability of DNA methylation changes. Although genome-wide DNA methylation levels remained similar following tissue cul-ture, numerous regions exhibited altered DNA methylation levels. Hypomethylation events were observed more frequently than hypermethylation following tissue culture. Many of the hypomethylation events occur at the same genomic sites across independent regenerants and cell lines. The DNA methylation changes were often heritable in progenies produced from self-pollination of primary regenerants. Methylation changes were enriched in regions upstream of genes and loss of DNA methylation at promoters was associated with altered expression at a subset of loci. Differentially methylated regions (DMRs) found in tissue culture regenerants overlap with the position of naturally occurring DMRs more often than expected by chance with 8% of tissue culture hypomethylated DMRs overlapping with DMRs identified by profiling natural variation, consistent with the hypotheses that genomic stresses similar to those causing somaclonal variation may also occur in nature, and that certain loci are particularly susceptible to epigenetic change in response to these stresses. The consistency of methylation changes across regenerants from independent cultures suggests a mechanistic response to the culture environment as opposed to an overall loss offidelity in the maintenance of epigenetic states.
C
LONAL propagation of plants and animals is expected to produce individuals identical to the donor. However, this is often not the case. Plant tissue culture involves dediffer-entiation, or return to a“stem-cell-like”state, which involves dynamic reprogramming at the chromatin level to induce the formation of callus. Subsequently, proliferating cells start to redifferentiate when specific changes in the balance of growth regulators are introduced in the culture medium, ultimately leading to organogenesis or regeneration into whole plants (Grafiet al.2011; Miguel and Marum 2011). This process represents a traumatic stress to plant cells and often provokes an array of genetic and epigeneticinstabil-ities that are somatically and meiotically heritable (Phillips et al. 1994; Kaeppleret al. 2000). This suite of molecular and phenotypic phenomena is collectively termed somaclo-nal variation (Larkin and Scowcroft 1981).
At the cellular and molecular levels, somaclonal variation is composed of chromosome rearrangements, polyploidy and aneuploidy, DNA sequence changes, activation of quies-cent transposable elements (TEs), and epigenetic variation reflected by altered DNA methylation patterns (Karp and Maddock 1984; Brettell et al. 1986; Denniset al. 1987; Peschke et al.1987; Armstrong and Phillips 1988; Brown et al.1991; Kaeppleret al.2000). Our current study focuses on genome-wide changes in cytosine methylation.
Direct evidence for heritable epigenetic changes in tissue culture regenerants and their progenies has come from studies on cytosine methylation patterns. RFLP and AFLP technologies have been used to scan methylation patterns following tissue culture in numerous plant species (Kaeppler and Phillips 1993; Jaligot et al.2002; Bednareket al.2007; Schellenbaumet al.2008; Rodriguez Lopezet al.2010). Ad-ditionally, inArabidopsis, methylation levels of chromosome 4
Copyright © 2014 by the Genetics Society of America doi: 10.1534/genetics.114.165480
Manuscript received April 17, 2014; accepted for publication June 30, 2014; published Early Online July 14, 2014.
Supporting information is available online athttp://www.genetics.org/lookup/suppl/ doi:10.1534/genetics.114.165480/-/DC1.
Sequences for RNA-seq expression data are available in the Sequence Read Archive at the National Center for Biotechnology Information (accession no. SRP040690). 1Corresponding author: Department of Agronomy, University of Wisconsin, 1575
were profiled using McrBC-digested DNA on a tiling array, and it was reported that cell suspension culture has a different epigenomic profile compared to wild-type plants, such that certain TEs become hypomethylated and certain genes become hypermethylated (Tanurdzicet al.2008). In contrast, changes in DNA methylation of tissue culture regenerated rice plants are frequently hypomethylation events that are heritable for several generations and are sometimes correlated with changes in gene expression of nearby genes (Stroud et al. 2013).
Heritable epialleles have been characterized in progeny of regenerated plants. For instance, epialleles of thePlocus, which controls cob color in maize, were associated with re-versible hypermethylation of the second intron (Rheeet al. 2010). Interestingly, a naturally occurring epiallele atPhas also been reported (Sekhon et al. 2007), indicating that similar epigenetic responses to stress that occur in tissue cultured cells may also occur in plants grown in thefield.
To investigate the effect that tissue culture processes have on DNA methylation patterns in regenerated maize plants and their progenies, we generated genome-wide maps of DNA methylation patterns, of callus, regenerated plants, and progeny of regenerated plants using meDIP. We deter-mined that methylation changes in tissue culture are frequent, and a portion of these DNA methylation changes is heritable through sexual generations.
Materials and Methods
Tissue culture and regeneration
Immature zygotic embryos were harvested from donor plants of maize genotype A188 ears, 10–12 days after polli-nation (DAP). The culture process was as described by Frame et al.(2011) with minor modifications. Briefly, ears were surface sterilized for 20 min in 50% (v/v) commercial bleach and sterilized deionized water plus one drop of Tween 20 and rinsed in sterilized deionized water three times, 5 minutes per rinse. Immature embryos were har-vested with aflame-sterilized spatula in a sterilized, ethanol-washed fume hood, and plated, embryo axis-side down, onto Chu’s N6 initiation/maintenance media (Chu et al. 1975) with modifications to initiate calli formation ( Sup-porting Information). Cultures were grown at 28 6 1° in darkness for a total of 6 months from the date of embryo plating with regular subculture approximately every 2 weeks; embryogenic callus was selected at each subculture to maintain the cultures. After 6 months in culture, embryo-genic calli were selected and subcultured on modified R1 media for 2 weeks at 286 1°in darkness, and were sub-sequently transferred to modified R2 media for 2 weeks at 286 1°under a 16-hr photoperiod for plant regeneration (Supporting Information). Individual plantlets were trans-planted into magenta boxes filled with R2 media for10 days until viable roots were established. Plants were then removed from the media, rinsed with tap water, and
trans-planted into degradable peat pots in the greenhouse and grown under standard conditions.
Plant materials and DNA isolation
Maize plants (A188 genotype) were grown at the Walnut Street Greenhouse (University of Wisconsin, Madison, WI). The growing conditions were 27°-day and 24°-night temper-atures with 15 hr light and 9 hr dark (6:00AMto 9:00PM). Maize plants were watered daily as needed. Callus used for DNA extraction was collected from each cell line prior to plating onto R1media after 6 months of culturing. The
up-permostflag leaf of R0plants and the 3rd leaf of R1plants
were harvested for DNA extraction to conduct meDIP-ChIP profiling. All tissues were immediatelyflash frozen in liquid N2. DNA was isolated using a modified CTAB method
(Saghai-Maroof et al.1984).
meDIP-ChIP epigenomic profiling and qPCR assays
Whole-genome profiling of DNA methylation was performed to document changes in DNA methylation following tissue culture. DNA was isolated from three different sibling plants of genotype A188 that had not been subjected to tissue culture to serve as controls. Four independent cultures were initiated from immature embryo tissue (10–12 DAP) and multiple primary regenerants were derived from these two cultures and grown in greenhouse conditions to isolate leaf tissue from the same stage as the control plants. DNA meth-ylation levels were profiled by immunoprecipitation of methylated DNA followed by hybridization to an oligonucle-otide microarray as described previously (Eichten et al. 2011). Methyl-sensitive qPCR assays were performed as de-scribed according to a previous study (Li et al. 2014). Pri-mers used for qPCR are listed inTable S1.
RNA isolation and calculation of RNA-seq expression values
The uppermost ear leaf of R1plants was harvested for RNA
2009) and the splice site aware aligner TopHat version 1.2.0 (Trapnell et al.2009). The minimum and maximum intron length was set to 5 bp and 60,000 bp, respectively; all other parameters were set to the default values. Gene model an-notation was not provided during the read mapping. Nor-malized gene expression values expressed as fragments per kilobase pair of exon model per million fragments mapped (FPKM) were determined using Cufflinks version 0.9.3 (Trapnell et al. 2010) with the 2G and 2r option. The maximum intron length was set to 60,000 bp and the quar-tile normalization option was used. The default settings were used for all other parameters.
Results
Discovery of tissue-culture-induced differentially methylated regions
DNA methylation profiles of maize-embryo-derived callus, regenerated plants, and noncultured control plants were evaluated to assess the frequency and nature of methyla-tion variamethyla-tion induced by the stress of tissue culture. Four independent cell cultures, each originating from an in-dependent immature embryo, were initiated from the maize inbred A188. The independent cultures were named cell lines (CLs) -3, -4, -5, and -8, and multiple R0 plants
were regenerated from each of these cell lines. The ear leaf was collected from six independent regenerated plants from CL-3, one plant from CL-4, six plants from CL-5, and two plants from CL-8. Primary regenerants (R0plants)
were named with their CL number listedfirst, followed by hyphens, and then R0 plant number (e.g., R0 plant 3-4 is
the fourth progeny derived from CL-3). In addition, the corresponding ear leaf was collected from three different control A188 plants, which were sibling plants originating from the same seed source and were not subjected to tissue culture. Whole-genome profiling of DNA methylation was performed using meDIP followed by hybridization to an oligonucleotide microarray (Eichten et al. 2011). A com-parison of the DNA methylation profiles for the three con-trol plants did not identify any differentially methylated regions (DMRs) between the sibling plants. However, a comparison of the DNA methylation profiles from plants that had been subjected to tissue culture to the average of the nontissue culture controls identified a number of DMRs.
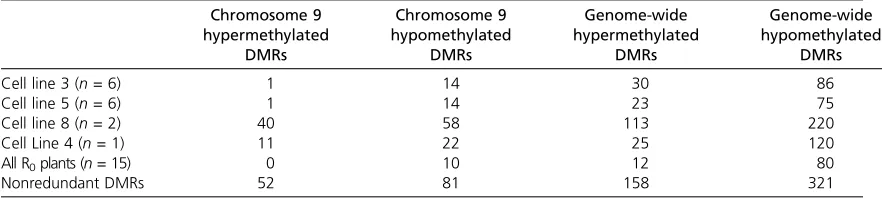
DMRs were identified by comparing the average DNA methylation level for all regenerants from the same CL with the control samples or by comparing the average methylation level of all regenerants with the average methylation level of the controls as determined by meDIP
(Table 1 andTable S3). The scan for DMRs was run sepa-rately for chromosome 9 and genome-wide as chromosome 9 had a higher probe density than the rest of the genome. In total, 479 DMRs were discovered in the genome-wide scan, and zero DMRs were detected between the three
non-cultured control samples. Many of the DMRs exhibit con-sistent changes in all samples subjected to tissue culture relative to controls (Figure 1, A and B). A greater propor-tion of DMRs had hypomethylapropor-tion in the regenerated plants relative to the controls (67% of genome-wide DMRs, 61% of chromosome 9 DMRs) as opposed to hypermethy-lation events. Plants regenerated from CL-8 and CL-4 exhibited a higher number of DMRs than CL-3 and CL-5. This higher rate may reflect biological differences or may be a technical artifact resulting from lower sampling of these two cell lines and less robust average values for call-ing DMRs. A separate DMR scan was conducted uscall-ing the full set of probes for chromosome 9, which provides about four times higher probe density for this chromosome ( Fig-ure S1). This analysis with higher probe density identified the same DMRs as the lower resolution genome-wide scan and also identified additional DMRs. These additional DMRs had similar lengths but were identified due to in-creased statistical power provided by the additional probe density. This suggests that there are likely additional DMRs that are present on other maize chromosomes but not cap-tured in our scan due to probe density.
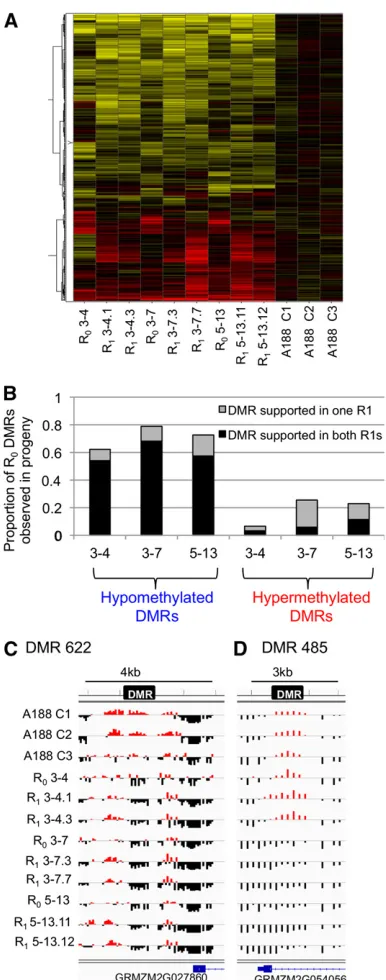
Hierarchical clustering analysis based on DNA methyl-ation levels in each regenerated plant and in the control plants revealed that many of the DMRs exhibit consis-tent changes in multiple plants and in multiple cell lines (Figure 1C andFigure S1). Overall, there were 92 robust genome-wide DMRs that were identified in all CLs relative to the controls (Table 1), indicating that certain regions of the genome are consistently exhibiting DNA methylation alterations in tissue culture and these are heavily biased toward hypomethylation events. The number of CLs that support each of the DMRs was assessed for all DMRs found in at least one CL (Figure 1D). The DMRs that are hypomethylated in regenerated plants compared to the controls are more frequently observed in multiple CLs (75% of DMRs), and over one-third of them are ob-served in all four CLs (Figure 1D). In contrast, the major-ity (53%) of the hypermethylated DMRs are only observed in one of the various CLs, indicating that hypermethylated DMRs are comparatively more stochastic events in tissue culture.
The use of meDIP-array profiling does not allow the discrimination of different types of DNA methylation. Several recent studies have used whole-genome bisulfite sequencing to document genome-wide patterns of DNA methylation in CG, CHG, and CHH sequence contexts in the maize inbred B73 (Eichtenet al.2013; Gentet al.2013; Regulski et al. 2013). To understand what types of DNA methylation were being affected by tissue culture, we assessed the level of CG, CHG, and CHH methylation levels for the genomic regions that are hypomethylated following tissue culture using the B73 data from Eichtenet al.(2013). Approximately one-third (46/144) of the tissue culture hypomethylated DMRs contain high levels of CG and/or CHG methylation in B73 seedling tissue. None of these DMRs had levels of CHH methylation .2%. This suggests that many of the tissue culture hypomethylated DMRs are not active targets of de novo methylation in leaf tissue of B73.
Many tissue culture DMRs are heritable
DMRs could occur in tissue culture and be somatically heritable through regeneration, or alternatively, they could arise during the regeneration process. To test these possi-bilities, DNA methylation levels in a sample of callus tissue from CL-3 were profiled and included in the clustering (Figure 1C andFigure S3). The callus sample clustered to-gether with samples from regenerated plants of CL-3, sug-gesting that most of the methylation changes observed in tissue from regenerated plants are already present in callus tissue prior to regeneration.
We next investigated the heritability of the DNA methylation changes observed in the R0plants by
examin-ing methylation profiles of several R1 plants, which were
generated by self-pollination of the primary regenerants. Whole-genome profiling of DNA methylation levels was performed for two R1 offspring resulting from the
self-pollination of three R0plants; plant 4 (offspring termed
3-4.1 and 3-4.3), plant 3-7 (termed 3-7.3 and 3-7.7), and plant 5-13 (termed 5-13.11 and 5-13.12). In addition, methyl-sensitive qPCR was used to assess DNA methylation changes at seven of the DMRs in a larger number of R0and
R1plants (Figure 3 and Figure S4). The relative levels of
DNA methylation were profiled in 7 control plants, 5 cell lines (callus tissue), 11 additional R0 plants and 24 R1
plants that include multiple sibling offspring of 4 different R0plants. Clustering of DNA methylation levels at DMRs
for the R1plants, the parental R0plants, and the controls
reveals that many of the hypomethylated DMRs observed in R0plants are stably inherited in the R1progeny (Figure
2A and Figure S3). The majority (60% averaged across all 3 R0plants tested) of hypomethylated DMRs present in
the R0plants were detected in both offspring, while a much
smaller portion (7% across all 3 R0’s) of hypermethylated
DMRs were stably inherited in both R1 offspring (Figure
2B). The analysis of DNA methylation levels in the off-spring of different R0plants provide examples of relatively
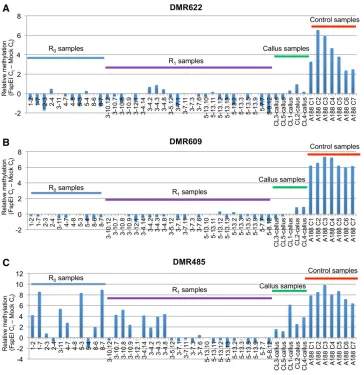
consistent DMRs that are heritable, as well as examples that show incomplete penetrance and segregation (Figure 2, C and D and Figure 3). Some DMRs, such as DMR622 and DMR609, show highly consistent effects in all R0and
R1 plants relative to controls (Figure 2C and Figure 3, A
and B). Other DMRs, exemplified by DMR485 (Figure 2B and Figure 3C) exhibit loss of DNA methylation in some samples but not others. In general, the R0plants that have
reduced DNA methylation levels for this region generate offspring that show similar reduced levels of DNA methyl-ation. However, there are examples of R0 plants without
reduced DNA methylation and some families of R1plants
appear to exhibit segregation for DNA methylation levels (Figure 3). Combined, these results provide evidence for stable inheritance of many hypomethylation DMRs induced by tissue culture and provide evidence that some of these events may show variable behavior in R1siblings that could
be explained by heterozygosity for DNA methylation state in some R0plants.
Characterization of tissue culture DMR location and effects on gene expression
The DMRs were characterized to determine whether they were preferentially located near genes or transposable elements (Figure 4). The location of hypo- or hypermethy-lated DMRs was compared to annotated maize genes (Fig-ure 4A). In addition, we generated a control set of 10,000 randomly generated pseudo-DMRs by selecting sets of ad-jacent probes that have similar sizes relative to the actual DMRs. Permutation analysis of the random probe sets (100 sets of 500 random probe sets) was used to assess signifi -cance for the genomic context of hypo- or hypermethylated
Table 1 DMRs in primary regenerants
Chromosome 9 hypermethylated DMRs Chromosome 9 hypomethylated DMRs Genome-wide hypermethylated DMRs Genome-wide hypomethylated DMRs
Cell line 3 (n= 6) 1 14 30 86
Cell line 5 (n= 6) 1 14 23 75
Cell line 8 (n= 2) 40 58 113 220
Cell Line 4 (n= 1) 11 22 25 120
All R0plants (n= 15) 0 10 12 80
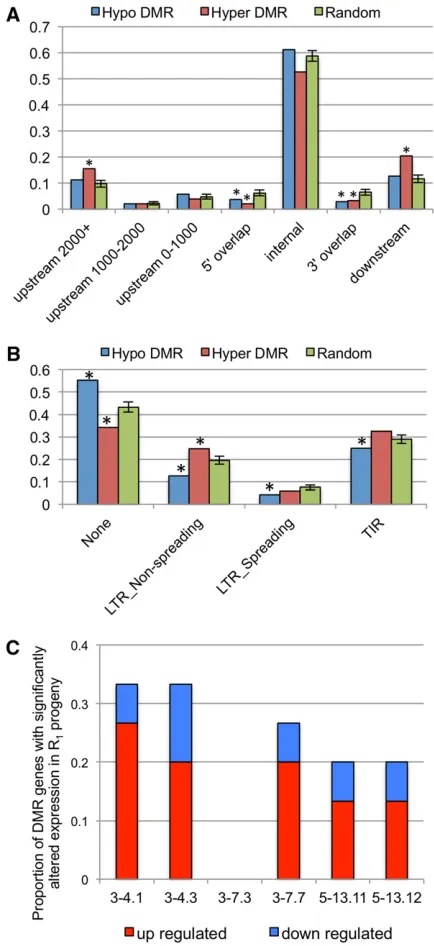
DMRs. Both the hypo- and hypermethylated DMRs are de-pleted for overlapping the 59 or 39 end of maize genes (Figure 4A), and only the hypermethylated DMRs are enriched for being located .2000 bp upstream of genes or 39of genes (Figure 4A). It is possible that the tissue-culture-induced DMRs reflect processes targeted to TEs. For each DMR, the nearest TE was identified using the MTED annotation of TEs (Schnableet al.2009). The hypo-methylated DMRs are enriched for not having any TEs within 500 bp relative to randomly selected regions (Figure 4B). In contrast, the hypermethylated DMRs are enriched for being located near nonspreading LTR elements (Figure 4B). Additionally, we assessed the biological function and tissue-specific expression patterns for genes located near DMRs. There was no evidence for significant enrichment of specific biological processes or Gene Ontology (GO) terms among the genes located near hypomethylated or hypermethylated DMRs. Similarly, the genes located near DMRs do not show enrichment for particular tissue-specific expression patterns.
It is possible that loci epigenetically sensitive to tissue-culture stress also exhibit variability in natural popula-tions. To examine this possibility, tissue culture DMRs were compared to naturally variable DMRs (n = 3720) in 51 maize genotypes that had not been subjected to tissue cul-ture (Eichten et al.2013). The overlap between the tissue culture DMRs identified in this study and the 3720 DMRs identified as examples of natural variation was significant (P ,0.01, based on a permutation test of random sets of
DMRs being compared to the tissue culture DMRs) but lim-ited, as 8.7% of the hypomethylated tissue culture DMRs and 5.7% of the hypermethylated tissue culture DMRs overlap with the natural variation DMRs among different maize geno-types. The DNA methylation levels in other maize inbreds are often more similar to the control A188 plants than the R0
plants (Figure 1, A and B). The average DNA methylation level in the diverse noncultured genotypes was compared to the average level for the A188 controls and for the R0plants
for all hypo- or hypermethylated DMRs. Diverse nonre-generated maize lines exhibit average DNA methylation levels that are similar to the control A188 plants for 63% of the hypomethylated DMRs and levels that are similar to the R0
A188 plants for 21% of the hypomethylated DMRs, while the remaining 16% of hypomethylated DMRs have intermediate DNA methylation levels in other maize lines (Figure S5). This suggests that for the majority of hypomethylated DMRs, the DNA methylation state that results from tissue culture is un-usual. However, a significant portion of these hypomethylated DMRs (21%) from tissue culture exist in this hypomethylated state in natural maize populations, potentially indicating that these loci are more prone to epigenetic variation naturally (Figure S5). For the hypermethylated DMRs, the control plants are similar to diverse maize lines at 25% of the regions, and the R0plants are more similar to diverse maize lines at
53% of the DMRs.
RNA-seq was performed on leaf tissue from the same R1
plants used to assess heritability of DNA methylation differences. We found that loss of methylation at promoters (defined at the
Figure 1 DMRs in plants regenerated from tissue culture. (A and B) Two examples of DMRs are shown. The relative level of DNA methylation is shown
for each of the controls (A188 C1-3) and R0plants. Black indicates low methylation; red indicates higher levels of DNA methylation. These regions show
high levels of DNA methylation in all control plants but show reduced levels of DNA methylation in many of the regenerated plants. The scale for each of the images and the location of the DMR is shown near the top. The tracks near the bottom show the level of methylation in B73 and Mo17 plants and
the genes located near the DMRs. (C) Hierarchical clustering of DNA methylation levels for genome-wide DMRs in all plants (n= 479). The level of DNA
methylation for each regenerant and control plant relative to the average of the three control plants was calculated and used to perform hierarchical
clustering (Ward’s method). The heatmap coloring indicates hypermethylation (red) or hypomethylation (yellow) relative to the control. (D) The
1 kb 59of the transcription start site (TSS), 15 genes with hypo-DMRs) was associated with aberrant expression levels of 23% of genes, averaged across all R1plants (Figure 4C andTable S4).
This proportion was higher than the percentage of all genes genome-wide that fit these criteria (15%). Hypomethylation was more frequently associated with up-regulation of gene ex-pression (71.4% of genes) as opposed to down-regulation of gene expression (28.6% of genes), which was substantially higher than the average genome-wide rate of up-regulation of differentially expressed genes (52%). Unlike the Stroud et al. (2013) study in rice, we did not find evidence that the DMRs located particularly close to the TSS were more likely to be associated with altered expression. The majority (81%) of the misregulated hypo-DMR genes had confirmed heritable DMRs in the R1generation. The analysis of the R1transcriptome
sug-gests that tissue culture can have heritable effects upon gene expression level for some genes located near hypomethylated DMRs.
Discussion
In this study we have investigated the effect that the tis-sue culture process has on genome-wide DNA methylation patterns of regenerated plants by generating profiles of DNA methylation in multiple R0 plants generated from an
inbred line. Somaclonal variation has been well character-ized in a number of plants species, and generally results in the occurrence of unexpected phenotypes in progeny that arise from tissue culture (Kaeppler and Phillips 1993; Kaeppler et al. 2000; Thorpe 2006; Rheeet al. 2010; Miguel and Marum 2011; Neelakandan and Wang 2012). The rate of occurrence of aberrant phenotypes is higher than observed for normally propagated plants and appears to reflect a higher“mutagenic”rate during tissue culture. Detailed char-acterization of particular somaclonal variants has revealed evidence for novel TE insertions as well as epigenetic changes (Rheeet al.2009, 2010). It is worth noting that the consistent DNA methylation changes observed in this study and in a prior study in rice (Stroudet al.2013) would predict a tissue culture“syndrome”that would be observed in many of the plants regenerated from culture. However, this is generally not observed. Instead, most phenotypic abnormalities are only observed in a subset of plants and often segregate as recessive alleles. This may suggest that the hypomethylation events, which are consistent among regenerants and may result in gain-of-function alleles, are unlikely to be related to phenotypic somaclonal variation. Instead, the more stochastic hypermethylation events may explain some of the somaclonal variation observed follow-ing tissue culture.
Our results are consistent with previous studies that assessed specific genomic regions (Kaeppler and Phillips 1993; Zhang et al. 2009; Linacero et al. 2011; Gonzalez
Figure 2 The majority of hypomethylation observed in R0plants is
her-itable to R1progeny. DNA methylation patterns are shown in R1plants.
(A) Hierarchical clustering of the level of DNA methylation for each of the
genome-wide DMRs in three R0plants and for two R1progeny derived by
self-pollination for each of these three plants. The values were normalized by comparing them to the average of the three control (nontissue culture) plants. The DNA methylation level for these DMRs in the three controls is also shown. (B) The DMRs that show altered methylation level in each of
the R0plants relative to the controls was determined. The proportion of
these DMRs that were supported by only one of the R1plants (gray) or
both of the R1plants (black) was determined for each of the three
fam-ilies. The hypomethylation DMRs were generally heritable and observed in both progeny. In contrast, the hypermethylation DMRs were not often inherited. (C and D) Several examples of DMRs are shown for the control
plants, the three R0parents, and two R1 offspring for each of the R0
plants. The location of the DMR and scale are indicated near the top of each image and the blue symbols near the bottom indicate genes. The
et al.2013) and with a recent genome-wide analysis of rice plants regenerated from tissue culture (Stroudet al.2013). The bulk of DNA methylation is not affected by tissue cul-ture. However, a subset of genomic regions exhibit altered DNA methylation levels. Similar to a recent study in rice (Stroudet al.2013), we found that losses of DNA methyla-tion following tissue culture are more common than gains of DNA methylation. In general, we hypothesize that similar phenomena are affecting somaclonal variation within both maize and rice. In both species, embryogenic callus was induced from scutellum tissue of immature embryos. It could be possible that different methods of tissue culture affect methylation patterns differently, as suspension culture of Arabidopsis caused a prevalence of DNA methylation increases in genic regions as opposed to losses (Bednarek et al. 2007; Tanurdzicet al.2008). Interestingly, numerous DMRs are consistently found in many independent lines and these appear to reflect homozygous changes that occur to both alleles during tissue culture. Contrarily, there are also a number of DMRs that exhibit stochastic behavior or in-complete penetrance. The analysis of R1descendants reveals
that the majority of hypomethylation events are heritable. BNL5.09, one of the genomic regions identified as exhibiting
altered DNA methylation via RFLP analysis (Kaeppler and Phillips 1993) was also found in our study as a consistently hypomethylated DMR (DMR666).
The molecular mechanism that results in altered DNA methylation is not clear. It is possible that the loss of DNA methylation reflects the absence of cellular machinery that maintains DNA methylation patterns in some cell types, as suggested by previous studies (Zhang et al. 2009; Wang et al.2013). However, the fact that the majority of genomic regions maintain their DNA methylation levels in culture would argue against these broad effects. An alternative ex-planation is that DNA demethylation machinery could be targeted to specific genomic regions during tissue culture consistent with previous reports (Zhang et al. 2013). The fact that the tissue-culture-induced DMRs are observed in callus samples as well as R0plants suggests that many of the
DNA methylation changes occur early in the tissue culture process. However, it is possible that some of the changes with incomplete penetrance may be the result of on-going processes during culture.
The functional consequences of altered DNA methylation during tissue culture are not clear. Tissue culture DMRs do not exhibit strong enrichments for location relative to genes
Figure 3 Validation of the heritability of tissue culture-induced DMRs (Panels are example DMRs; A is DMR622, B is DMR609, and C is DMR485). Three of the tissue-culture-induced hypomethyla-tion DMRs that were validated by methyl-sensitive qPCR were further
pro-filed in additional samples (four
addi-tional validated DMRs are pictured in Figure S4). For each sample, the value shows the difference in Ctfor amplifi
ca-tion with and without the methylaca-tion dependent enzyme FspEI. Higher values reflect high levels of DNA methylation; low values reflect low methylation. The
samples include 11 additional R0
sam-ples, 24 R1samples,five callus samples
and seven control plants not subjected
to tissue culture. The 24 R1samples
in-clude four plants siblings each from
three families (parent plants R0 3-10,
R03-4, and R03-7) and eight siblings
or transposons. Only a subset (23%) of genes located near tissue culture DMRs in maize exhibit altered expression lev-els. It is possible that this process of altered DNA methyla-tion plays an important role at a subset of the DMRs and that the other regions with altered methylation have limited consequences. One interpretation is that the tissue culture DMRs do not reflect a process that is critical for somaclonal variation but instead reflect an initial process that is required for culturing plant cells. Remodeling of chromatin at specific sites may play a critical role in passaging cells into culture. These changes may be heritable but only play an important role at early stages of tissue culture. An intriguing corollary to this scenario is that preexisting difference in chromatin may influence the culturability of different genotypes. Many plant species exhibit intraspecific variation for the ability to grow in tissue culture and regenerate fertile plants. Varia-tion in chromatin state of critical genes among different individuals could contribute to differences in the culturabil-ity. A significant, albeit small (8.6%), proportion of DMRs overlap with DMRs identified in a previous study (Eichten et al. 2013) that are due to natural variation in 51 maize genotypes, indicating natural variation for DNA methylation state at a number of tissue-culture DMRs. These may be loci that are epigenetically sensitive in natural populations un-der field growth conditions, potentially as a mechanism to dynamically and heritably respond to stress.
In summary, our results indicate that production of plants using tissue culture produces an epigenetic footprint in re-generated plants that is stable over multiple generations. Specific chromosomal regions are specifically sensitive to the stress, and similar variation occurs across independent cultures. Methylation variation in tissue culture is frequent compared to sexually derived progenies, but does not result in a tissue culture syndrome, which would be reflected by similar phenotypic alterations due to consistently altered genomic sites. Nevertheless, altered methylation patterns are often heritable through sexual generations, and some of these changes may contribute to heritable phenotypic changes in tissue-culture-derived progenies.
Acknowledgments
Brieanne Vaillancourt and Robin Buell (Michigan State University) generated FPKM values from the RNA-seq data. Stella Salvo helped generate initial embryogenic callus explants and Adam Bolton assisted in the laboratory. The authors also thank Steven Jacobsen for his valuable insight. This project was supported by Agriculture and Food Re-search Initiative competitive grant no. 2011-67013-30037 from the United States Department of Agriculture (USDA)
Figure 4 Characterization of genomic context of tissue culture DMRs and misregulated expression of DMR genes. (A) The location of each of the tissue culture DMRs (hypomethylated or hypermethylated) was assessed relative to maize genes. In addition, a set of 10,000 randomly created DMRs was generated using our probe spacing to assess enrich-ment for localization of DMRs relative to genes. The standard deviation for the random values was determined by calculating the proportion of the random probe sets in each category for 100 subsamples of 500
random sets. The“*”above bars indicates values that are significantly
(P,0.05) different from the values observed for random probes sets.
(B) The location of each DMR was compared to the nearest annotated
transposable element. The nearest elements were classified as terminal
inverted repeat (TIR) elements, LTR_spreading, or LTR_nonspreading. The spreading or nonspreading is based upon the assignments from a pre-vious study in which some families of LTR elements were found to result
in spread of DNA methylation to low-copyflanking sequences (Eichten
et al.2012). The error bars and significance (“*”) of the random sets of probes were determined in the same method used in A. (C) The
pro-portion of hypo-DMR genes #1 kb from TSSs that have significantly
altered expression levels in R1progeny relative to the average FPKM of
National Institute of Food and Agriculture. S.C.S. was supported in part by the National Institute of Food and Agriculture, USDA Hatch funding (WIS01645).
Literature Cited
Armstrong, C. L., and R. L. Phillips, 1988 Genetic and cytoge-netic variation in plants regenerated from organogenic and friable, embryogenic tissue-cultures of maize. Crop Sci. 28: 363–369.
Bednarek, P. T., R. Orlowska, R. M. Koebner, and J. Zimny, 2007 Quantification of the tissue-culture induced variation in barley (Hordeum vulgare L.). BMC Plant Biol. 7: 1–9.
Brettell, R. I. S., E. S. Dennis, W. R. Scowcroft, and W. J. Peacock, 1986 Molecular analysis of a somaclonal mutant of maize alcohol dehydrogenase. Mol. Gen. Genet. 202: 235–239. Brown, P. T. H., E. Gobel, and H. Lorz, 1991 RFLP analysis ofZea
mayscallus cultures and their regenerated plants. Theor. Appl. Genet. 81: 227–232.
Chu, C. C., C. C. Wang, C. S. Sun, H. Chen, K. C. Yin et al., 1975 Establishment of an efficient medium for anther culture of rice through comparative experiments on the nitrogen-Sour-ces. Sci. Sin. 18: 659–668.
Dennis, E. S., R. I. S. Brettell, and W. J. Peacock, 1987 A tissue-culture induced Adh1 null mutant of maize results from a single base change. Mol. Gen. Genet. 210: 181–183.
Eichten, S. R., R. A. Swanson-Wagner, J. C. Schnable, A. J. Waters, P. J. Hermanson et al., 2011 Heritable epigenetic variation among maize inbreds. PLoS Genet. 7: e1002372.
Eichten, S. R., N. A. Ellis, I. Makarevitch, C. T. Yeh, J. I. Gent
et al., 2012 Spreading of heterochromatin is limited to specific families of maize retrotransposons. PLoS Genet. 8: e1003127.
Eichten, S. R., R. Briskine, J. Song, Q. Li, R. Swanson-Wagneret al., 2013 Epigenetic and genetic influences on DNA methylation variation in maize populations. Plant Cell 25: 2783–2797. Frame, B., M. Main, R. Schick, and K. Wang, 2011 Genetic
trans-formation using maize immature zygotic embryos. Methods Mol. Biol. 710: 327–341.
Gent, J. I., N. A. Ellis, L. Guo, A. E. Harkess, Y. Yao et al., 2013 CHH islands: de novo DNA methylation in near-gene chromatin regulation in maize. Genome Res. 23: 628–637. Gonzalez, A., A. Saiz, A. Acedo, M. Ruiz, and C. Polanco,
2013 Analysis of genomic DNA methylation patterns in regen-erated and control plants of rye (Secale cereale L.). Plant Growth Regul. 70: 227–236.
Grafi, G., A. Florentin, V. Ransbotyn, and Y. Morgenstern, 2011 The stem cell state in plant development and in response to stress. Front. Plant Sci. 2: 53.
Jaligot, E., T. Beule, and A. Rival, 2002 Methylation-sensitive RFLPs: characterisation of two oil palm markers showing soma-clonal variation-associated polymorphism. Theor. Appl. Genet. 104: 1263–1269.
Kaeppler, S. M., and R. L. Phillips, 1993 Tissue culture-induced DNA methylation variation in maize. Proc. Natl. Acad. Sci. USA 90: 8773–8776.
Kaeppler, S. M., H. F. Kaeppler, and Y. Rhee, 2000 Epigenetic aspects of somaclonal variation in plants. Plant Mol. Biol. 43: 179–188.
Karp, A., and S. E. Maddock, 1984 Chromosome variation in wheat plants regenerated from cultured immature embryos. Theor. Appl. Genet. 67: 249–255.
Langmead, B., C. Trapnell, M. Pop, and S. L. Salzberg, 2009 Ultrafast and memory-efficient alignment of short DNA sequences to the human genome. Genome Biol. 10: R25.
Larkin, P. J., and W. R. Scowcroft, 1981 Somaclonal variation: a novel source of variability from cell cultures for plant improve-ment. Theor. Appl. Genet. 60: 197–214.
Li, Q., S. R. Eichten, P. J. Hermanson, and N. M. Springer, 2014 Inheritance patterns and stability of DNA methylation variation in maize near-isogenic lines. Genetics 196: 667–676. Linacero, R., J. Rueda, E. Esquivel, A. Bellido, A. Domingo et al.,
2011 Genetic and epigenetic relationship in rye, Secale cereale L., somaclonal variation within somatic embryo-derived plants. In Vitro Cell. Dev. Biol. Plant 47: 618–628.
Miguel, C., and L. Marum, 2011 An epigenetic view of plant cells cultured in vitro: somaclonal variation and beyond. J. Exp. Bot. 62: 3713–3725.
Neelakandan, A. K., and K. Wang, 2012 Recent progress in the understanding of tissue culture-induced genome level changes in plants and potential applications. Plant Cell Rep. 31: 597– 620.
Peschke, V. M., R. L. Phillips, and B. G. Gengenbach, 1987 Discovery of transposable element activity among prog-eny of tissue culture-derived maize plants. Science 238: 804– 807.
Phillips, R. L., S. M. Kaeppler, and P. Olhoft, 1994 Genetic insta-bility of plant tissue cultures: breakdown of normal controls. Proc. Natl. Acad. Sci. USA 91: 5222–5226.
Regulski, M., Z. Lu, J. Kendall, M. T. Donoghue, J. Reinderset al., 2013 The maize methylome influences mRNA splice sites and reveals widespread paramutation-like switches guided by small RNA. Genome Res. 23: 1651–1662.
Rhee, Y., H. Lin, R. Buell, K. Childs, and S. Kaeppler, 2009 A c2 allele of maize identified in regenerant-derived progeny from tissue culture results from insertion of a novel transposon. Maydica 54: 429–437.
Rhee, Y., R. S. Sekhon, S. Chopra, and S. Kaeppler, 2010 Tissue culture-induced novel epialleles of a Myb transcription factor encoded by pericarp color1 in maize. Genetics 186: 843–855. Rodriguez Lopez, C. M., A. C. Wetten, and M. J. Wilkinson,
2010 Progressive erosion of genetic and epigenetic variation in callus-derived cocoa (Theobroma cacao) plants. New Phytol. 186: 856–868.
Saghai-Maroof, M. A., K. M. Soliman, R. A. Jorgensen, and R. W. Allard, 1984 Ribosomal DNA spacer-length polymorphisms in barley: Mendelian inheritance, chromosomal location, and pop-ulation dynamics. Proc. Natl. Acad. Sci. USA 81: 8014–8018. Schellenbaum, P., V. Mohler, G. Wenzel, and B. Walter,
2008 Variation in DNA methylation patterns of grapevine so-maclones (Vitis vinifera L.). BMC Plant Biol. 8: 78–87. Schnable, P. S., D. Ware, R. S. Fulton, J. C. Stein, F. Weiet al.,
2009 The B73 maize genome: complexity, diversity, and dy-namics. Science 326: 1112–1115.
Sekhon, R. S., T. Peterson, and S. Chopra, 2007 Epigenetic mod-ifications of distinct sequences of the p1 regulatory gene specify tissue-specific expression patterns in maize. Genetics 175: 1059–1070.
Stroud, H., B. Ding, S. A. Simon, S. Feng, M. Bellizzi et al., 2013 Plants regenerated from tissue culture contain stable epigenome changes in rice. eLife 2: e00354.
Tanurdzic, M., M. W. Vaughn, H. Jiang, T. J. Lee, R. K. Slotkin
et al., 2008 Epigenomic consequences of immortalized plant cell suspension culture. PLoS Biol. 6: 2880–2895.
Thorpe, T. A., 2006 History of plant tissue culture. Methods Mol. Biol. 318: 9–32.
Wang, X. R., R. Wu, X. Y. Lin, Y. Bai, C. D. Songet al., 2013 Tissue culture-induced genetic and epigenetic alterations in rice pure-lines, F1 hybrids and polyploids. BMC Plant Biol. 13: 77. Zhang, H., Z. Y. Ma, L. Zeng, K. Tanaka, C. J. Zhang et al.,
2013 DTF1 is a core component of RNA-directed DNA meth-ylation and may assist in the recruitment of Pol IV. Proc. Natl. Acad. Sci. USA 110: 8290–8295.
Zhang, M., C. Xu, H. Yan, N. Zhao, D. von Wettstein et al., 2009 Limited tissue culture-induced mutations and linked epi-genetic modifications in F1 hybrids of sorghum pure lines are accompanied by increased transcription of DNA methyltrans-ferases and 5-methylcytosine glycosylases. Plant J. 57: 666–679.
GENETICS
Supporting Information
http://www.genetics.org/lookup/suppl/doi:10.1534/genetics.114.165480/-/DC1
Consistent and Heritable Alterations of DNA
Methylation Are Induced by Tissue Culture in Maize
Scott C. Stelpflug , Steven R. Eichten , Peter J. Hermanson , Nathan M. Springer, and Shawn M. Kaeppler
Figure S1 Hierarchical clustering of DNA methylation levels for chromosome 9 DMRs in all plants. The level of DNA
methylation for each regenerant and control plant relative to the average of the control plants was calculated and
used to perform hierarchical clustering (Ward’s method).
Figure S2 Validation of tissue culture induced DMRs. Fifteen of the DMRs were selected for validation using methyl‐
sensitive qPCR on the same samples used for meDIP profiling. For this assay, qPCR was performed using primers
targeted to DMRs after treatment of each sample with methylation dependent restriction enzyme FspEI or a mock
digest using glycerol. The relative amplification rate for the digest and mock treatment (FspEI Ct – Mock digest Ct)
reflects DNA methylation levels. Higher values are associated with DNA methylation as the FspEI enzyme was able to
digest the sample. Values near zero indicate equivalent amplification with and without the enzyme and suggest low
levels of DNA methylation. (A) The data is shown for 10 DMRs that were identified as having hypomethylation
following tissue culture. The eight DMRs indicated by an “*” are confirmed by qPCR. (B) qPCR data is shown for five
DMRs that exhibit hypermethylation following tissue culture. Only one of these (DMR408) is supported by the
methylation sensitive qPCR.
Figure S3 The DNA methylation levels for all samples were used to perform clustering. The dendrogram showing the
relatedness of DNA methylation profiles at the DMRs is shown. The clustering of the R1 samples with the R0 parents is evident in this plot.
Figure S4 Additional validations of the heritability of tissue culture induced DMRs. Four tissue culture induced
hypomethylation DMRs that were validated by methyl‐sensitive qPCR (in addition to Figure 3). For each sample, the
value shows the difference in Ct for amplification with and without the methylation dependent enzyme FspEI. Higher
values reflect high levels of DNA methylation while low values reflect low methylation. The samples include eleven
additional R0 samples, 24 R1 samples, five callus samples and seven control plants not subjected to tissue culture. The
24 R1 samples include four plants siblings each from three families (Parent plants R0 3‐10, R0 3‐4 and R0 3‐7) and eight
Figure S5 Comparison of DNA methylation levels in other maize genotypes with control plants and R0 plants. The
average DNA methylation level in 19 of the NAM inbred lines (that have not been through tissue culture) was
determined for each DMR and compared to the average DNA methylation levels in control A188 plants and R0 plants.
For each DMR we calculated the difference between the NAM inbred lines and the average of the control A188 and R0
plants divided by the difference between the control A188 plants and the average of the control A188 and R0 plants.
Values great than 0.5 were classified as “Control‐like”, values less than ‐0.5 were classified as “R0‐like” and DMRs with
values between ‐0.5 and 0.5 were classified as “Intermediate”. The DMRs that are hypo‐ (A) or hypermethylated (B)
following tissue culture were separately analyzed.
File S1
Tissue Culture Media Modifications
For the production of the Chu’s modified N6 initiation/maintenance media, 3.98 g/L of Chu’s N6 basal salts
(Caisson Labs, product number CHP01), 2 mL of 2, 4‐D stock (1 mg/ 1mL), 2.875g/L (25mM) of L‐proline, 30 g/L of
sucrose, 3.5 g/L of gelzan (Caisson Labs, product number 71010‐52‐1) was dissolved in sterilized water, adjusting the
pH to 5.8 with 1 M KOH. The bottle was adjusted to 1L with sterilized water, autoclaved for 20 minutes, and the bottle
was allowed to cool. After autoclaving, 5 µM of AgNO3 (1 mg/mL stock) was added, along with 1 mL/L of N6 1000x
vitamins as per protocol (FRAME et al. 2011). Approximately 25 mL of the medium was poured into 100 x 25 mm petri‐
dishes and allowed to solidify.
For the production of the R1 regeneration media, 4.3 g/L of MS salts (PhytoTechnologies Lab, product
number M524), 60 g/L of sucrose, 100 mg/L myo‐inositol, 3.5 g/L of gelzan was dissolved in sterilized water, adjusting
the pH to 5.8 with 1 M KOH (MURASHIGE 1962). Volume of the bottle was filled to 750 mL with sterilized water,
autoclaved for 20 minutes. After autoclaving, 1000x MS vitamin stock as per protocol (FRAME et al. 2011) and plant
growth regulators (PGRs) were added, including: 1 mg/L of indole acetic acid (IAA), 0.5 mg/L of zeatin, and .023 mg/L
of ABA were added. The bottle was adjusted to 1L with deionized water. Approximately 25 mL of the medium was
poured into 100 x 25 mm petri‐dishes and allowed to solidify.
For the production of the R2 regeneration media, 4.3 g/L of MS basal salts (PhytoTechnologies Lab, product
number M524), 30 g/L of sucrose, 3 g/L of gelzan was dissolved in sterilized water, adjusting the pH to 5.8 with 1 M
KOH (MURASHIGE 1962). After autoclaving, 1000x MS vitamin stock were added. Volume of the bottle was adjusted to
1L with deionized water, autoclaved for 20 minutes. Approximately 25 mL of the medium was poured into 100 x 25
mm petri‐dishes and allowed to solidify. The same media was used for magenta boxes to allow the plants to get
larger.
Literature Cited
Frame, B., M. Main, R. Schick and K. Wang, 2011 Genetic Transformation Using Maize Immature Zygotic Embryos.
Plant Embryo Culture: Methods and Protocols 710: 327‐341.
Murashige, T. S., F., 1962 A revised medium for rapid growth and bio assays with tobacco tissue cultures. Physiologia
Plantarum 15: 473‐497.
Table S1 Primers used for methyl‐sensitive qPCR validations
DMR ID Direction Left Right
DMR2 TC loss TGTTGAGGTGTTTTCACTTGC CCGCTCTGTGTTCTTTGTCAT
DMR34 TC loss AAAGCATCATGAGAGGAGCAA CGTGCTGATTTCGATTTGATT
DMR206 TC loss GTGTTAGTGGGGAGGAGAAGG GAAGCATAAGGGAGGAGCATC
DMR434 TC loss AACCTTTTTAGCGGCTCACTT GGTTAACAGTGCTGGATCAGG
DMR455 TC loss AAGGAAAGCAAGGCTCATTGT GGCTTGCATTGGTGTGTAAAT
DMR485 TC loss CCGTGTTCAGCTCGTTACACT GGGTACTGGCTTCAACCTGAT
DMR567 TC loss TGTATGCTTGCTCGCTATTCC CGATATGGCTTCGTGACAAAT
DMR609 TC loss TCCGCACATCACTCTATGACA TTAAGATCGAGACCGAACCAA
DMR622 TC loss TCATTATCGTCTTGTTCAACGTA TTTTTCTGCGATAAACCATCTAAA
DMR652 TC loss ACAGAGTGGACGTGGAGATGA ACTGTGGTATCGCGAGAGAAA
chr9_031 TC gain GCATTTTTCTCTCCTGCCATA CACGTACTTCCAGAACCCGTA
DMR601 TC gain CACAGCCGATGCGTAGTATCT ACGAGGAGAACCAGGAACG
DMR408 TC gain GGGGGCAGCTGATATTTATGT TGCAATGTAAGATGAGGAAACC
DMR406 TC gain TGAACATGGTTGGTAAATCAGC CGAATGTCAACCGATAATGGA
DMR173 TC gain CATGTCACGGTGGATCCTAGT GTGTCATAGTGCCACAGCTCA
Table S2 Total number of reads for RNA‐seq data Sample Sample Name Total # of Reads
1 Control 2 25,670,978
2 Control 8 18,769,008
3 R1 3‐4.1 25,393,910
4 R1 3‐4.3 31,989,010
5 R1 3‐7.3 29,422,846
6 R1 3‐7.7 58,343,248
7 R1 5‐13.11 24,417,956
8 R1 5‐13.12 20,608,472
Samples 2 and 8 include multiple runs of sequencing, which
were concatentated to produce FPKMs
Tables S3‐S4 are available for download as Excel files at
http://www.genetics.org/lookup/suppl/doi:10.1534/genetics.114.165480/‐/DC1
Table S3 List of genome‐wide tissue culture DMRs and inheritance calls identified in study
Table S4 Expression of hypo DMR genes within promoters of R1 regenerants