ABSTRACT
BROWN, MICHELLE RENEE. Hybridized High Strength High Modulus Yarn Intercalated with Graphene Oxide Relationship at High Strain Rate. (Under the direction of Dr. Emiel DenHartog.)
Multiple studies have been performed to understand the relationship of fiber morphology,
inter-fiber, intra-fiber friction and interfacial bonding to the properties of fibers and
associated components in ballistic protective systems for personnel and equipment.
Understanding these complex relationships and their roles in controlling or influencing final
properties is critical to design and development efforts. This research focuses on testing high
performance yarn with the introduction of graphene oxide (GO) and high strength high
modulus PVA to improve impact performance.
Testing of protective systems for personnel and equipment is primarily performed in final
products through several design iterations. Intermediate testing is not performed or accepted
in the industry as standards do not exist for the methods and the influence of the intermediate
form is not well characterized. In this research an effort was made to evaluate high strength
fibers, yarns and fabrics with additional evaluation methods that may reduce the need for end
item testing during development of new high performance materials and products.
Hybridization of two different high strength yarns, Kevlar KM2 Plus® and PVA was
completed by commingling the different fibers or twisting them into one yarn, with further
treatment of this yarn by graphene oxide. Testing was performed at low strain rate (tensile
testing) and high strain rate (Split Hopkinson Pressure Bar (SHPB) or sonic modulus) to
graphene oxide was performed at the different strain rates but was also determined through
coefficient of friction testing.
The results showed effects on toughness, tribology, strain rate behavior and failure modes
with the introduction of PVA (either commingled or twisted) and GO. Twisting of the yarn
consistently increased the performance of yarn compared to the commingled yarn. In fabric
form the GO did show a greater contribution to improved strength. The different
methodologies yielded differing values for the modulus with dynamic modulus more equal to
initial tangent modulus and quasi-static modulus more related to a longer section of the stress
strain curve.
The main conclusions from this research are commingling of two high strength high
modulus yarns does not necessarily translate into improved tenacity, toughness or modulus.
This was seen across each methodology. GO does not contribute in a tribological manner to
increase energy absorption introduced on the yarn surface. High strain rate testing using
different test methods does not always yield a correlation from one test to another. Use of
high strain rate testing may require sample validation to compare one test method to another
Hybridized High Strength High Modulus Yarn Intercalated with Graphene Oxide Relationship at High Strain Rate
by
Michelle Brown
Dissertation submitted to the Graduate Faculty of North Carolina State University
in partial fulfillment of the requirements for the degree of
Doctor of Philosophy
Fiber and Polymer Science
Raleigh, North Carolina
2017
APPROVED BY
________________________ __________________________
Dr. Emiel A. DenHartog Dr. Stephen Michielsen
Committee Chair
BIOGRAPHY
Michelle R. Brown was born in Greenville, S.C. in September 1957 and remained there
graduating from Greenville Senior High School. In the fall of 1975 she began her college
career at Charleston Southern University. In the spring of 1979 she received a Bachelor of
Science degree in Chemistry from Charleston Southern University. Upon graduation,
Michelle worked for Nutricia as Manager of the Chemistry Laboratory. She left Nutricia and
worked for Digital Equipment Corporation as a Senior Research Scientist in the R&D
facility. She moved to Greensboro N.C. in 1993 and worked for BGF Industries as Senior
Technical Engineer. She continues to be employed at BGF Industries, Inc. In 2012 she
received her Master of Science degree in Materials Science and Engineering from North
Carolina State University. Continuing her education she pursued her Ph. D in Fiber and
AKNOWLEGMENTS
I would like to thank my committee for your guidance, patience and support through my
graduate studies. Dr. DenHartog as the chair for the committee I thank you for always
encouraging me and offering support in all my testing. Dr. Michielsen: You have inspired me
to question what is known about a problem because the solution will depend on what we
know and what we can know. Dr. Kashichainula I specifically thank you for all your
encouragement, understanding and willingness to answer any questions. Dr. Gao I thank you
for your support in providing the graphene oxide, your kindness and willingness to be a part
of my committee.
I wish to also thank Dr. Mark Pankow for guidance in using the Split Hopkinson Pressure bar
and Shreyas Joglekar for his assistance in using the SHPB and patience in days of testing.
I also wish to thank Lawson Hemphill and Ms. Filiz Avsar for her invaluable assistance with
their test equipment.
I owe special thanks to Jacen Busick of BGF as he was my proctor and equipment master
throughout my graduate studies. Additionally I would like to thank my family for their
TABLE OF CONTENTS
LIST OF TABLES ... vi
LIST OF FIGURES ... vii
1 INTRODUCTION ...1
1.1 Purpose of Research ... 4
1.2 Research Questions ... 4
2 LITERATURE REVIEW ...5
2.1 Overview of Protective Systems and Current System configuration ... 5
2.2 The Mechanism of Energy Absorption ... 7
2.2.1 Fiber Surface Modification ... 7
2.2.2 Utilization of nanoparticles for nanoindentation and nanoscratch ... 13
3 BALLISTIC PROPERTY TEST METHODOLOGY ...17
3.1 High Strain Rate Testing with Split Hopkinson Pressure Bar ... 17
3.2 Quasi- static impact test method ... 20
3.3 Fiber Pull Out Test Methodology in Fabric ... 23
4 HIGH PERFORMANCE FIBER TYPES AND THEIR MODIFICATION BY PARTICULATE TO IMPROVE PERFORMANCE ...29
4.1 Stress Concentration in E glass and Kevlar... 29
4.2 Commingling fiber for wear resistance ... 31
4.3 Encapsulation of fiber types to improve performance ... 34
4.4 Protective system fiber types ... 37
4.5 Modification of high performance yarn using GO ... 39
5 HIGH STRAIN RATE FAILURE MODE ...40
5.1 PVA Fiber failure at high strain rate ... 40
5.2 Failure mode related to processing ... 41
6 GAP ANALYSIS OF CURRENT FIBER TYPES IN USE AND PROPOSED RESEARCH ...44
7 RESEARCH MATERIALS AND PREPARATION ...46
7.1 Yarn preparation ... 46
7.2 Graphene Oxide Treatment ... 47
8 QUASI-STATIC TESTING OF MECHANICAL PROPERTIES ...50
8.1 Introduction ... 50
8.2 Viscoelastic materials and their behavior... 51
8.3 Static Tensile Testing (Low strain rate) ... 52
8.4 Tensile Strength versus Toughness Trade-off ... 53
8.5 Experimental Methodology ... 55
8.6 Results and Discussion ... 56
8.7 Conclusion ... 61
9 DYNAMIC MODULUS TEST METHOD USING SONIC VELOCITY ...62
9.1 Introduction ... 62
9.2 Basic Principles of Sonic Velocity Test Methodology ... 63
9.3 Experimental Methodology ... 66
9.4 Results and Discussion ... 67
9.5 Conclusion ... 69
10.1 Amonton’s Law as applied to yarn friction ... 71
10.2 Experimental Methodology ... 73
10.3 Results and Discussion ... 75
10.4 Conclusion ... 79
11 HIGH STRAIN RATE FABRIC TEST USING SPLIT HOPKINSON PRESSURE BAR ...80
11.1 Introduction ... 80
11.2 Hopkinson bar basic configuration ... 81
11.3 Experimental Methodology ... 83
11.4 SHPB Sample Set up Results and Discussion ... 84
11.5 Experimental Results and Discussion ... 85
11.5 Conclusion ... 90
12 SUMMARY CONCLUSION ...91
12.1 Recommendations ... 95
LIST OF TABLES
LIST OF FIGURES
Figure 1 Typical stress strain curve ... 1 Figure 2 Depiction of target surface at low and high velocity (Reproduced from
Bhatnagar et al Ref 4) ... 6 Figure 3 Typical set up of fiber pull out test method (Reproduced from Yue el al., ref 6)
... 12 Figure 4 Schematic showing radial, axial and hoop orientation for nanoscratch and
nanoindentation. (Reproduced from: McAlister et al., ref 7) ... 14 Figure 5 SEM of fibrillation resulting in ploughed surface (Reproduced from: McAllister et al., ref 8) ... 15 Figure 6 Split Hopkinson Pressure Bar (Reproduced from REL) ... 18 Figure 7 Plot of specific strain energy versus strain rate showing strain rate sensitivity
for Kevlar®, E-glass and PVA (Reproduced from: Wang, Y. et al., ref 9)... 19 Figure 8 Quasi-static punch shear test equipment showing placement of test sample
(reproduced from: Erkendirci et al., ref 10) ... 21 Figure 9 Energy dissipation in laminate as a function of thickness (Reproduced from
Erkendirci et al., ref 10) ... 22 Figure 10 Graphical representation of scoured versus greige fabric velocity response
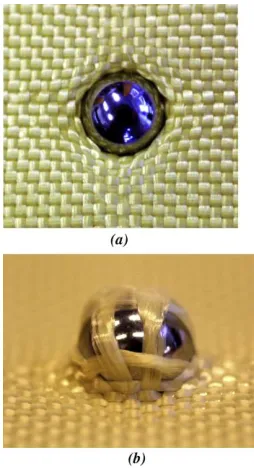
curves. (Reproduced from: Nilakantan et al., ref 12) ... 25 Figure 11 Photo of scoured fabric with no penetration a) front of sample, b) rear of
sample. (Reproduced from : Nilakantan et al., ref 12) ... 26 Figure 12 Image of projectile impacting fabric at a)140, b) 150, c) 170 and d) 180us
showing initial separation of fibers.(Reproduced from: Grujicic et al., ref 13) ... 28 Figure 13 Depiction of commingling process flow and equipment. 1) Input fiber
package, 2) Feed roller, 3 & 4) Guide rollers, 5) Air pressure regulator, 6) Fiber delivery roller, 7) Take up roller, 8) Commingled fiber package. (Reproduced from : Pradhan et al., ref 15) ... 32 Figure 14 Image of concrete slab reinforced with PVA fiber. (Reproduced from
Kurrary.com/PVA-ECC) ... 35 Figure 15 a) Schematic of para aramid structure showing pleat structure, b) Chemical
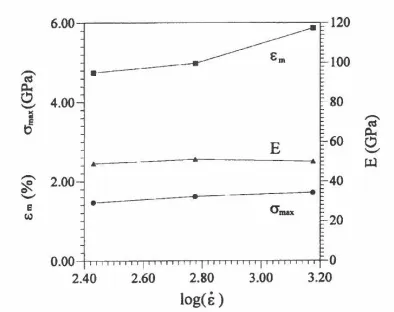
structure of Kevlar (www.wikipeidia.com) ... 38 Figure 16 Graphene oxide solution ... 39 Figure 17 PVA fiber response at different strain rates. Variation of modulus (E),
maximum applied stress and failure strain, corresponding to maximum stress are plotted at several strain rates. (Reproduced from: Wang et al ., ref 21) ... 40 Figure 18 Effect of strain rate on tensile strength in unwoven yarn, warp and weft after
weaving. (Reproduced from: Sanborn et al., ref 23) ... 43 Figure 19 a)KM2 Plus® yarn as received; b) PVA yarn as received ... 46 Figure 20 Sections of commingled yarn showing yarn bundle changes, incorporation of
PVA yarn in KM2 Plus® bundle. ... 47 Figure 21 Schematic of typical commingled yarn showing relative dispersion of both
Figure 23 GO dispersion in fiber bundle a) 2mg/ml solution treatment b) 1:10 GO
dilution ... 48
Figure 24 SEM image of commingled KM2 Plus® & PVA with 2mg/ml GO solution treatment. ... 49
Figure 25 SEM image of KM2 Plus® & PVA with 1:10 dilution of 2mg/ml solution .... 49
Figure 26 Stress strain curve for a) brittle material and b) ductile material ... 54
Figure 27 Instron® yarn capstan grips and side view of grip curved surface. ... 55
Figure 28 Quasi-static stress strain curve of KM2 Plus® showing five of the ten test samples in the as received state.(Note: Offset of each specimen is added to the data for clarity & does not reflect actual prestrain) ... 56
Figure 29 Quasi-static stress strain curve for five of the ten “as received” specimens of PVA yarn. Note greater elongation of PVA than aramid yarn. .(Note: Offset of each specimen is added to the data for clarity & does not reflect actual prestrain) ... 57
Figure 30 Quasi-static stress strain curve for five typical hybrid (commingled) yarn showing initial break of aramid followed by elongation and break of PVA. .(Note: Offset of each specimen is added to the data for clarity & does not reflect actual prestrain) ... 57
Figure 31 Tenacity (specific strength) comparison for each yarn type. ... 59
Figure 32 Toughness (area under stress strain curve) for all yarn types. ... 61
Figure 33 Sonic velocity pathway courtesy Lawson Hemphill. ... 62
Figure 34 USB Oscilloscope image of waveform in KM2 Plus. Image shows voltage as a function of pulse time through material. ... 64
Figure 35 Longitudinal wave propagation and transverse wave propagation. (Reproduced from www.socratic.org) ... 65
Figure 36 Plot of sonic pulse transit time as a function of distance with linear regression curve fit. ... 67
Figure 37 Sonic velocity in m/sec of yarn types as tested on Lawson Hemphill LH551.68 Figure 38 Dynamic modulus calculated from sonic velocity for each yarn type. ... 69
Figure 39 Lawson Hemphill CTT Dynamic Friction Tester LH402 (Courtesy of Lawson Hemphill). ... 74
Figure 40 Yarn twist fixture showing a) yarn with no twist, b) yarn with twist and c) insert view of yarn twist. ... 74
Figure 41 Yarn tension profile for aramid yarn. Note spike in output tension during test. ... 76
Figure 42 Yarn tension profile for PVA. Note smooth and consistent profile as yarn is tested. ... 76
Figure 43 Yarn tension profile for aramid & PVA commingled. Sections with perturbations in tension are seen along length of profile. ... 77
Figure 44 Yarn tension profile for GO treated hybrid yarn. Sections with irregular output tension are smoothed. ... 77
Figure 45 Coefficient of friction comparison of reference yarns PVA & KM2 Plus® with commingled yarn, commingled yarn with GO treatment. ... 78
Figure 48 Initial SHPB sample fixture showing metal failure (highlighted in red) at grip sample bottom plate. ... 85 Figure 49 a) Second SHPB sample fixture with more robust design and increase surface
area for better sample retention b) sample mounted in fixture ... 85 Figure 50 SHPB sample incident and transmitted pulse signal. ... 86 Figure 51 SHPB pulse overlay indicating shift of pulse to match slope of incident and
reflected pulse signals. Slope match shown in dashed outline. ... 87 Figure 52 SHPB Stress strain plot of Kevlar reference, hybrid commingled yarn and GO
treated hybrid yarns. ... 88 Figure 53 SHPB stress strain curve showing normal sample alignment by solid curves
and intentional sample misalignment by dotted lines. ... 89 Figure 54 SHPB average modulus calculated from SHPB including intentionally
misaligned samples to show effect of alignment during testing. ... 89 Figure 55 Yarn quasi-static modulus calculated from ASTM D 5035 tensile test method.
... 92 Figure 56 Comparison of modulus of yarn (sonic) and fabric (SHPB) derived from sonic
velocity and SHPB tests. See Chapter 9 & 11. ... 92 Figure 57 SEM of aramid failure mode in a) SHPB and b) quasi-static testing showing
changes in fibrillation ... 94 Figure 58 PVA SHPB failure modes a) fibrillation b) brittle failure. Failure in static
1 INTRODUCTION
Protective system use has become widespread in both industrial and personal applications in
the last few decades. Their purpose is to provide damage protection for equipment or
personnel which may be from the impact of projectiles and or flying debris.
The field of ballistics refers to the study of projectiles and their behavior, including launch,
during flight and impact. Ballistic applications require both impact and penetration resistant
properties as their purpose is to slow a projectile from high velocity (~1400 ft/sec) to 0 ft/sec
in a narrow time window [1]. From conservation of energy the projectile energy must be
absorbed. The energy can be dissipated through rupture of the fiber or through stress waves
propagated down the fiber. This ability is seen on a stress strain curve. The area under the
curve is considered the toughness. It is a measure of the ability of a material to absorb energy
without causing it to break.
The mechanism of impact and penetration resistance is energy absorption or dissipation
where the projectile may have small mass but significant energy. Many current protective
systems utilize high strength, high modulus polymer fibers. These include, but are not limited
to, para aramid, ultrahigh molecular weight polyethylene (UHMWPE), ultrahigh molecular
weight propylene (UHMWPP) and poly(p-phenylene-2,6-benzobisoxazole (PBO). Other
ballistic materials include S glass , typical composition: SiO2, Al2O3, MgO, carbon and
ceramics such as alumina. Based on their properties they are termed high performance fibers
[4]. The ability of polymer fibers to absorb kinetic energy from projectile impact begins at
the molecular level. Polymer chain bond lengths distort and elongate as they store energy on
impact. Elastic modulus describes the reversible deformation of a polymer fiber as the fiber
stores energy. These fibers exhibit viscoelastic behavior. Viscoelastic materials have both an
elastic component, which allows the material to return to its original state after an applied
load is removed, and a viscous component, which resists flow and is time dependent [2].
This viscoelastic response of the fiber to deformation includes bond interchange, chain
motion, conformational change, chain coil and chain scission.
Historically materials used in personal protective systems have included paper, silk, leather,
wood and metal. Changes to weaponry motivated change and improvement of protective
equipment to be able to accommodate new threats. As early as 1919 there is record of patent
submission for body armor. In the 1960’s the discovery of new fibers ushered in the era of today’s body armor. The National Institute of Justice (NIJ) proposed research into protective
for qualification of helmets and vests. The NIJ has also branched out to developing standards
for other protective applications [3].
Currently the Department of Defense only recognizes materials as approved if they meet the
NIJ standards. The various levels require testing of a completed vest, hard armor plate,
helmet or other protective device by shooting the product and determining at what velocity,
with the specified projectile, the product fails or stops the projectile. Other than basic testing
of tensile strength of the fibers used, there are no intermediate test methods to evaluate the
quality and strength properties of ballistic protective fabrics that are under development.
No simulation through Finite Element Analysis (FEA) models are used for the approval
process. As a result all designs are fully developed and then shot based on NIJ or similar
standards. Improvement of these systems is a continuing challenge. Current projects aim to
decrease the amount of weight for any given system component so added material is not an
answer. Design of the most recent enhanced combat helmet (ECH) uses a unidirectional
material (all fibers are aligned in a single direction without weaving) with lower weight and
higher velocity protection. Removing the out of plane condition (yarns are not linear they
must go over or under each other in a woven fabric) is one means of improving the impact
resistance of a system. [4] Another means to improve ballistic protection is to change to a
different fiber. Fibers with a higher degree of polymer chain orientation and covalent
bonding between polymer chains have also been used. Changing the surface roughness,
adding chemical groups to the polymer chain to increase intrafiber friction thereby increasing
1.1Purpose of Research
The purpose of this research is to study hybridization of yarns and introduction of a
frictional component to enhance ballistic performance. Furthermore, a research objective of
this project was to develop additional intermediate level test methodology that may support
product development and reduce the need for end item ballistic testing.
1.2Research Questions
It is hypothesized that combining a high strength high modulus yarn with a different high
strength high modulus yarn having greater elongation characteristics could reduce projectile
penetration. Intercalation with GO to increase the total friction within a woven system to
assist in energy dissipation may further aid in enhancing ballistic protective performance.
Research questions addressed are:
Will commingling of high performance yarns with subsequent introduction of GO
into the yarn enhance strength of the fabric?
Can high strain rate testing of hybrid yarn with and without GO treatment yield
predictive algorithms of ballistic performance and reduce the need for ballistic tests?
How does the modulus of the yarns change as a function of strain rate?
How does sample configuration affect test methodology?
Can the contribution of GO be evaluated by using static tensile testing if these effects
2 LITERATURE REVIEW
2.1Overview of Protective Systems and Current System configuration
Ballistic protective systems are a subset of the overall protective industry. They must handle
high velocity impact and are used in military, police and or other governmental applications.
Systems range from helmets and vests to chain saw chaps.
An extensive coverage of ballistic systems was written by a series of authors to cover
protective system types, materials, modelling, standards, testing, material response,
applications and new technologies. The book Lightweight ballistic composites [4] offered a
summary of the market today. Each chapter was authored by experts in each particular area
of specialization offering a useful overview, although not extremely in-depth gave
information pertinent to the study of the materials.
Chapter 3 [4] focused on the response of a material to an impact event. The authors covered a
combination of factors including velocity classifications, elastic and dissipative response,
matrix cracking boundary conditions and projectile types. The velocity of the projectile
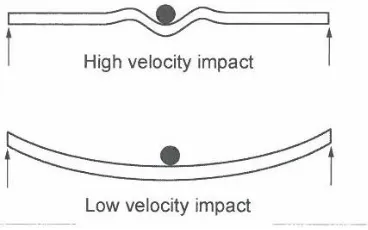
allows categorization into two areas: low velocity and high velocity. At low velocities the
system experiences a stress wave leading to failure or penetration while at higher velocities
the system experiences shear or plugging. For low velocity impact there is adequate time for
the energy of the projectile to be transferred to the fabric then spread throughout the system.
The longitudinal stress wave stretches the yarns pulling the crimp in an orthogonal manner as
a cone from the deformation is formed. As the fabric stores the energy the yarns elongate
proportional to the fiber modulus divided by the density. A small component in the energy
absorption is the friction from the yarns interacting between each other and between layers.
Higher velocity impacts also exhibit some of the same energy absorbing characteristics but
the larger contributors are matrix cracking leading to delamination in laminate systems and
shear or plugging in dry systems. The energy dissipation from the matrix is seen by
formation of cracks. These are formed from normal stress, interlaminar shear stress and
bending of the panel. The separation of materials, called delamination, resulting from the
initial crack is a significant mechanism of energy absorption. Fibers stressed beyond their
tensile strength result in breakage. For dry systems (material with no resin) the warp and weft
yarns of the top layers are pushed aside by the projectile in a mode called shear plugging.
The projectile is stopped as a result of the energy absorbed from yarns in compression around
the projectile and friction between the yarns and the projectile.
Figure 2 Depiction of target surface at low and high velocity (Reproduced from Bhatnagar et al Ref 4)
2.2 The Mechanism of Energy Absorption
2.2.1 Fiber Surface Modification
Many protective systems use composites which are a combination of high performance
fibers, polymer matrices (both thermoplastic and thermoset) and/or ceramics. The fiber is
called the reinforcement while the polymer or filler is called the matrix. A means to increase
composite strength is to bond the fiber substrate to the matrix. The interfacial bond between
the fiber and matrix is critical to allow transfer of the energy from the matrix to the fiber.
The primary failure mechanisms for composites include delamination, i.e. debonding of fiber
and matrix, matrix cracking and fiber pull out. For dry systems, the movement of fibers away
from the projectile called windowing is of primary concern.
Study of a Twaron® polyetheramide composite was conducted by Coffey et al [5] to
understand interfacial bond strength. In this study Twaron® fibers had different surface
treatments to improve interfacial bonding. In Table 1 an overview of the various treatments is
Table 1 List of surface modifications and the intended change to the surface of the fiber (reproduced from Coffey et al., ref 5)
The topography of aramid fibers is smooth and the polymer is chemically inert which does
not promote adhesion. The purpose of surface treatment is to improve the type and degree of
adhesion through chemical or mechanical bonding. This bond is integral to allow transfer of
stress from the matrix to the fiber.
The addition of chloride end groups was to increase the hydrogen bond interaction between
the fiber and matrix. The desired effect of the series of gas plasma treatments, although not
specifically delineated by the authors, could be an increase in surface area, roughness or
chemical groups (i.e. NH3). The NVP (Table 1) was chemically bonded to the fiber using a
photo polymerization technique. Surface treatments with the zirconate and titanate salts
Surface Treatment Addition
Methacryloyl chloride (MC) Cl end group
Succinyl chloride (SC) Cl end group
Argon gas plasma (Ar) Surface area/roughness
Oxygen gas plasma (O) Surface area/roughness
Nitrogen gas plasma (N) Surface area/roughness
Ammonia gas plasma (NH3) Surface area/roughness/NH3 group
N-vinyl pyrrolidone UV polymerized (NVP) Chemical bond
(Neopentyl(diallyl)oxy,
tri(N-ehtylenediaminino)ethyltitanate
Ti end group
soaked in a solution of the organometallic compounds, washed and dried then treated with
the resin.
Single fiber samples were prepared and tested for stress, strain and modulus on constant rate
of extension (CRE) test equipment. Composite samples of each surface modified type were
made by encasing single fibers between the film. The mechanical testing of surface modified
fibers did not show any significant loss of property post treatment. This included exposure of
fiber to photo polymerization for NVP treatment, which had been shown in prior work as
cited by the authors to degrade fiber properties.
Raman spectroscopy is a technique based on molecular vibration of bonds and is capable of
detecting differences in structure geometry and bonding within molecules. The authors chose
Raman spectroscopy to observe peak shift as the samples are stressed. The peak
corresponding to the p-phenylene ring of the aramid fiber at 1610 cm-1 was monitored for
changes. Deformation of the p-phenylene ring would be expected as it is a large structure in
the polymer backbone. A reference value of -4 cm-1/GPa for this peak shift due to stress,
from published literature was used for this study.
The fibers were subjected to different levels of stress. The ‘as received’ fiber was the control
for the comparison with the surface modified fibers. Raman spectra were able to show
transfer of stress from matrix to fiber as well as detection of breaks in the fiber. Interfacial
shear stress (ISS) was derived from the mapping of this stress. Visual observation of the
The NVP treatment did improve the transfer of stress as compared to the ‘as received’ fiber.
The zirconate and titanate coupling agents did not improve the stress transfer nor did the
plasma treatments. Of the two treatments having a chloride end group, only the MC treatment
exhibited an increase.
The use of Raman spectroscopy was successful in detecting visually determined fiber breaks
and interfacial changes in the aramid thermoplastic composites as verified by peak shift and
visual observation. The surface modification using NVP and MC improved the interfacial
shear stress and decreased the fragment length under stress.
Raman spectroscopy was used in this study as other methods have difficulty in detecting
fiber breaks. Visual observation verified there was not a true fiber break, only fibrillation in
sections along the fiber axis was present. This area would no longer provide stress transfer
but the fiber was still intact and could continue to carry some load. This was not discussed
and the question of residual fiber strength was not addressed. While the authors did
determine the effect of surface treatments, the use of plasma was not a viable option, even at
the outset of the study, as noted by the authors in prior work. Plasma conditions produce a
rough surface which could be useful to increase surface area, but the fiber could be degraded
and plasma is a costly process for such applications.
Fiber fragment length as a function of surface treatment was shown to increase with the NVP
and MC, but since this was only visually confirmed but not actually measured length more
study could be performed to determine the degree of fibrillation.
interfacial properties in an epoxy matrix [6]. Their study found a means to increase the
interfacial strength from 39MPa of untreated fibers to 63MPa for a chemically treated fiber.
The authors found that many prior studies focused on adhesion of the fiber in a composite but
a change to the fiber surface morphology and chemistry had not been simultaneously
studied. The authors studied Kevlar® 29 fiber and modified the surface to correlate properties
before and after the treatment to the surface chemistry and fiber morphology. The three types
of treatment are listed in Table 2.
Table 2 Type and process of surface treatment for surface modification.
Step 1 Step 2 Step 3 Step 4
Acetic Anhydride 1min Rinse w/distilled H2O Oven dry, Low vacuum 5 hours Acetic Anhydride 1min Methanol wash 3 min Rinse w/distilled H2O Oven dry, Low vacuum 5 hours Acetic Anhydride 1 min Methanol wash 10 min Rinse w/distilled H2O Oven dry, Low vacuum 5 hours
Scanning Electron Microscopy (SEM) images of the fibers treated with acetic anhydride only
displayed surface blisters, acetic anhydride plus methanol for three minutes displayed
striation and acetic anhydride plus methanol for ten minutes exhibited areas of exposed core.
Obtaining good wet out of the surface (surface energy of matrix vs that of polymer) is
critical for sufficient bonding of the matrix to the substrate. X-ray photoelectron
experimental evidence reported the oxygen content is key to wetting and bonding with resin
systems. All of the solvent treated fibers had higher surface oxygen content than the
untreated fiber. The chemical change resulting in increased surface oxygen content and
surface morphology change also influences the interfacial bond. Atomic Force Microscopy
(AFM) analysis of the surface of the treated samples confirms the roughness of the surface.
The surface roughness could be a source of the increased frictional stress and interfacial
shear strength as seen in the samples.
The fiber pull out test method was used on multiple fibers to determine the interfacial frictional stress τf and the interfacial shear strength τi . This test method places the sample
embedded in the resin in a fixture. Fibers are then pulled out and the load calculated to
achieve break or dislodge the fiber(s) from the matrix. Both the acetic anhydride only and acetic anhydride plus 3 minute methanol wash sample had higher τf and τi pointing to the
combination of improved surface oxygen content and microroughness of the surface
increasing the interfacial bonding.
Significant improvement in interfacial frictional stress was seen in the acetic anhydride
treated sample only. More improvement in the interfacial shear strength was observed in the
acetic anhydride plus 3 minute methanol wash. Yue et al established a means of improving
interfacial shear of composite structures of p-aramid and epoxy by correlating the surface
chemistry, i.e. surface oxygen content, and the fiber morphology to interfacial characteristics
of the composite.
The authors utilized an array of techniques using the results from one test to confirm findings
in another. This paper correlated the hypothesis with data but missing from the data was
information on the epoxy they used. There are many types of epoxy with different functional
side groups, the type would have been useful for comparison studies. Further studies
proposed are to evaluate the surface hydrogen and how the etched surface changes as the
polymer chain linkages are broken or reformed.
2.2.2 Utilization of nanoparticles for nanoindentation and nanoscratch
Fabric performance has been shown to be limited by spreading apart of the yarns as a
projectile penetrates the fabric. The amount of this separation can be modified by an increase
in the friction within the fiber. The addition of nanoparticles has also been shown to improve
the fabric performance as they increase this friction component within the fiber.
In the study by McAllister, Gillespie and VanLandingham, their objective was to understand
the relationship between surface scratch and indentations to the interfiber friction of a woven
Kevlar® fabric with nanoparticles incorporated [7]. The size of the nanoscratch made is
The critical contact size being the point where the “local fiber response is no longer sensitive
to the microfibril heterogeneity” [8]. Initial nanoindentation in the center of the fiber as well
as the radial and axial orientations of the surface established the contact size sensitivity (in
the range of this study). A nanoparticle assumed to be spherical would impart a scratch on
the fiber surface in relation to its contact depth. To simulate this, different angles between the
scratch probe and surface (attack angle) and different probe geometries were used.
Figure 4 Schematic showing radial, axial and hoop orientation for nanoscratch and nanoindentation. (Reproduced from: McAlister et al., ref 7)
To prevent movement of the fiber during testing polystyrene (PS) was used to attach the fiber
to a glass plate. Removal of the PS was accomplished by an initial low depth scratch.
Three modes of deformation were observed and identified as “ironing, fibrillation and mixed
mode. The fibrillation and associated build-up of broken polymer in front of the probe were a
typical response during the scratch. As this build-up occurred the forces in the normal and
lateral direction increased over the distance of the scratch. The apparent friction increased in
show Kevlar® 49 resisting fibrillation initially better than the KM2 fiber at different attack
angles and degree of friction. The difference for KM2 fiber was noted in a previous study
showing this fiber as having a shell with reduced stiffness. Both fiber types maintained their
tensile strength post nanoindentation to larger depths than the proposed infused
nanoparticles. McAllister and coworkers were able to show KM2 resisted the start of
fibrillation at higher attack angles than K49. Indentation testing showed the fibers kept their
tensile strength, even with deeper indentation, which could permit property improvement for
energy dissipation using nanoparticles.
Figure 5 SEM of fibrillation resulting in ploughed surface (Reproduced from: McAllister et al., ref 8)
The sample frequencies of the study included over 40 fibers permitting meaningful testing to
include fiber variation. The use of PS to attach the fiber was critical to obtaining useful
information via AFM. The concern with the film is that it could possibly contribute to the
actual test data. This was addressed by their film removal procedure. The procedure was
substantiated by images of the removed film build up after the low depth scratch. However,
later mention of the film and interaction of the nanoindentation test with the edge of the film
free. They were able to show that nanoparticles could improve properties through fiber
particle interactions but only a single study was referenced so there was no ability to note
3 BALLISTIC PROPERTY TEST METHODOLOGY
Testing of the ballistic properties of vests and helmets standards around the world have been
developed such a NIJ, ASTM, Military and Underwriters laboratory (UL). The type, level
and test methodology are listed in the standards. To achieve certification to a specific threat level sample “ballistic packs” must be shot. Ballistic limits are identified in terms of
projectile velocity. The term Vx where V, the projectile velocity at any given x, is the
probability the fabric will experience penetration. The V50, which is the velocity at which
half of the projectiles did not penetrate and half did penetrate, and the range of velocities are
reported for submission to the customer.
3.1High Strain Rate Testing with Split Hopkinson Pressure Bar
Determining mechanical properties of protective systems and their components is
accomplished using a variety of test equipment. The American Society for Testing &
Materials (ASTM) and other recognized methods are in place to standardize testing between
labs. One method used for testing at high strain rates is a Split Hopkinson Test Bar. The
SHPB is capable of testing materials at high strain rates of approximately 1000/s. The
equipment consists of 2 large steel bars mounted on a frame. Samples are loaded between the
incident bar and the transmission bar. A bar moved by compressed air, termed a striker,
strikes the incident bar which causes a stress wave that propagates through the incident bar.
As it reaches the samples it splits into 2 smaller waves. Part of the wave is reflected back into
the incident bar and the other travels through the sample into the transmission bar. Strain
wave. The reflected pulse is used to calculate the strain and the pulse that continues through
the samples is used to calculate stress.
Figure 6 Split Hopkinson Pressure Bar (Reproduced from REL)
Time dependent response of high performance fibers was the subject of research by Wang et
al [9]. In protective systems, ballistic properties of the composite are a function of the ability
of the fiber to bear the applied load. Understanding the response of the fiber under ballistic
conditions, which involve high velocity is critical for the application and design of these
systems.
SHPB impact testing was performed on E-glass, an alumino-borosilicate glass with less than
1% w/w alkali oxides, Kevlar®49 and polyvinylalcohol (PVA) fibers at different strain rates.
Stress strain curves of the fibers show that all fibers exhibit a correlation to the rate of strain.
The PVA fiber only exhibited an increase in maximum stress applied to the fiber, σmax and
change. High strain rates involve the elastic component of the fiber properties while low
strain rates involve the viscous component. The absorption of energy by the fibers is through
the elastic component. The authors define the area under the stress strain curve as the tensile
strain energy. To compare tensile strain differences between the fibers they define a specific
strain energy, Uc for a given strain rate as follows:
U
c= ½ σ
maxε
m/ρ
(1)where ρ = fiber density.
Plotting Uc as a function of the log of strain rate clearly shows the Kevlar®49 having the
highest capacity in ability to change molecular configuration under tensile strain. The
Kevlar® fiber consistently absorbs energy with much less elongation than the E-glass and
PVA (Figure 7).
Figure 7 Plot of specific strain energy versus strain rate showing strain rate sensitivity for Kevlar®, E-glass and PVA (Reproduced from: Wang, Y. et al., ref 9)
Each fiber exhibited strain rate dependence with E-glass and PVA having significantly
greater rate coefficients than Kevlar® with the exception of the elastic modulus.
Observation of the broken fiber ends via SEM show the failure modes for each fiber. SEM of
the E-glass fiber shows a sharp break in a brittle manner. The PVA had two types of fiber
break one was brittle having a clean fractured end and the other had fibrils resembling that of
Kevlar® indicative of a similar mode of failure. The authors indicate the mode of failure is
the reason for the higher mechanical properties for Kevlar® and PVA fibers.
Kevlar®49, PVA and E-glass all show a correlation to strain rate. The Kevlar®49 exhibited
lower strain rate sensitivity and has better performance than PVA or E-glass in a ballistic
environment. The non-brittle failure mode of PVA along with the observed high Uc at a
high strain rate would place PVA in a similar category as Kevlar®49. No minimum
requirement or reference standard was given in the paper. E-glass is known for brittle failure,
but has been shown to perform better in combination with other fibers.
3.2Quasi- static impact test method
The goal to optimize energy dissipation and reduce weight in ballistic composites is part of
on- going work in industry. A study to evaluate the quasi-static penetration resistance
performance of a high density polyethylene (HDPE) and Kevlar (aramid) composites was the
focus of Erkendirci and Haque [10].
Quasi-static-punch shear test (QS-PST) is a method to determine degree of projectile
both the damaged and undamaged sections of the sample. QS-PST tests the samples at very
low strain rates. A custom steel fixture with punch and punch guide is fabricated allowing
different sample sizes to be tested. Support spans are used behind the samples and can have
different diameters for each specimen size. Testing at various ratios of support span diameter
and punch head diameter provided test data for the shear and bending component of the
composite.
Figure 8 Quasi-static punch shear test equipment showing placement of test sample (reproduced from: Erkendirci et al., ref 10)
The authors were conducting follow up to their prior research using the QS-PST method in
work to develop measureable quasi-static penetration energy. A series of composites
consisting of 4, 8 and 12 layers of a plain weave aramid and HDPE film were produced using
a hot compression mold.
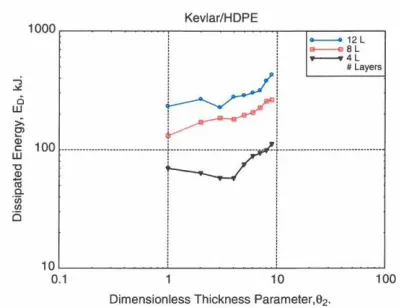
Penetration energies of the composite with different thicknesses were determined by
analyzing the load (force per unit area of laminate) displacement data. The area under the
The aramid HDPE composites exhibited initial non-linear displacement followed by a linear
portion which continued to maximum force. The authors assumed there was no fiber damage
up to maximum force. They stated the major influencing factor for the changes in the laminate are from “non-linear membrane tension shear” around the punch head. The mode of
failure is seen as elastic deformation followed immediately by fiber fracture near the
maximum load as seen by the large decrease in resistance force. The 12 layer composites, as
expected, had the highest maximum force required. Figure 9 shows the function of thickness
in energy dissipation.
Figure 9 Energy dissipation in laminate as a function of thickness (Reproduced from Erkendirci et al., ref 10)
Comparison of the 4, 8, and 12 layer composites, tested at the same SPR, show a failure mode of fiber pull out and not brittle fracture. The authors state the ‘”matrix crack mode is
naturally absent in aramid HDPE” as the matrix responds in an elastic deformation manner
cracking. The amount of cracking may not be well seen and delamination may be limited, but
failure of the interface will occur. For optimum bonding the thermoplastic or thermoset must
thoroughly flow and adhere to the surface to be bonded. The surface energy of the fiber
should be greater than the surface energy of the resin. This degree of bonding is termed wet
out. Wet out can be measured by the contact angle of a bead of the resin on the fiber surface.
The smaller the contact angle the more the surface wets out and vice versa. Aramid surfaces
are smooth and relatively inert not promoting adhesion. Their hypothesis of limited wet out
by the HDPE of the aramid is accepted. This does not completely support the failure mode
of fiber pull out. Fiber pull out occurs as the energy is transferred to the fiber and the
interface fails. Assuming no fiber damage up to maximum force was not substantiated by any
data presented.
Plotting the area under the force displacement curve as a function of thickness shows clear
delineation of the fiber capacity to accommodate impact. The 12 layer composite showed the
highest energy dissipated, the 4 layer the lowest, indicating dependency on thickness which
has been well developed in other literature.
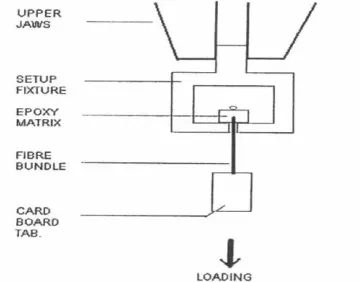
3.3Fiber Pull Out Test Methodology in Fabric
Fiber pull out is a test performed on woven protective systems. There is no standardized test
method so Nilakantan et al [12] modified the industry type of testing and used the results for
their experimentation. Testing of samples has the sample encapsulated in the matrix with
both ends exposed. The force required to pull out the fiber is recorded as a function of length
Experimentation of greige (loom state) and scoured (hot water or solvent wash) plain weave
Kevlar KM2 fabric to determine the probabilistic velocity response (PVR) was performed.
The mode of failure during impact was studied using single ply of 180 gsm fabric mounted in
a custom fixture to permit principal yarns to respond in an unclamped state. On impact yarn
can fail under tensile strain, in shear as the energy of the high velocity projectile cuts the
fiber or from movement of individual yarns away from the projectile “windowing” allowing
the projectile to penetrate the fabric. Windowing occurs as the yarns slide across each other
and ultimately are pulled out creating a hole. Single yarn pull out testing was also performed
to validate the inherent variation of the yarn. Pull out speeds of 50 mm/min and 500 mm/min
were applied to each specimen. No significant difference was observed between the greige
and scoured fabric. The warp pull out load was found to be higher than the fill pull out load.
The pull out load was found to be rate dependent with greater loads required at low velocity.
For ballistic testing samples were placed in a custom equilateral octagon (EO). The design
has corner grips for the samples allowing the principal yarns to move unclamped. Sample
orientation at the edge of the EO was noted for verification of any slippage during testing.
Impact tests consist of a gas gun firing the steel projectile with measurement of velocity by
chronograph and residual velocity captured with light screens behind the target.
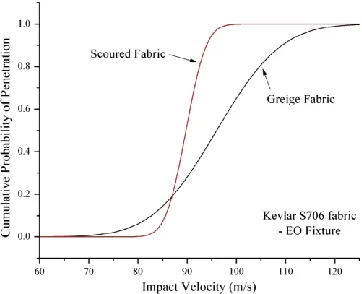
The PVR curve generated for scoured fabric shows higher impact properties than the greige
at low velocity (V1). The greige fabric at higher velocities had better impact properties.
Comparison of the coefficient of variation for greige versus scoured show a threefold
Figure 10 Graphical representation of scoured versus greige fabric velocity response curves. (Reproduced from: Nilakantan et al., ref 12)
Observation of each sample for pull out and penetration found scoured fabric had greater
number of penetrations. Greige fabric had few instances of penetration. In cases where the
fabric contained the projectile, the yarn is flat. It was postulated under compression by the
projectile the filaments open up increasing the actual width of the yarn helping contain the
Figure 11 Photo of scoured fabric with no penetration a) front of sample, b) rear of sample. (Reproduced from : Nilakantan et al., ref 12)
For all ballistic samples with penetration the failure mode was windowing with no complete
yarn failure of principal yarns. The EO fixture allowing principal yarns to move freely would
permit these yarns to pull out rather than rupture on impact. The study found no yarn
strength failure yet there was windowing. The freedom of principal yarns to move in the EO
fixture does not necessarily represent real world applications.
The number and length of principal yarns pulled out varied. The study did not measure the
coefficient of friction but did assume friction as the largest influencing factor for energy
dissipation as the frictional contribution from greige versus scoured from yarn sliding varied
from sample to sample. Greige fabric had a higher degree of yarn pull out compared to
warp and fill fiber or between yarns. They point to neat holes at the impact site that had yarn
push out. They indicate that scoured fabric had larger interstices versus greige which would
explain the difference in values. This could result in more yarns being pushed aside leading
to penetration. A second theory was of frictional interaction between projectile surface and
yarn filaments of the different fabric types. The back of the sample after impacts shows
frictional sliding over the projectile surface. A third theory was of the friction within each
yarn contributing to the mechanics of the yarn separating.
The study was able to show a relationship of frictional components to impact response at low
velocities. They found greige fabric had higher V50 values and scoured fabric performed
better at low velocities. To improve performance at higher velocities inter-yarn friction
would require modification.
While the frictional components are important, typical protective systems use a water
repellant after scour or use scoured fabric in a resin matrix. This then limits the data
presented. The contribution of spin finish (coating on aramid yarn as protection in
processing) while mentioned was not addressed in their theories for frictional sliding and
could add texture to the fiber surface. The EO fixture is new and attempts to mimic large
sample behavior but the size of the fixture and free principal yarns do not mimic large
samples or closed systems well as the fixture allows freedom of movement of some yarns
Figure 12 Image of projectile impacting fabric at a)140, b) 150, c) 170 and d) 180us showing initial separation of fibers.(Reproduced from: Grujicic et al., ref 13)
4 HIGH PERFORMANCE FIBER TYPES AND THEIR MODIFICATION BY PARTICULATE TO IMPROVE PERFORMANCE
4.1 Stress Concentration in E glass and Kevlar
Studies of the interactions in the different combinations of reinforcement ( E glass, aramid,
S-glass, carbon, etc…) and resin (epoxy, polyester, phenolic, thermoplastic) is often used to
characterize system reliability. Zhou et al conducted a study of the stress concentration
profiles of Kevlar® in hybrid composites [14]. The authors tested single fiber composites to
estimate stress distribution as the composite is strained. Typical composites have a weak
mechanical bond with the matrix unless a surface finish (chemical treatment applied to fiber
for protection or bonding) is applied to the fiber that can increase the bond to both the fiber
and the matrix. As the fiber breaks stress is transmitted to the surrounding area. The
mechanism of stress transfer involves both the fiber matrix interface and interfiber and/ or
intrafiber interactions. Fiber reinforcement will fracture upon impact. Stress from the impact
is dissipated by the fiber. Along the area of impact the stress builds leading to regions of
stress concentration which in turn eventually lead to failure of the fiber. As the authors
found, very little experimental work has been done to validate the stress concentration from a
lack of established measurement methods.
E-glass fibers typically have a PVA starch solution applied as they form to protect them. This
is called sizing. If this is not applied or is removed the fiber is considered unsized or desized.
Unsized and sized E-glass fibers along with Kevlar® were used in testing. The E-glass fibers
were approximately 12 μm in diameter. Fibers were coated with an epoxy resin. The E-glass
plays in the interaction of the stress concentration factors (SCF). The hybrid composite was
tested at a strain rate of 0.2 -0.4 µm/s. Microraman spectroscopy captured the spectra of the
Kevlar® peak vibrations at 1287, 1328 and 1611 cm-1. As the fiber was stressed a peak shift
was observed to a lower wavenumber. The shift of the 1611 cm-1 peak was monitored with
each break in the E-glass fiber. As the fiber breaks and transfers stress to surrounding areas
the fiber nearest the broken fiber is the first to experience the stress transfer. Redistribution
of stress is affected by the distance to the nearest fiber and by the bond to the matrix. The
SCF is defined as the ratio of local to applied stress. The stress and strain associated with
each of the multiple breaks in the E-glass fiber was logged until no failure of the matrix was observed. The authors identified full debonding if they observed “deep dark and grey lines”
and partial debonding if the lines were “thin and faint”. They observed no loss of interfacial
bond in the sized E-glass samples.
Debond length along the fiber was used to calculate the stress concentration factor, (K) by the
equation
K = 1 + │νx –ν∞ │/ │ ν∞ - ν0 │ (2)
Where :
νx = Raman peak wavenumber (cm-1) at the cross section of the fiber break
ν∞ = Raman peak wavenumber (cm-1) at the far-field position away from the break cross section
ν0 =Ramanpeak wavenumber (cm-1) with no applied strain
For most cases the experimental values in this study calculated higher SCF values than
In comparing the sized versus unsized fiber the Sized E-glass had a higher SCF than unsized.
Sized E-glass exhibited clean matrix breaks accompanied by some crack formation and
unsized exhibited interfacial failure. Debond lengths were shorter in sized fiber samples than
the unsized. The improvement in bond strength is well accepted in literature as the sizing,
which in this case is silane, provides a much stronger mechanical bond to the glass than the unsized. The authors did not clarify if the sized fiber had the manufacturer’s size only, nor
did they indicate if the fiber had any twist, which is a designation of if and how much the
fiber has been twisted on its axis, this could alter the difference in the stress concentration
factor.
The model proposed is only valid where the matrix does not fail, as the authors only
evaluated the portion of the stress strain curve after prestressing the fibers, and therefore has
limited use.
4.2Commingling fiber for wear resistance
Commingling of different fibers will provide a more homogenous fiber as the two types have
a uniform distribution profile. The influence of the weight fraction of aramid and
polypropylene (PP) composites was studied by Pradhan et al [15]. Unidirectional high
performance fiber reinforced polymers (FRP) have application in aircraft, pipeline and
recreational equipment. The reduced weight and wear resistant properties are key factors in
their use. Aramid fibers have been shown to increase wear resistance in various products.
The addition of thermoplastics to FRPs is utilized for the impact properties and toughness.
fiber is in direct contact with the reinforcing fiber allowing a direct path during flow to
encapsulate and or adhere the reinforcing fiber. Mechanical properties related to fatigue,
impact and deformation have been studied but there are few studies on tribological
performance. Pradhan et al set out to determine the influence of reinforcing fiber weight
fraction in a commingled fiber. Evaluation of property improvement from incorporation of a
reinforcing fiber would need to include total amount of fiber added, type, fiber orientation
and ability to increase adhesion to the matrix.
Figure 13 Depiction of commingling process flow and equipment. 1) Input fiber package, 2) Feed roller, 3 & 4) Guide rollers, 5) Air pressure regulator, 6) Fiber delivery roller, 7) Take
up roller, 8) Commingled fiber package. (Reproduced from : Pradhan et al., ref 15)
Four different weight fraction composites ( 0, 18,24 & 29%) were made and studied. [15]
The aramid fiber was Kevlar®29 with the PP a multifilament yarn. The commingled yarn
Abrasion wear studies with loads of 20, 30, and 40 N were conducted on a Universal wear
tester. Each test was repeated and the average value of weight loss used for calculation of
wear rate. Samples were tested at 00 and 900 orientation.
Abrasion studies show as the aramid weight fraction increased the wear area decreased.
When the composite was abraded perpendicular to the fiber orientation there was less wear.
In the perpendicular orientation the increase in aramid weight fraction followed the decrease
in wear rate. However, in the parallel orientation there was lower wear resistance. The
authors noted fibers were peeling out of the composite in this orientation producing higher
wear rates. Overall, the aramid fibers with orientation perpendicular to abrasion increased
the wear resistance with orientation as the factor with greater influence.
Erosive wear testing was performed per ASTM G76 in an air jet erosion rig. Weight loss
samples were used to calculate erosion loss. Tensile testing per ASTM D3039 was performed
on multiple samples. The modulus and specific strength increased with the increase in
percentage of aramid fiber. However, as the percentage of aramid increase there was less
strain to break.
Erosion studies show the composites with more aramid had a three-fold improvement.
Fibrillation of the aramid, during erosion, along with the capacity of the aramid to resist
wear, were cited as the reasons for improvement. The erosion wear rate and abrasion wear
rate were approximately the same with the increase in aramid fiber weight fraction.
Commingled PP yarns with varying aramid weight fraction improved the tensile, abrasion
optimization of the wear and abrasion properties. Commingled fibers provided combined
properties with less cost and reduced process time.
4.3 Encapsulation of fiber types to improve performance
The addition of other materials including steel, carbon and polymeric fibers has been shown
in studies to improve penetration resistance. Mechanical properties including ductility, load
carrying capacity, flexural strength and crack development were used in a study by
Almusallam et al to evaluate the addition of such materials and the changes to impact
properties [16]. A series of reinforced concrete (RC) slabs were cast with different volume
fractions of hooked end steel, polypropylene Type-2 (PP2) and Kevlar®. The prepared
specimens of hybrid fiber reinforced concrete (HFRC) for each combination used steel fiber.
The steel fiber is the largest contributor to improvements while the other materials were
added to change properties such as toughness, micro-cracking and penetration depth. Slabs
with single or multiple fiber combinations were impact tested with an air gun system. An 8
mm steel projectile with a hemispherical nose was used for the study.
Several criteria and measurements were used to evaluate performance. Damage levels were
rated according to the levels set by Dancygier et al [17]. The assignment of damage from
lowest to highest (rated 1-6) was obtained from the rear panel of each specimen. Physical
measurements of the damage were from penetration depth and crater size. To differentiate
standard concrete and the HFRC panels in compression, simulating the rear of the panel at
penetration, the authors also conducted a split tensile test. The split tensile test per ASTM
determine the compression load for failure. The HFRC samples had a higher average split
tensile strength as compared to the standard concrete. This explains the lower amount of
front and rear panel damage.
The reported experimental ballistic limit was taken from the average of the velocities with
and without perforation of the test panel. Hooked end steel panels exhibited the highest
ballistic limit. Data from the study shows this was directly related to the presence of the
hooked end steel fibers. Test panels with PP2 fibers had similar results to hooked end steel
samples but also had significant abatement of concrete fragments. The addition of Kevlar®
fibers, with a lower amount of hooked end steel fibers was weaker on impact but also had
better constraint of the concrete fragments. Samples with all three fibers increased the impact
resistance with lower penetration depths. The test values show the panels with all three fibers
performed better than panels with only two types of fiber as observed from damage levels
and crater dimensions. Synthetic fiber addition localized the damage and only minor cracks
were evident.
Figure 14 Image of concrete slab reinforced with PVA fiber. (Reproduced from Kurrary.com/PVA-ECC)
Prediction of penetration depth was a focus in earlier work by the authors and building on
this work they modified the equations for the fiber types used in the current work to compare
to experimental observation. Comparison of predicted versus experimental values show a
+/- 10% difference, which is considered within accepted error levels with the limited and
unknown portions of the model parameters. The experimental data clearly shows the volume
fraction of hooked end steel had the highest contribution to reduction in penetration depth
and PP2 had the lowest. The conclusion was that the diameter of the PP2 fiber as compared
to the dimensions and shape of the hooked end steel did not increase its contribution as
much. The Kevlar® yarn used had a low profile and test values did not show their inherent
higher tensile and modulus values translate to an increase in impact properties. As the slab
was weaker the authors postulate the geometrical properties of the yarn are more influencing
than the material properties in response to impact resistance of HFRC.
The problem noted in the study is the inability to collect experimental data for RC ballistic
events. Therefore, the authors identified a range where the hypothetical ballistic limits would
be and plotted the average of minimum and maximum velocity with and without perforation.
The notation of good was placed for each predicted value if it was within +/- 10% error and
no good if greater. The conclusion that hybrid yarns decrease the dimensions of the damage
to a RC slab and mitigate crack development was shown. However, the proposal that the
geometry of the yarn had any effect was not substantiated in the discussion. The volume of
such a fiber as compared to the other fibers did not necessarily point to the geometry of the
fiber. The length and orientation of the fiber could also have made a difference. Possible
4.4Protective system fiber types
Aromatic polyamides are known as para-aramids (p-aramid) as well as poly para-phenylene
terephthalamide) or PPTA. Their use in protective equipment and industry has saved lives
and improved the performance of several products. They are a class of liquid crystal
polymers. In solution they flow like a liquid but the molecules are oriented in a crystal like
structure. P-aramids were first created in 1965 by Stephanie Kwolek and Herbert Blades of
DuPont [18]. They are produced by a low temperature condensation reaction of an amine and
an acid chloride. The polymer produced is filtered, washed and dissolved in concentrated
sulfuric acid then extruded through spinnerets to form the fiber. After a wet spin process the
polymer is coagulated in sulfuric acid followed by washing and neutralization. To produce
different denier or different moduli fibers, the fiber is taken through different heat treatments
and tension processes. The manufacturing process is critically important in developing the
orientation of the crystalline regions of the polymer. The repetitive sequence of the molecular
backbone containing the aromatic group, benzene, with a para orientation gives rise to its rod
like structure. The overall morphology has been the subject of many studies [36,37] and its
structure is described as polymer chains parallel (Fig 1b) to each other arranged in a radial
pattern with hydrogen bonds between the chains. The fibers consist of sheets with a regular