University of South Carolina
Scholar Commons
Theses and Dissertations
2017
Far-Field Optical Microscopy Based on Stimulated
Emission Depletion
Yunxia Wang
University of South Carolina
Follow this and additional works at:https://scholarcommons.sc.edu/etd
Part of theBiomedical Engineering and Bioengineering Commons
This Open Access Thesis is brought to you by Scholar Commons. It has been accepted for inclusion in Theses and Dissertations by an authorized administrator of Scholar Commons. For more information, please [email protected].
Recommended Citation
Wang, Y.(2017).Far-Field Optical Microscopy Based on Stimulated Emission Depletion.(Master's thesis). Retrieved from
F
AR-
FIELDO
PTICALM
ICROSCOPYB
ASED ONS
TIMULATEDE
MISSIOND
EPLETIONBy
Yunxia Wang
Bachelor of Electronic Information Engineering Fujian Normal University, 2011
Master of Physical Electronics Fujian Normal University, 2014
Submitted in Partial Fulfillment of the Requirements
For the Degree of Master of Science in
Biomedical Engineering
College of Engineering and Computing
University of South Carolina
2017
Accepted by:
Guiren Wang, Director of Thesis
Qian Wang, Reader
DEDICATION
I dedicate my thesis to my family. A special feeling of gratitude to my loving
parents, who always encourages me to study hard and overcome the difficulties I meet.
To my sisters and brother, who have never left my side and encourage me to continue
ACKNOWLEDGEMENTS
Firstly, I wish to express my deepest gratitude to my research supervisors, Dr. Guiren
Wang, for his academic supervision and guidance, constant support and encouragement,
invaluable advice throughout my Master degree. Furthermore, I would like to thank Arkm
Abdalrahman, David Westbury, Wei Zhao, Dr. Zhenhua Bai and all my colleagues in
the lab for their help and support. Moreover, a special thanks to Dr. Qian Wang for his
time, comments, and instructions as a member of my thesis committee. Finally, I would
like to express my deep appreciation and love to my parents, my siblings, who are standing
ABSTRACT
Conventional lens-based (far-field) fluorescence microscopy is a widely used
imaging technique with spatial resolution up to 150–350 nm. However, this technology
cannot discern very small structural features, because the spatial resolution is limited by
diffraction to about half of the wavelength of light (λ/2,λ is the wavelength of light).
Hence, most of the developments in microscopy aim at improving resolution. In the past
decades, stimulated emission depletion (STED) microscopy has been developed to bypass
the diffraction limit for the application in biological imaging with resolution approaching
the nanoscale. The basic principle of STED microscopy is to employ a doughnut-shape
laser called the depletion laser which inhibits fluorescence emission and improves the
resolution of the focal plane by depleting the peripheral fluorescence. Thereby, STED
microscopy avoids the diffraction barrier and improves the spatial resolution. STED
microscopy has been widely applied to address many problems in biology with both
continuous wave and pulsed wave lasers.
Various fluorescent nanoparticles, therefore, are attractive for far-field
super-resolution microscopy. During the past decades, fluorescent nanoparticles have been used
as a fluorescent label, fluorescent probe or marker for super-resolution imaging in vitro
andvivo. In our study, STED microscopy is one of the breakthrough technologies that
belongs to far-field optical microscopy and can reach the nanoscale spatial resolution. We
demonstrate a far-field optical microscopy based on pulsed-wave lasers with the violet
fluorescent dye - Coumarin 102 is applied to verify the stability and reliability of the
STED microscopy. Then, one suitable nanoparticle is selected from three different kinds
of nanoparticles (Silica Nanoparticles-NFv465, flouro-Max blue aqueous fluorescent
nanoparticles, light yellow nanoparticles) based on their absorption and depletion
spectrum and depletion efficiency under different depletion power. Light yellow
fluorescent nanoparticles (LYs) are selected for characterizing the spatial resolution of
the STED microscopy. Finally, the laser beams of the STED microscopy are utilized to
scan along a glass slide, which is coated with the LYs. A two-dimensional image of the
LYs pattern is established and compared with the confocal imaging, indicating that a
spatial resolution (approximately 76.02 nm) has been obtained in the STED imaging so
far. Even though the resolution of STED microscopy with pulsed-laser has the room to be
improved, the present work shows that our lab has successfully built up the STED
TABLE OF CONTENTS
DEDICATION ... iii
ACKNOWLEDGEMENTS ... iv
ABSTRACT ... v
LIST OF FIGURES ... ix
CHAPTER 1: INTRODUCTION ... 1
1.1 FLORESCENCE MICROSCOPY ... 1
1.2 STED MICROSCOPY ... 4
1.3 THE STED MICROSCOPY WITH CW LASER AND PULSED LASER ... 7
1.4 FLUORESCENT DYE USED IN STED MICROSCOPY ... 9
1.5 FLUORESCENT NANOMATERIALS APPLICATION IN STED MICROSCOPY ... 11
1.6 NANOPARTICLE APPLICATION IN THE STED MICROSCOPY ... 14
1.7 THE PURPOSE OF THE STUDY ... 17
CHAPTER 2:APPARATUS ... 20
2.1 BASIC STED MICROSCOPY APPARATUS ... 20
2.2 ALIGNMENT OF STED MICROSCOPY ... 22
2.3 TESTING THE POWER OF STED LASER ... 27
2.4 THE INTRODUCTION OF NIKON MICROSCOPY AND NIS-ELEMENTS AR ... 29
2.5 TESTING THE STABILITY AND RELIABILITY OF STED SYSTEM .... 33
3.1 SPECIMEN PREPARATION OF NANOPARTICLES ... 40
3.2 OPTICAL PROPERTIES OF FLUORO-MAX BLUE AQUEOUS FLUORESCENT PARTICLES ... 42
3.3 THE OPTICAL PROPERTIES OF SILICA NANOPARTICLES-NFv465 .. 45
3.4 OPTICAL PROPERTIES OF LIGHT YELLOW NANOPARTICLES ... 53
3.5 SUMMARY ... 59
CHAPTER 4: RESULT AND DISSCUSION ... 60
4.1 IMAGES OF STED MICROSCOPY ... 60
4.2 DISCUSSION AND OUTLOOK ... 64
LIST
OF
FIGURES
Figure 2.1 A schematic of the STED setup ... 21
Figure 2.2 The overlap of the excitation and depletion focus points ... 25
Figure 2.3 The focus point and intensity 1Figure 2.3 The focus point and intensity profile; (a) STED focus point at x-y plane (b) STED focus point at x-z plane (c) STED focus point at y-z plane (d) Intensity profile along the lines in the image (a). ... 26
Figure 2.4 The device to detect the laser power 1Figure 2.4 The device to detect the laser power; (a) the model of PowerMax USB; (b) the interface of PowerMax. ... 28
Figure 2.5 the number on screen corresponding with power of green laser. ... 29
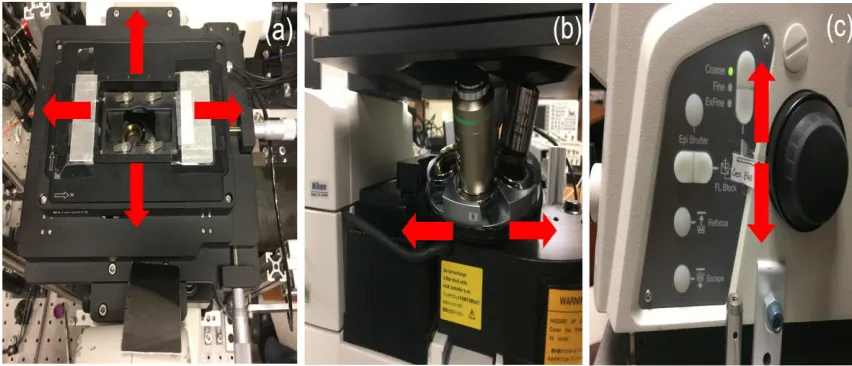
Figure 2.6 Important components of Nikon Microscopy a) Nikon-exclusive high-speed encoded stage; (b) Nikon filter dichroic cube turret; (c) Nikon-specified Piezo Z
specimen stage. ... 30
Figure 2.7 The interface of NIS-Elements AR. ... 31
Figure 2.8 The interface of C2 settings. ... 32
Figure 2.9 (Color online) Optical property of the Coumarin 102 dye. (a) the structural formula of Coumarin 102, excitation and fluorescence spectrum, excitation and STED wavelength, and detection ranges, respectively; (b) The fluorescent signal under the 100 μw UV laser observed in the camera. ... 34
Figure 2.10 The process to prepare the specimen of coumarin 102 dye. Figure 2.10 The process to prepare the specimen of coumarin 102 dye. ... 35
Figure 2.11 Fluorescence intensity using excitation of UV laser of 100 uW and depletion of green laser with various powers: (a) 40mW, (b) 50mW, (c) 83 mW, (d) 235 mW... 36
Figure 2.12 STED depletion efficiency as the function of green laser power under
excitation of violet laser of 100 μW. ... 38
Figure 3.2 Absorption spectrum and emission spectrum of Fluoro-Max Blue Aqueous Fluorescent Particles. ... 42
Figure 3.3 Photo-bleaching of FPs in STED system under the 100μwexcitation laser. .. 43
Figure 3.5 Spectra of NFv465: (a) absorption spectrum and (b) emission spectrum. ... 46
Figure 3.6 Photo-bleaching of NFv465 in the STED system under the 100 μW excitation laser. ... 47
Figure 3.7 Fluorescence intensity using excitation of UV laser of 100 μW and depletion of green laser with various powers 100 µw and depletion of green laser with various powers: (a) 50 mW, (b) 83 mW, (c) 287 mW, (d) 402 mW. ... 49
Figure 3.8 Fluorescence intensity using excitation of UV laser of 200 µW and depletion of green laser with various powers: (a) and (a1) 50 mW, (b) and (b1) 83 mW, (c) and (c1) 200 mW, (d) and (d1) 287 mW, (e) and (e1) 400 mW; (a), (b), (c), (d) and (e) in the liquid state;(a1), (b1), (c1), (d1) and (e1) in the solid state. ... 52
Figure 3.9 Absorption spectrum of LYs. ... 54
Figure 3.10 Photo-bleaching of LYs in the STED system under the 100μw excitation laser ... 55
Figure 3.11 Fluorescence intensity using excitation of UV laser of 100 μw and depletion of green laser with various powers: (a) 40 mW, (b) 83 mW,
(c) 184 mW, (d) 400 mW. ... 56
Figure 3.12 STED depletion efficiency as the function of green (depletion) laser power under 100 μW UV laser. ... 57
Figure 3.13 The pattern of nanoparticle observing by the camera under the excitation laser with 100 μW. ... 58
Figure 4.1 The image of the various parameters. ... 61
Figure 4.2 (a) the confocal image of LYs (b) the intensity profile along the yellow arrow in the confocal image (c) the STED image of LYs (d) the in tensity profile along the yellow arrow in the STED image. ... 63
CHAPTER
1
INTRODUCTION
1.1 FLORESCENCE MICROSCOPY
1.1.1 Basic concept of Fluorescence Microscopy
Fluorescence microscopy is one type of optical microscopies capable of obtaining
detailed images of the sample by the high intensity laser beam exciting fluorophores in
the sample. The fluorophore is one type of chemical substances which can emit different
wavelength light by absorbing the light form the excitation laser (Lichtman and
Conchello 2005). The emission of light from the fluorophores or other materials by
absorbing light is a form of luminescence, called fluorescence.Fluorescence is a
popularly utilized approach in biology. The fluorescencewas firstly proposed by Dr.
Stokes in 1852 to depict the mineral fluorspar that can emit the red light when it is
radiated by the ultraviolet light source (Stokes 1853). The basic theory of the
microscopes that utilizes the transmitted or reflected light was introduced by one group
form Oxford University (Wilson and Sheppard 1984). However, the fluorescence
microscopy that utilizes excited fluorescence differs from that of one which employs
transmitted or reflected light. The primary distinction is that the transmitted or reflected
light is coherent. Whereas, the fluorescence is a kind of incoherent light (Kimura and
Munakata 1989).Fluorescence microscopy gradually has become the mainstream of
(Lichtman and Conchello 2005). Fluorescence microscopy provides the opportunity of
observing cells in vivo and vitro, and allows researchers to investigate the cell
mechanismsand cellular constituents, such as proteins, nucleic acids, and lipids, by using
the fluorescence tagging (Hell 2007, Pankajakshan 2010).
Different fluorophores can be excited by different wavelengths of the lasers. The
images of microscopy are produced by irradiating of the sample with laser beams and
scanning the specific area, using the detector to collect the signal (Agard 1984). In recent
years,a lot of the technical studies of microscopy have been done to enhance the
performance, focusing on improving the contrast between the signal and the background
(Dudovich, Oron et al. 2002). Typically, basic rules should be obeyed for obtaining the
strongest fluorescence signal. For example, the fluorophores had better be excited at the
peak wavelength of the excitation spectrum (λex). Meanwhile, the emission had better be
chosen at the peak wavelength of the emission spectrum (λem) (Pankajakshan 2010).
Generally, every fluorophore has an obvious excitation and emission spectrum
which can be distinguished easily from that of all the other fluorophores (Brazelton and
Blau 2005). In the past several years, many researchers have focused on discovering new
fluorophores as the fluorescent probes to label the objects of the study in the biological
systems (Dean and Palmer 2014). In addition, researchers also developed various
fluorescence microscopy, such as the 4-Pi confocal fluorescence microscopy, the
near-field fluorescence microscopy, the far-near-field fluorescence microscopy, the confocal
scanning fluorescence microscopy and two-photon,wide-field fluorescence microscopy,
laser scanning fluorescence microscopy etc. (Kinosita, Ashikawa et al. 1988, Kimura and
Klar and Hell 1999, Gustafsson, Shao et al. 2008). Until now, the fluorescence
microscopy has a higher resolution than its conventional counterpart (Cremer and Cremer
1974, Brakenhoff, Blom et al. 1979, Wilson and Sheppard 1984, Wright, Centonze et al.
1993). The fluorescence microscopy has realized the 2D and 3D imaging, studying the
imaging of nanoparticles, dyes, complicated cells, tissues and even embryos in 2D and
3D by gathering the emitted fluorescence at every plane. (Velliste and Murphy 2002,
Chen, Velliste et al. 2003, Shtengel, Galbraith et al. 2009, Vicidomini, Moneron et al.
2011).
1.1.2 Far-field fluorescence Microscopy
Meanwhile, the electron and scanning probe microscopy in which the use of light
was abandoned with the development of microscopy techniques (Binnig and Rohrer
1984). The near-field optical microscopy is induced by the scanning probe microscopy
(Lewis, Isaacson et al. 1984, Pohl, Denk et al. 1984), in which the sharp metal tip is
applied to restrict the inter-reaction of the specimen with light to a sub-diffraction spot
(Agard and Sedat 1983, Novotny, Sánchez et al. 1998, Shtengel, Galbraith et al. 2009).
Despite of their success, these microscopes still have not displaced the far-field light
microscopy asthe most extensively used microscopy in thebiological fields. Moreover, it
can scan sample and form the images in 2D or 3D at a rapid and high speed. More
importantly, the fluorescence plays a very important function, permitting to observe
numerous organelles and proteins in the different cells (Klar and Hell 1999). The
fluorescence microscopy has other technological merits,including the relatively deeper
penetration of specimen (Williams, Zipfel et al. 2001), the improvement of signal
scattering emitted light, the suppressive photo-bleaching and background signal from the
outer area of the focal plane and so on (Hell, Booth et al. 1998). Furthermore, the obvious
superiority of far-field fluorescence microscopy is that almost every protein has the
potential to be marked with a fluorescent probe and localize proteins precisely, and
permits dynamic and minimally invasive imaging experiments of biological molecules of
interest (Betzig, Patterson et al. 2006, Gustafsson, Shao et al. 2008, Kobayashi, Ogawa et
al. 2009, Nagano 2009). Compared to far-field fluorescence microscopy, the electron and
probe microscopies have many disadvantages, including the destruction of antigens, a
lack of appropriate antibodies and non-specific binding of antibodies, and the lack of
accessibility of antigens.(Watanabe, Punge et al. 2011). Unquestionably, the far-field
fluorescence microscopy still is one of the most frequently noninvasive imaging tools in
many fields like biological and medical science. This is because that, apart from
more-sophisticated specimen handling, the electron, probe microscopies and near-field
fluorescence microscopy are primarily limited to the imaging of surfaces (Klar and Hell
1999). The far-field fluorescence microscopy gradually becomes an extremely crucial
tool to observe and study bio-molecules, pathways and events in the inside cell, tissues
and even animals (Hell 2009, Vicidomini, Moneron et al. 2011). Finally, the far-field
fluorescence microscopy characterizing resolution beyond the diffraction barrier would
be extraordinary appealing. The knowledge builds the foundation for the advent of
stimulated emission depletion (STED) microscopy.
1.2 STED MICROSCOPY
1.2.1 Diffraction Limit
ranging from the macro level to the micro and even certain cellular organelles level.
However, the diffraction limit becomes a barrier of the resolution because of optics
always having a wave nature. As a result, a vast amount of the super-resolution
technologies to improve resolution have appeared in the recent decades. Until the middle
of 1990s, the first feasible concept was proposed to break the diffraction limit (Hell and
Wichmann 1994, Hell and Kroug 1995).
As we all known, Ernst Abbe was the first person to recognize the limited spatial
resolution of optical microscopy at the end of the nineteenth century (Abbe 1873).
Abbe’s contributions to the diffraction greatly influence the development of microscopy
in the last century. Abbe discovered that the objects could not be distinguished when they
are close to approximate 1/3 of the wavelength of light. Because the smallest focal spot
size that the diffraction permits is the 1/3 of wavelength of light, when the lights focus
with a lens of high numerical aperture (Klar, Engel et al. 2001). As a result, the electron
and probe microscopies using light have been abandoned because of Abbe’s diffraction
barrier (Dyba and Hell 2002). Based on its merits compared to other imaging methods,
the far-field fluorescent microscopy has become a very popular imaging technique.
1.2.2 Advent of STED Microscopy Breaking Diffraction Limit
The arrival of confocal and multiphoton fluorescence microscopies indeed
accelerated the development of 3-D imaging. These techniques, however, did not actually
enhance the resolution yet (Sheppard and Kompfner 1978, Wilson and Sheppard 1984,
Denk, Strickler et al. 1990). It is due to that the conventional far-field fluorescence
microscopy cannot break the diffraction barrier, which is a widely used imaging
In recent decades, several improvements of far-field optical microscopy have
arisen to improve the resolution beyond the Abbe’s diffraction limit (Gustafsson 2005,
Bretschneider, Eggeling et al. 2007). Under this circumstances, the emergence of
stimulated emission depletion (STED) microscopy is in response to the needs of
microscopy development.STED microscopy, as one of the breakthrough technologies,
still belongs to far-field optical microscopy and can defeat the diffraction limit, reaching
the nanoscale spatial resolution. STED derives from the reversible saturated optical
fluorescence transition concept (Klar, Engel et al. 2001, Dyba and Hell 2002, Westphal
and Hell 2005, Hotta, Fron et al. 2010)and was first establishedby Hell and Wichmann
(Hell and Wichmann 1994, Hell, Booth et al. 1998, Willig, Rizzoli et al. 2006) . The
optical fluorescence transition demonstrates thatthe simulated emission can degrade the
fluorescent state. However, conventional lens-based optical microscopy cannot discern
very small structural features, because the spatial resolution is limited by diffraction to
about half of the wavelength of light (λ/2,λ is the wavelength of light) (Huang and
Zheludev 2009). Hence, most of the developments in microscopy aim at improving the
resolution. In the past decades, STED microscopy (Hell and Wichmann 1994, Hell 2007)
has been developed to bypass the diffraction limit for application in biological imaging
with resolution approaching nanoscale. The basic principle of STED microscopy is to
employ a second laser donut beam called the depletion laser to inhibit fluorescence
emission and improve the resolution of the focal plane by depleting the peripheral
fluorescence. The emergence of STED microscopy (Klar, Jakobs et al. 2000, Donnert,
Keller et al. 2006, Willig, Rizzoli et al. 2006) indicatedthat the diffraction limit can be
enables the resolution to achieve macro-molecular scale. STED microscopy avoids the
diffraction barrier and increases the spatial resolution. STED microscopy has been widely
applied to address many problems in biology with both continuous wave (Rankin, Kellner
et al. 2008, Westphal, Rizzoli et al. 2008) and pulsed lasers (Willig, Harke et al. 2007,
Wildanger, Rittweger et al. 2008).
In order to calculate the resolution of STED microscopy, the theoreticallateral
spatial resolution of STED microscopy is demonstrated in the equation (1) (Li, Liu et al.
2013).
𝛥𝑥 =
𝜆2𝑛𝑠𝑖𝑛𝜃√1+𝐼/𝐼𝑠𝑎𝑡
(1)
In this equation, where λ, n, and 𝜃are beam wavelength (Hell, Dyba et al. 2004,
Westphal and Hell 2005, Takasaki, Ding et al. 2013, Xie, Liu et al. 2013), refractive
index, and half aperture angle of the objective, respectively. I is the maximum of the
intensity of the doughnut, and Isat is the saturation intensity. Meanwhile, nsin(θ) stands
for the numerical aperture (NA) of the objective lens. The effective resolution of STED
microscopy is controlled by both NA and the square root of the saturation factor I/Isat.
1.3 THE STED MICROSCOPY WITH CW LASER AND PULSED LASER
The STED microscopy is restricted due to the expense of appropriate light sources
capable of switching the fluorescent ability of the dye off, availability, and wavelength
etc. (Rankin, Kellner et al. 2008). It is no doubt that the selecting of the light source for
STED microscopy plays a major role in simplifying and broadening the application of
STED (Westphal, Blanca et al. 2003, Wildanger, Rittweger et al. 2008). In addition,
Suitable light sources can benefit the resolution of STED microscopy, i.e. the shorter of
STED wavelengths make it possible for the users to freely choose fluorophores for
specimen tagging. Massive research has been done to search the new light sources for the
STED microscopy. Until now, STED microscopy has been successfully displayed by
employing the titanium sapphire (Klar, Jakobs et al. 2000, Donnert, Keller et al. 2006,
Harke, Keller et al. 2008, Rankin, Moneron et al. 2011), diode (Westphal, Blanca et al.
2003), continuous wave (Willig, Harke et al. 2007), and supercontinuum laser sources
(Auksorius, Boruah et al. 2008, Wildanger, Rittweger et al. 2008). For example, the
STED microscopy with the pulsed-laser is firstly introduced by Stefan W. Hell and Jan
Wichmann in the 1994 (Hell and Wichmann 1994). The STED microscopy with the
continuous wave (CW) beams was proposed by Katrin I Willig etc. (Willig, Harke et al.
2007), which can highly simplify the setup of the STED microscopy. In the Brian R.
Rankin’s group, the STED microscopy with the multicolor stimulated Raman-scattering
light source enables the simple implementation of multicolor imaging.It produces an
output spectrum during multiple available wavelengths from green to red with potential
for further extension (Rankin, Kellner et al. 2008).
According to the reports, the presented STED microscopy is mainly implemented
by the pulsed lasers and CW lasers for excitation. Both of STED microscopies have
inherent advantages and disadvantages respectively. Typically, the setup of the pulsed
STED system is more complicated and expensive for the optical setup and additional
electronic equipment: the pulse length has to be adapted to the requirements of the
system, being aligned in time with complex electronics (Harke 2008). In contrast, CW
lasers can simplify the setup procedures, which also lead to a price decrease of the
intensities. Because the photo-damage mechanisms scale with at least the square of the
intensity of the irradiated light (Hopt and Neher 2001, Kuang, Zhao et al. 2010).
Generally, the expense of pulsed laser sources is much higher than those for the
CW ones. For the pulsed ones, the availability of the excitation is narrower than the CW
laser sources. For example, the most universal laser for the pulsed laser systems is
Titanium: Sapphire laser, in which the wavelength is confined to the near-infrared region.
Many different dyes can work in the visible wavelength region.it is expected that the laser
can be shifted to the visible wavelength region. However, the shift requires a second extra
laser system such as an optic parametric oscillator (OPO), leading to a quite complicated
and expensive pulsed-STED setup in the visible range.
The obvious superiority of a pulsed system is that high intensities can be produced
easily by a standard laser, which means that high intensities normally lead to high
depletion efficiency. Ultimately, there will have a better resolution. Here we demonstrate
that the application of pulsed light source in STED microscopy is more attractive for
obtaining higher resolution than CW STED.
1.4 FLUORESCENT DYE USED IN STED MICROSCOPY
A broad range of available fluorescent dyes have been developed. The choice of
the types of fluorescent dyes for STED is extremely crucial. Because the fluorescent dyes
control the higher sub-diffraction resolution of STED microscopy. Based on the various
reports, fluorescent dyes employed in the STED microscopy typically excite wavelength
ranging from 440 nm to 637nm. More importantly, many fluorescent dyes have made an
effect on the improvement of resolution for microscopy imaging technologies. Common
and ATTO 932, etc. (Dyba, Keller et al. 2005, Kellner, Baier et al. 2007, Meyer,
Wildanger et al. 2008, Punge, Rizzoli et al. 2008).
STED microscopy becomes a widely used instrument to investigate a variety of
specimens by obtaining their noninvasive imaging.For the STED microscopy, the
principle is that the stimulated emission has ability to deplete the fluorescent state,
thereby making the focal areas of substance excitation smaller than the diffraction limit.
For reaching a better sub-diffraction resolution, the selection of a fluorescent dye applied
into STED microscopy is extremely vital. There mainly have two requirements for
choosing a suitable dye. First, the dye had better be photo-stable with high fluorescence
quantum yieldunder prolonged irradiation. Second, for making excitation process and the
depletion process not affect each other, the absorbance and the fluorescence spectrum of
the dye had better overlap as less as possible.
Over the past couple of decades, STED microscopy has a rapid development by a
vast of studies with the target to improve the sub-diffraction resolution. Based on the
reports, the previous study results show various fluorescent dyes with different excitation
wavelength employed in microscopy. At red light band, ATTO 647N, ATTO 633 and JA
26 have been reported to have the smallest lateral resolution of 16 nm (Westphal, Blanca
et al. 2003, Westphal, Kastrup et al. 2003, Westphal and Hell 2005, Westphal, Seeger et
al. 2005, Punge, Rizzoli et al. 2008). At the orange light band, the fluorescent dyes of
ATTO 590, Alexa 594 and ATTO 594 can have a minimum resolution reaching 20 nm in
2D plane (Meyer, Wildanger et al. 2008, Wildanger, Medda et al. 2009).At the yellow
light band, Dyba et al reported that Pyridine 2 and RH 414 could reach the best resolution
light band, more dyes had been validated in comparison with other light bands,
containing ATTO565, MR 121 SE, NK51, etc. Rittweger et al employed Nitrogen
vacancies in diamond to reach the smallest resolution of 6nm at the x-y plane (Dyba,
Jakobs et al. 2003, Wildanger, Rittweger et al. 2008, Hell and Rittweger 2009).At the
cyan light band, DY-485 XL, Alexa 488, etc. have been validated by a number of
researchers, obtaining resolution up to 40 nm (Meyer, Wildanger et al. 2008, Moneron,
Medda et al. 2010). At the blue light band, the resolution using ATTO 435 and ATTO
932 could achieve 25 nm (Donnert, Keller et al. 2006, Kellner, Baier et al. 2007, Meyer,
Wildanger et al. 2008). At the violet light band, even though few fluorescent dyes have
been studied, ATTO 390 still is validated to be suitable in STED microscopy. Briefly,
various excitation wavelengths of fluorescent dyes have been investigated ranging from
440 nm to 637 nm. The requirement of choosing dyes should have photo-stability, have
low overlap rate between the absorbance and the fluorescence spectrum, and own
relatively long excited-state lifetimes. Furthermore, the different fluorescent dyes can
obtain different best resolution in the microscopy imaging technologies. Therefore,
selecting a suitable fluorescent dye becomes extraordinarily important for STED
microscopy.
1.5 FLUORESCENT NANOMATERIALS APPLICATION IN STED MICROSCOPY
1.5.1 Aim of Fluorescent Nanomaterial Applied in STED Microscopy
In all kinds of stimuli-responsive signal types, fluorescent emission is outstanding
and promising. There have two reasons. One is that fluorescent signal intensity can be
easily and sensitively detected. Another reason is that fluorescence can be well monitored
with many identifying characteristics, like wavelength, signal intensity, depletion
microscopy are employed, like STED microscopy, photo-switchable fluorescent
nanomaterials significantly make an effect on improving the super-high resolution of the
fluorescence imaging. Therefore, the different types of photo-switchable fluorescent
nanomaterials are developed to play a key role in the biology and other fields. In addition,
fluorescence nanomaterials expand the various researches and applications at the
nano-meter level. The applicability of nanomaterials for the aims of imaging has created a
variety of approaches for imaging with characteristics, consisting of the improvement of
brightness, even the better distribution, and the inertness to micro-surrounding (Wolfbeis
2015).
Based on the theory of STED system,the bright fluorescence signal of samples
passes through the objective and then the photo multiplier tube (PMT) or the avalanche
photodiode (APD) is used to collect the signal. The fluorescent intensity could be
depleted at any part except from the central part of the doughnut-shape spot.
Unquestionably, the number of emitted photons of STED microscopy is significantly
reduced in contrast with conventional confocal microscopy. As a result, the resolution of
STED system is greatly improved. However, in term of the resolution equation, if we
want to detect suitable signal and obtain high resolution, the choice of fluorophores exerts
an important influence. Of course, the appropriate fluorophores for STED microscopy
should follow to certain important requirements, consisting of high resistance to the
photo-bleaching, short wavelength, high depletion rate, low overlap rate between the
absorption and the emission spectrum, and relatively long excited-state lifetimes (Klar,
Jakobs et al. 2000).In addition, the key character of suitable fluorophores is the value of
Various fluorescent nanomaterials, therefore, are attractive for far-field
super-resolution microscopy. Nano-materials not only can extend the application of STED
system, but also can be applied as fluorescent probe to stain proteins, organelles etc.
More importantly, they can provide help to address various and fundamental problems in
the region of cell biology and medicine. Especially, the STED system can study the
activities, biochemical and biophysical properties of cell nucleus, cytoplasm, organelles
and membranes, even involving in probing and extracting the desired information at the
spatial resolution of nanometer. Tremendous advances in STED techniques with high
resolution allow single nanomaterial to label biomolecules, ions, and microstructures etc.
in live cells, which is able to monitor the movement of nanomaterials in the real time.
Meanwhile, the optical and biological properties of nanomaterials in live cells are also
commendably summarized on the base of vast researches.
In the recent decades, a variety of nanomaterials have been studied by the STED
system, consisting of carbon nanotubes (CNTs), quantum dots (QDs), metal clusters,
up-conversionalnanomaterials, fluorescent nano-diamonds, fluorescently doped silicaand
sol–gels, hydrophilic polymers (hydrogels), hydrophobic organic polymers,
semiconducting polymer dots, and polystyrene (PS) nanoparticles etc. (Xu, Wang et al.
2007).
Take the quantum dots (QDs) as an example. Even though the QDs are frequently
used in the optical bio-imaging, QDs are not very suitable for STED microscopy due to
their broad absorption spectrum.For the STED beam, there has a big possibility for
re-exciting an emitter, resulting in blurring of STED image and even seriously destroying
in term of the QDs, a new discovery was published (Irvine, Staudt et al. 2008). The report
showed that the absorption coefficient of Mn-doped ZnSe QDs could be negligible at λ
>450 nm, but fluorescence is emitted at λmax= 580 nm. Obviously, the fluorescence
could be effectively depleted by the stimulated emission at λ= 664 nm (Irvine, Staudt et
al. 2008). A resolution could attain to 45 nm. Especially, the new appearance of various
nanomaterials leads to the new and promising methods for diagnosis and therapy of
certain diseases, including the therapy of cancers. The combination of therapeutic
methods with diagnostic approaches such as imaging technology causese so-called
theranostic nanomaterials. Carbon nanomaterials and carbon nanotubes are on the
topmost of theranostic nanomaterials for the disease treatment. Moreover, thefluorescent
nano-diamond (Tzeng, Faklaris et al. 2011) as a fluorescent label or marker can be used
for in cells for super-resolution imaging. Therefore, the new discovery and exploration of
florescent nanomaterials could have important significance for improving resolution in
the fluorescence microscopy. However, on the other hand, the primary disadvantage of
STED application is the lack of the ideality of existing nanomaterials with fluorophores.
To find and explore more and more fluorescent nanomaterials become an important
factor for achieving the theory with no limit of resolution for STED microscopy.
1.6 NANOPARTICLE APPLICATION IN THE STED MICROSCOPY
The common use of nanoparticles includes four aspects as following: plain
fluorescence imaging of cells, targeted imaging, imaging of chemical species, and
imaging of temperature (Tzeng, Faklaris et al. 2011). The nanoparticle without
fluorescence is common such as hybrid nanoparticles (Klar, Jakobs et al. 2000) and gold
their applicability in a number of significantly technological fields like energy conversion
(Salerno and Daban 2003) and catalysis (Freeman, Finder et al. 2010). The largest
challenge of using the STED microscopy is to get a perfect doughnut. The intensity of the
perfect doughnut at the center should be less than 1% of the intensity of the maximum
(Rittweger, Han et al. 2009). Furthermore, the overlap between STED and excitation
beam, the uniform profile of doughnut and excitation has an important effect on attaining
the best resolution. At this point, the gold nanoparticles play a vital role to check if the
doughnut is optimal (Wildanger, Bückers et al. 2009).
Another popular nanoparticle is fluorescent nanoparticle applied in fluorescent
imaging, mainly of cells and tissues in the STED microscopy. Fluorescent nanoparticles
are extremely important due to their applicability in numerous significant fields such as
biological and medical science (Santra, Dutta et al. 2005, Wildanger, Bückers et al.
2009).Additionally, the fluorescent nanoparticles as optical agents for applications in
different types of cells are also becoming increasingly common.The fluorescent
nanoparticles could be internalized by cells prior to the surgery, which is different from
the fluorescent dyes and gadolinium chelates (Santra, Dutta et al. 2005, Wildanger,
Bückers et al. 2009). Furthermore, the fluorescent nanoparticles can stay very well in the
cell without the diffusion out of cells during the whole process of diagnose. Therefore,
the fluorescent nanoparticle is a good and promising candidate for various researches in
many technologically different fields at the nanoscale level.
Recently, a nanoparticle named CLIO-Cy5.5 has been developed, which can be
applied into both an MRI contrast agent and a near-infrared fluorescent optical probe
fluorescent nanoparticles. Fluorescent nano-diamonds have great potential for use in
biology and medicine (Vaijayanthimala and Chang 2009, Xing and Dai 2009).
Especially, using the STED microscopy is current possible to collect
diffraction-unlimited images of fluorescent nano-diamonds. The improvement of resolution by using
the STED microscopy could observe the detailed structures of different and various
samples, consisting of particularly small organelles and compartments.Based on
super-resolution researches of fluorescent nano-diamonds, we can extend the study to the
application of cellular-imaging.
From another point of view, nanoparticles have considerable advantages
compared to the molecular probes, such as nontoxicity and unwanted sequestration. The
bond of molecular probes by using cellular proteins could have an influence on the
probes’ optical properties and the proteins’ function. In comparison, the fluorescent
nanoparticles are substantially inactive, without interaction with cellular proteins and the
influence of outer proteins on optical properties. More importantly, the photo-stability of
fluorescent nanoparticles is more stable than those of molecular probes. Most
nanoparticles could be readily internalized into both cells and tissues. Until now, many
various kinds of nanoparticles are available on commercials.
Nanoparticles are regarded as an important tool applied into biology science. We
can anticipate that the more types of nanoparticles are discovered as a type of
photo-stable bio-labels and long-term cell trackers. The combination of the great photo-stability
of fluorescent nanoparticles with STED microscopy is expected to produce many
changeswith high super-high resolution and excellent precision (Tzeng, Faklaris et al.
2011).
1.7 THE PURPOSE OF THE STUDY
The microscopy should be one of the strongest instruments for researchers
investigating in the various fields, especially in the biology. The microscopy makes it
possible to study specimen and obtain the detailed information about the size, the
appearance, the structure and even the optical properties of the investigated subjects.
Therefore, it plays a key role in multifarious and interdisciplinary fields.
The microscopy technologies mostly are divided into two types: the near and the
far-field optical microscopy. In general, the near-field microscopy has better resolution
compared to the far-filed microscopy. The near-field microscopy like atomic force
microscopy, scanning tunneling microscopy, and scanning optical microscopy has a
better resolution than the far-field microscopy (Abbe 1873, Binnig and Rohrer 1987, Pohl
and Courjon 2012). Whereas, all the approaches of the near-field microscopy mainly
collect information from the surface of the samples, the information hidden below is
hardly to be extracted. The conventional far-field microscopy, nonetheless, has the high
penetration depth into the specimen. More importantly, the far-filed microscopy permits
researchers to utilize the marker for meeting the required specificity. Therefore, more
researchers focus on the development of far-field microscopy.
Obviously, the visualization of tiny and fine structures conduces greatly to a better
explanation of the features of the study objects. Hence, the resolution is the most
important characteristic of the microscopy, which demonstrates the capacity to recognize
investigating the minute structure of the sample. Consequently, the mass of
improvements in microscopy are emphasis on the better resolution. Obviously, the
enhancement of resolution always results in the new discoveries and new breakthrough in
different fields.
Furthermore, with the exception of bio-imaging, STED nanoscopy has also been
successfully applied to nanoscopic measurement in micro- and nano-fluidics (Kazoe et al,
2011 ; Kuang et al, 2010). For instance, laser induced fluorescence photo-bleaching
anemometer (LIFPA) is a new method that can measure flow velocity with simultaneously
high spatial and temporal resolution (Zhao et al, 2016). With STED microscopy, LIFPA
has the potential to measure the flow velocity profile in a nano-channel (Kuang et al, 2010)
and interfacial flows, such as electrical double layers and slip flows. Developing new CDs
that can be used for UV light could enable new applications of CDs to the measurement of
flow velocity and concentration profiles in micro- and nano-fluidics in the future.
Therefore, we develop and align a kind of the pulsed-wave STED microscopy
with excitation laser (405 nm) and the STED laser (532 nm). The aim of our experiment
is to test the stability and reliability of the pulsed-wave STED system, and obtain the
higher resolution in the STED image by comparing with the confocal image.
We first align the pulsed-laser STED microscopy by using the gold nanoparticle.
Observe the focus points of both lasers through the camera and analyze the PFS of both
lasers after scanning the gold nanoparticle. Then we use the coumarin 102 to test the
stability and reliability of the STED system. And then we analyze the absorption and
emission spectrum and measure the depletion efficiency of three kinds of nanoparticles
pulsed-wave STED microscopy to scan the sample of nanoparticles. To the end, we compare the
confocal image with STED image, showing that the STED images have the higher
resolution. Hence, this result illustrates that STED system is successfully aligned by our
lab.In contrast to near-field scanning optical microscopy, this approach can produce
CHAPTER
2
APPARATUS
2.1 BASIC STED MICROSCOPY APPARATUS
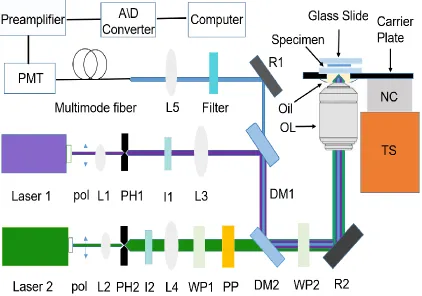
The setup of two-beam path STED microscopy is depicted in the Figure 2.1,
which is featured with a wavelength of pulsed-wave 405 nm for excitation and a
wavelength of pulsed-wave 532 nm for depletion, respectively. For excitation beam, the
linear-polarized beam is guided through a lens–pinhole–lens system consisting of lens
(L1), pinhole (PH1) and lens (L3) to enlarge the diameter of the beam. The beam is firstly
reflected by a dichroic mirror (DM1) and then is reflected by a second dichroic mirror
(DM2). For depletion beam, the linear-polarized beam is guided and enlarged by another
lens-pinhole-lens system consisting of lens (L2), pinhole (PH2) and lens (L4). Then, the
depletion beam passes through a l/2 wave plate and phase plate PP (Vortex phase plate
VPP-1, RPC photonic Inc., NY). The wave plate enables the excitation beam to have the
same direction with the depletion beam. Meanwhile, the phase plate can generate a
doughnut pattern.
The excitation and depletion beams overlap and pass through a 1/4 wave plate
WP2. The linear polarization beams are changed into circular pattern by the wave plate
WP2, and reflected by a reflector R2 and then focused by an objective lens OL (100X,
PlanApo, NA=1.4 oil immersions, Olympus, NY). The metallic reflector R2 can avoid
a microscopy slide. In addition, it is fixed on a nano-cube NC piezo-scanning stage
(P-611.3FS, PI Inc.), which can be scanned in all three spatial directions with a positioning
resolution of 1 nm for fine tune. Rough tune is adjusted by three-axis manual translation
stages. The fluorescent signal is collected by objective lens and goes through the two
dichroic mirrors (DM1 and DM2). And then the signal is reflected by R1 and gathered by
a photomultiplier tube (PMT). The preamplifier amplifies the signal, which is acquired by
an A/D converter and saved to a computer.
Figure 2.1 A schematic of the STED setup
2.2 ALIGNMENT OF STED MICROSCOPY
It has been known that the STED microscopy can arrive the super-resolution
beyond the Abbe limit. The diffraction barrier is overcome by using the STED laser to
quench the excited organic molecules at the edge of the focal area. Among the variety of
super- resolution imaging techniques, STED microscopy is the most universal. STED
microscopy utilizes the properties of fluorescence to produce a smaller effective point
spread function (PSF). As a rule, the point spread function (PSF) always plays a very
vital part in comprehending imaging effects and presentation, like the analytical
resolution limit and the optical sectioning ability. For point-like illumination and
detection, the distribution of PSF is dependent on the quality of the lens, the numerical
aperture (NA) of the microscopy objective, and the wavelengths of the emission and
excitation light (WA 1959). The PSF can distinguish the object points out of the focal
region.
Hence, a crucial requisite for super-resolution STED is the quality of the effective
doughnut-shaped point spread functions (PSFs).Before spontaneously fluorescing, the
stimulated emission forces the excitedfluorescent photons back to the ground state of
STED microscopy. Besides, the fluorescence-depleting transition is regulated by another
laser-depletion laser (Green Laser: 532nm). The focus point of the depletion laser
characterizes acentral intensity as zerowhich limits the sub-diffraction regionfrom
whichfluorescent light is likely to be emitted and gathered. Herein, theSTED
microscopy demands accurate alignment, from the focus point of the center of the
excitation laser to the focus point of intensity-zero depletion laser. In addition, STED
reasonable to adjust the power of the excitation to its smallest level of measurement for
small particles or beads, especially when STED resolutionrequires to be measured.
The conventional way to align the focus point of the both laser is to image the
scattered laser light from gold nanoparticle. However, Gold nanoparticles (<200nm) are
generally employed,via detecting if the excitation PSF with the depletion doughnut PSF
overlap very well in STED. Accordingly, the detection of PSF is normally much more
difficult than imaging a specimen in the STED microscopy. Becausethe tip of the gold
nanoparticle is hard to createthe reflection signal. The method is very effective to
measure the PSFs of both laser, modulating the position of the focus point for the aim of
overlapping each other very well.
Yet, this traditional approach has some disadvantages. As mentioned above, the
photo-bleaching is severe when first scan the gold nanoparticle with excitation laser and
then scan the gold nanoparticle with depletion laser. Then, the specimen should be
prepared with caution. This is because if the nanoparticles are distribution with high
concentration, this is easy to generate self-accumulation, causing the problem which we
could not detect the PSF accurately. Third, this approach mainly depends on manual
operation to align the position of the focus of both lasers. Therefore, researchers put
much attention on improving the STED alignment.Travis J etc. proposed to employ
adaptive optics for achieving the purpose of automatically aligning STED microscopy
[64]. Importantly, this approach can make spatial alignment of the focus point of
excitation and depletion in the 3D imaging. One of crucial advantages is employing the
feedback of the STED fluorescent images to guarantee theprecise alignment, aiming at
reflection. In our lad, we previously used a different method to test whether the excitation
and depletion lasers overlap very well. But the disadvantage of the method is not accurate
enough.
The previous method: we manually used the reflection principle to adjust and
modulate optical elements by multiple mirrors and a piece of white paper, visually
checking the excitation and the STED beams whether they are aligned very well at the
beginning. And then adjusted the manual PI stage (Physic Instrument P-611.3 Nano-Cube
XYZ Piezo Stage), especially adjusted Z axis, to modulate a suitable position for
obtaining the excitation and STED focus points. Then we used the cameras to observe the
excitation laser focus point first, and then to observe the STED laser focus point. Finally,
we observed the both laser focus points at the same time.
The scanning gold nanoparticle method: we tested the point-spread functions
(PSFs) of the both focus points, verifying that the PSFs of both lasers were aligned very
well in the focal plane. In the end, we measured the PSFs of both beams via scanning a
gold nanoparticle with the excitation beam firstly, and then with the STED beam. The
results are shown in the Figure 2.2, showing that both the excitation spot and STED spot
overlap properly. However, we could see that the intensity of STED laser is not zero in
the middle of STED focus spot. When we find that the excitation and STED beams
cannot overlap very well, the STED system should be aligned again. Otherwise, you
could not obtain high-resolution images, becausetheSTED alignment plays a very
important part in achieving high resolution for STED microscopy. What is more, the
STED alignment is the foundation of the following experiments.
Figure 2.2 The overlap of the excitation and depletion focus points (a) Effective fluorescent spot (b) Excitation spot (c) STED spot.
they overlapped each other very well, showing in the Figure 2.2. Then we further got the
intensity profile of the excitation and the STED beams by scanning the gold nanoparticle
and analyzing them via the NIKON software, then checked whether they were properly
aligned. The results of excitation and STED focus spots in the lateral (XY) and axial (XZ,
YZ) directions, and intensity profiles in the lateral plane are clearly shown in Figure 2.3,
verifying that the two PSFs of excitation and depletion lasers are aligned in the focal
plane very well. The results shown in the Figure 2.3(a), (b) and (c) illustrate the STED
focus spot and excitation focus spot overlap very well.
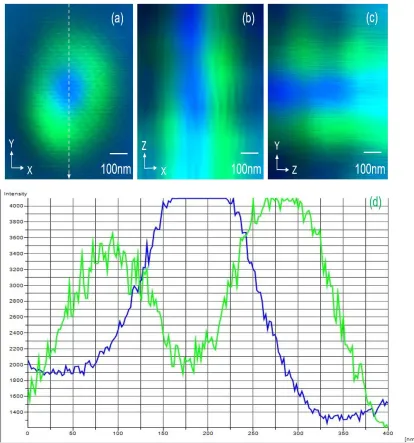
We could observe from Figure 2.3 (d), the excitation focus beam locates the
middle of STED focus beam. We could notice that the intensity of STED laser is not very
uniform in the figure 2.3 (a), (b) and (c). For more details, the result shown in the Figure
(d) confirms that the intensity of STED laser is not inform and is not zero (about 1500) in
the middle of focus spot. Meanwhile, we can easily see that the background noise is a
little strong. On the other hand, the intensity profile of excitation laser is not very
symmetrical, because the intensity of excitation laser could reach 2000 at the beginning,
disadvantages will affect the resolution of STED microscopy, this is the best focus spot
we could get currently. We will find new technologies and methods to improve these
disadvantages in the future.
Figure 2.3 The focus point and intensity profile; (a) STED focus point at x-y plane (b) STED focus point at x-z plane (c) STED focus point at y-z plane (d) Intensity profile along the lines in the image (a).
2.3 TESTING THE POWER OF STED LASER
In our STED system, there have two the laser devices-green laser (532nm) and
blue violet laser (405nm). But these two laser devices just have digital display without
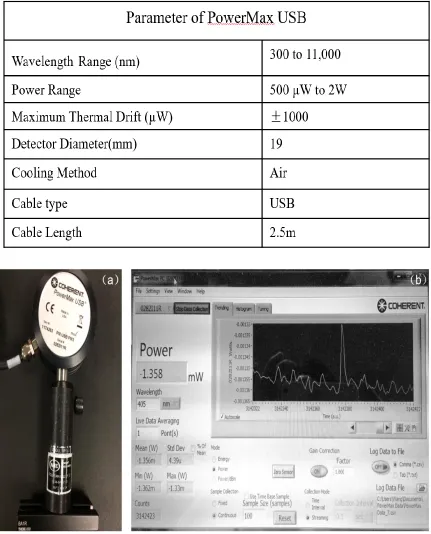
the corresponding laser power. In consequence, we first use the PowerMax-USB/RS
sensors (Coherent.Inc.) to detect the power of the green laser, as shown in the Figure 2.4.
Before doing this experiment, we firstly confirmed the model specifications of the
PowerMax-USB/RS (mode number: 11742630), so that we could choose the right model
to conduct this experiment. As shown in the table 2.1, the model 11742630 could
accurately detect the power of STED laser.
In this experiment, we connected the PowerMax-USB/RS (Figure 2.4 (a)) to the
computer, and opened the related software at this computer; then you can see the
interface of the software (Figure 2.4 (b)). We used the PowerMax-USB/RS sensors to
detect the green laser at the far end of STED system. Before putting the
PowerMax-USB/RS sensor at the right position, we firstly clicked “zero sensor” on the interface of
the software to make sure the initial power is zero when there is no any laser source. And
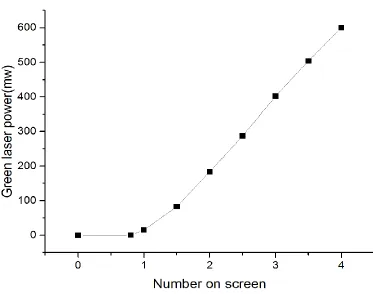
then we put the PowerMax-USB/RS at the right position and changed the number of
display screen of the green laser, then the corresponding power of green laser would
show on the interface of PowerMax. Finally, recorded them carefully by using the Origin
Software, and depicted the relevant curve line, showing the number on screen
corresponding with power of green laser (Figure 2.5). In the Figure 2.5, w the power of
the green laser device is in proportion to the number on screen. This experiment will help
us to determine power of green laser, choose the suitable power of green laser for
Table 2.1 The parameter of PowerMax USB.
Figure 2.5 the number on screen corresponding with power of green laser.
2.4 THE INTRODUCTION OF NIKON MICROSCOPY AND NIS-ELEMENTS AR
In our experiment, we mainly use Nikon software--NIS-Elements AR. We use this
software to combine with the Nikon microscopy (Inverted Research Microscopy
ECLIPSE Ti) to scan the specimen. Nikon microscopy is capable of taking on the most
advanced bio-science imaging, being an important part of the STED microscopy in our
lab. Next, I will introduce Nikon microscopy firstly, then introduce the NIS-Elements
AR. The Nikon Microscopy can greatly enhance the scanning speed of STED microscopy
to reduce the photo-bleaching largely, because of the following individual motorized
components: Nikon-exclusive high-speed encoded stage, Nikon-specified Piezo Z
The operation and changeover speed of the objectives, X-Y stage, the excitation/barrier
filters etc. have been enormously advanced, realizing stress-free operational surrounding
that permits research fellows to concentrate on the observations and analysis. We can
change the scanning area by controlling the X-Y stage from the four directions and then
change the scanning depth of specimen by the Piezo Z stage from the two directions,
displaying in the Figure 2.6 (a) and (c). As exhibited in the Figure 2.6 (b), we can flexibly
and fleetly change the different objectives.
Nikon microscopy plays a crucial role in our pulsed-STED microscopy. There has
another important constituent part - the Nikon’s comprehensive imaging
software-NIS-Elements AR. Thegraphical user interface (GUI) of NIS-Elements AR is demonstrated in
the Figure 2.7. From Figure 2.7, we can see that the software-NIS-Elements AR can
comprehensively control the microscopy, cameras components. The intuitional GUI and
effective workflow enable all kinds of functions to be performed easily and to get the
automated imaging sequences in 6 Dimensions (X, Y, Z, time, wavelength, multipoint).
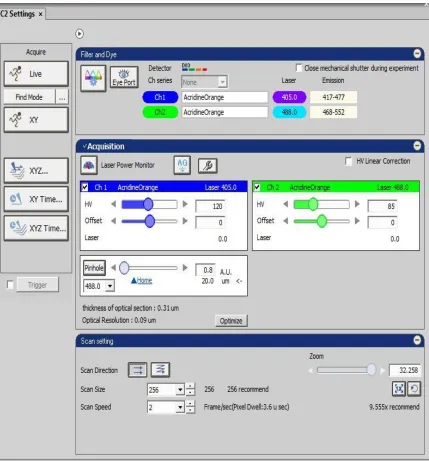
Figure 2.8 The interface of C2 settings.
In our experiment, we mainly use one application of this software to perform the
scanning in the C2 setting with changing the size of pinhole, HV, scan direction, scan
size, scan speed and even zoom, demonstrating in the Figure 2.8. When the parameters
are chosen, we can first click the button “live” to observe the situation of scanning area.
Additionally, the NIS- Elements AR has various functions to analyz and manage the
scanning data, like intensity profile.
2.5 TESTING THE STABILITY AND RELIABILITY OF STED SYSTEM
The excitation and emission spectrums of the dye - Coumarin 102 employed in the
experiment can be seen graphically in the Figure 2.9 (a) and the fluorescent signal is
shown in the Figure 2.9 (b) by observing in the QImaging QICAM 1394 FireWire Digital
CCD Camera. From figure 2.9 (a),we can see that the coumarin is excited maximally at
around 412 nm and is emitted maximally at about 470 nm. The certain important points
of the laser specifications of the STED system can be observed in purple, green and blue.
Furthermore, the wavelength of the excitation beam at approximately 405nm of the
STED system is demonstrated by the purple line, closing to the excitation maximum of
the coumarin. The green line stands for the STED depletion beam wavelength at near
532nm, which is a little far from the maximal emission wavelength of 470 nm. Because
there has an overlap between absorption spectra and emission spectra for ensuring that
the depletion wavelength does not disrupt the absorption of coumarin. Set the STED
beam wavelength generally to shift toward a little longer wavelength. This is the major
reason why choose the wavelength of STED beam with 532nm. The detection range of
the STED system is marked in blue rectangle, ranging from 440nm to 490nm, as
Figure 2.9 (Color online) Optical property of the Coumarin 102 dye. (a) the structural formula of Coumarin 102, excitation and fluorescence spectrum, excitation and STED wavelength, and detection ranges, respectively; (b) The fluorescent signal under the 100 μw UV laser observed in the camera.
The whole process of preparation of coumarin 102 dye is shown in the Figure
2.10. The detailed method is described in the following. We firstly used the electronic
scale to weigh the coumarin 102 powder; the weight of coumarin is 146.2mg. And then
put the coumarin 102 powder into the test tube, then poured the Ethyl alcohol (50 ml) into
the same test tube. Put the cover on the test tube, and then placed the test tube with the
coumarin 102 powder and alcohol in the ultrasonic cleaner to shake for 3 minutes. The
coumarin 102 would totally solve in the Ethyl alcohol solution after ultrasonic. We could
find that the color of the solution from white turning into green, which indicated that we
Figure 2.10 The process to prepare the specimen of coumarin 102 dye.
Finally, took some coumarin solution by the pipette and repositioned them into
the reservoir. Lately, we would use the reservoir with coumarin solution to test the
stability and reliability of STED system.
In addition, the coumarin solution is very easy to be photo-bleached under light.
Therefore, it is important to store the coumarin solution. For our lab, we used the silver
paper to warp entirely the test tube of coumarin solution and place them into the freezer.
In this part, we mainly measure the depletion rate of coumarin 102 dye though the
STED system we align by ourselves,aiming at verifying the stability and reliability of the
system and guaranteeing to high STED resolution for scanning nanoparticles.
The experiment is to validate whether the fluorescent intensity of the coumarin
can be depleted by adding the second laser -STED laser or not. In term of the
requirements for choosing the dye for STED system, the excitation and emission
spectrums of the Coumarin 102 can be applied into STED system.Hence,it normally
Figure 2.11 Fluorescence intensity using excitation of UV laser of 100 uW and depletion of green laser with various powers: (a) 40mW, (b) 50mW, (c) 83 mW, (d) 235 mW.
To quantitatively analyze the STED depletion measurement on the Coumarin 102
dye, Coumarin 102 was prepared in the water solution, whose concentration is 20 umol.
The function generator is applied to control the depletion beam, switching on and off the
segments (A) with the depletion beam off and the segments (B) with the depletion beam
on. The fluorescent intensity of Coumarin 102 is depleted to different levels
corresponding to different powers of the depletion beam. The depletion powers are 40
mW, 50 mW, 83 mW, 235 mW respectively.
From the figure 2.11 (a), there are almost no photo-bleaching under the relatively
low power of the excitation beam with 100 uW. Because the signal intensities in the A
segment are almost same without the STED laser. We tested the Coumarin 102 when it
was in the liquid state. As a result, there probably had a diffusion of Coumarin molecules,
passing through the focus spot during the the period of STED laser off. This is due to the
new batch of molecules in replacement of partly bleached ones.
From the figure 2.11, we can know that there has a strong reduction in the
fluorescence signal when the power of STED laser has a incerease. To more spectific,
With increasing power of the cw STED laser beam, the depletion efficiency of Coumarin
102 gradually enhances. Finally, the depletion rate could achieve more than 60% with
STED laser power around 235 mW.
In the STED system, the spatial resolution Δr achievable in STED can be defined
as Δr ≈ λ/[2NA(1+P/Psat)1/2], where λ is the wavelength of laser, NA represents the
numerical aperture of objectives, P denotesthe Power of depletion laser, Psat isthe
effective saturation power for the quenching of the fluorophores used. Based on the
equation of resolution Δr, minimizing the wavelength and increasing the ratio of P/Psat
can greatly improve the resolution. Therefore, as shown in the figure 2.11, the Psat of the
STED is about 77.5 mW, which can be defined as the power at which the probability of
reach a high value. The experimental results indicate that the STED system we align can
work sucessfully and has the potential to achieve a high resolution. The similar
experiments have been done by using Atto 390 (SigmaAldrich Corp.) dye,which
likewise displays that it has almost the same phenomenon with Coumarin 102 dye.
CHAPTER
3
CHOOSING
SUITABLE
NANOPARTICLE
FOR
STED
SYSTEM
Success in super-resolution imaging depends on the appropriate selection of
fluorophores. A broad range of available fluorophores have been developed so far, but
not all of them are applicable to STED microscopy. For example, not all dyes can be
depleted with a second laser beam. Additionally, fluorophores should have high
photo-stability. Therefore, it is highly desired that novel fluorophores can be developed which
meet critical requirements for STED applications. The spatial resolution of STED
systems can be theoretically described with the following equation:
Δr ≈ λ/[2nsin𝜃 (1+P/Psat)1/2] (2)
where λ, n, and 𝜃are beam wavelength, refractive index, and half aperture angle
of the objective, respectively. P represents the power of the STED beam, and Psat is the
saturated power of the depletion beam when fluorescent intensity is half of the maximum.
Also, n sin 𝜃= NA, which denotes the numerical aperture of the objective lens. Based on
equation (1), minimizing the wavelength and increasing the ratio of P/Psat are effective
ways to improve the resolution. Therefore, discovering new fluorophores with shorter
wavelength can enhance the STED resolution. Up to now, much research has been
devoted to optimizingthe brightness, stability, wavelength and solubility of fluorophores,
which can greatly improve the performance of STED microscopy. According to previous
resolution, covering wavelengths from 440 nm to 637 nm, including ATTO 633, ATTO
647N, ATTO 590, ATTO 594, ATTO 435 and ATTO 932, etc. For this part of
experiment, we focus on the nanoparticles imaging, which will build a foundation for the
cell STED imaging.
In the following, we will show how to choose a suitable fluorescent nanoparticle
from 3 different kinds of nanoparticle for the STED system imaging based on the data
analysis and comparison.
3.1 SPECIMEN PREPARATION OF NANOPARTICLES
In this part, we will choose one kind of nanoparticles which are the most suitable
for STED system among three different types of nanoparticles. The three types of
nanoparticles are all solutions with high concentration. As a result, the concentration of
initial nanoparticle solution is too high for STED system imaging, because if the solution
concentration is too high, the fluorescent intensity is very easy to be saturated, and it is
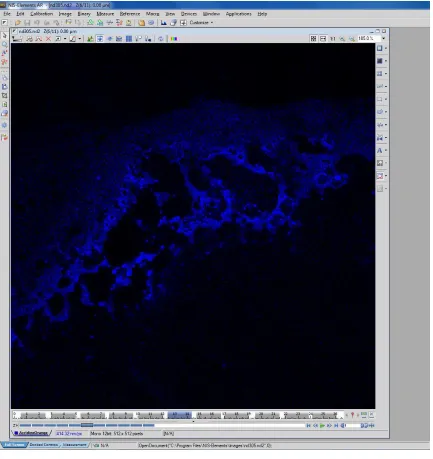
very hard to observe the clear pattern of nanoparticles. As shown in the Figure 3.1 (a), we
can just see that the whole area full with the blue fluorescent light for light yellow
nanoparticle under the lowest excitation power. It is difficult to observe the pattern of
signal nanoparticle. Hence, we need to dilute the initial nanoparticle solution into 5 times.
The whole process is shown in the Figure 3.1 (b). For solid sample, we used the pipette to
extract the initial nanoparticle solution (20 μL) and put it into the test tube with DI water
(80 μL). After that, we used the pipette to extract the diluted solution (5 μL) after the
diluted solution vibrating 5 mins in the ultrasonic cleaner, and placed the diluted solution
the diluted solution would spread on the glass slide. Finally, we put the glass slide with
sample diluted 5 times in the dark place for avoiding the photo-bleaching. When the glass
slide totally became dry, which showed that the solid sample diluted 5 times is done.
For the liquid sample, after the diluted solution vibrating 5 mins in the ultrasonic
cleaner, use the pipette extract 5 μL and put them into the reservoir. And then use cover
slide to cover the reservoir for reducing the evaporation of solution diluted 5 times.
3.2 OPTICAL PROPERTIES OF FLUORO-MAX BLUE AQUEOUS FLUORESCENT
PARTICLES
The first kind of nanoparticle we tried is Fluoro-Max Blue Aqueous Fluorescent
Particles (FPs). The size of FPs is 50 nm, which are produced by thermal fisher scientific.
The absorption and emission spectrum of the FPs are shown in the Figure 3.1. The
absorption intensity of the FPs is very high at the UV wavelength (405 nm). In the
emission spectrum of the FPs in Figure 3.1, there has two peaks with 412 nm excitation
laser, where the emission reaches its maximum intensity at around the wavelength of 447
nm and 473 nm, respectively. We can clearly observe that the maximal absorption
wavelength is at 412 nm and the maximal emission wavelengths are at 447 nm and
473nm, respectively. More importantly, the excitation laser is 405 nm, with 532 nm
wavelength depletion laser.
To test photo-stability, we measured the fluorescence intensity of the FPs using an
excitation laser power of 100 µW, and the result is illustrated in Fig. 3.3. Remarkably, the
intensity of the fluorescent signal is capable of maintaining itself for a long time (25
seconds) with a stable and steady intensity of approximately 0.16 V when the excitation
laser is on, demonstrating an outstanding photo-stability. The fluctuation around 0.16 V is
due to the shot noise of the detector. When the excitation laser is turned off, the
fluorescence intensity becomes approximately background noise level, i.e. about only
0.01 V low for wavelength around near 532 nm. The FPs still could be a potential