Plasma Turbulence Studies Using
Correlation Doppler Reflectometry on the
ASDEX Upgrade Tokamak
Der Fakult¨at f¨ur Physik
der Ludwig-Maximilians-Universit¨at M¨unchen
zur Erlangung des akademischen Grades eines
Doktors der Naturwissenschaften (Dr. rer. nat.)
vorgelegte Dissertation
von
Jasmine Schirmer
aus Montreal
iii
Zusammenfassung
Eines der wichtigsten Ziele der Fusionsforschung mit magnetisch eingeschlossenen Plas-men ist das Verst¨andnis und die Kontrolle der Turbulenz im Plasma. Die Turbulenz verur-sacht einen zus¨atzlichen radialen Teilchen- und W¨armetransport vom Plasmazentrum zu den umgebenden Strukturen, wodurch die Einschlussg¨ute vermindert wird. Diagnostiken zur Un-tersuchung der Plasmaturbulenz sind allerdings rar und beschr¨ankt in ihren M¨oglichkeiten. Im Rahmen dieser Arbeit wurde eine neue Diagnostikmethode zur Messung von Plasmarotation-sprofilen und Turbulenzeigenschaften, die Dopplerreflektometrie, weiterentwickelt. ¨Ahnlich einem Mikrowellenradar werden hierbei die von denjenigen radialen Positionen im Plasma reflektierten Mikrowellen detektiert, an denen der Brechungsindex Null wird. Diese Di-agnostikmethode wurde zur Messung der Turbulenzkorrelation erweitert, indem ein zweiter Dopplerreflektometerkanal hinzugef¨ugt wurde, sodass nun zwei Mikrowellenstrahlen mit le-icht unterschiedlichen Frequenzen ins Plasma eingekoppelt und detektiert werden k¨onnen. So ein radiales Korrelations-Dopplerreflektometersystem kann simultan die Messwerte des ra-dialen elektrischen Feldes Er und seiner Verscherung ∂Er ∂r (beides Parameter f¨ur die ein
fundamentaler Zusammenhang zur Turbulenzunterdr¨uckung vermutet wird), zusammen mit Messungen der Eigenschaften der Plasmaturbulenz, wie z.B. der radialen Korrelationsl¨ange der TurbulenzLr, liefern. Messungen dieser Gr¨ossen wurden im Rahmen dieser Arbeit f¨ur
einen weiten Bereich von Plasmaparametern untersucht. Es hat sich herausgestellt, dassEr
und die zugeh¨orige Verscherung tats¨achlich mit dem Einschluss des Plasmas in Verbindung stehen: ihr Absolutwert am Plasmarand steigt mit der Einschlussg¨ute. Ebenso wurde ein Anstieg in der Verscherung von Er an derselben radialen Position gefunden, an der die
ra-diale Korrelationsl¨ange der Turbulenz abf¨allt. Diese Beobachtung ist im Einklang mit the-oretischen Modellen, die eine Unterdr¨uckung der turbulenten Fluktuationen im Plasma bei ansteigendem Absolutwert der Verscherung vorhersagen, was zu einer Reduktion vonLrf¨uhrt.
Messungen vonLr in Abh¨angigkeit der senkrechten Komponente des Wellenzahlvektorsk ,
Abstract
One of the major goals of the tokamak fusion program is the understanding and control of plasma turbulence. Turbulence causes additional radial transport of heat and particles to the tokamak vessel walls, thereby degrading the overall confinement of the plasma. Diagnos-tics for the study of tokamak turbulence are unfortunately scarce and limited in what they can measure. A new diagnostic technique, Doppler reflectometry, has been developed for measurements of plasma rotation profiles and turbulence properties. It is a type of microwave radar technique which uses the back-scatter of microwaves from a radial position in the plasma where the refractive index equals zero. In this thesis work, the technique is extended for tur-bulence correlation measurements by adding a second Doppler reflectometer channel where two microwave beams are launched into the plasma with a small frequency difference. A ra-dial correlation Doppler reflectometer system can provide simultaneous measurements of the plasma radial electric fieldEr and its shear∂Er ∂r(both parameters are believed to be
funda-mental for suppressing turbulence) together with measurements of the properties of the plasma turbulence, such as the radial correlation length of the turbulenceLr. These measurements are
explored in this thesis work for a wide range of plasma conditions. It was found that Er and
its associated shear are indeed linked to plasma confinement. Their absolute values increase with confinement at the plasma edge. An increase in the absolute value ofEr shear was also
detected at the same plasma edge region where a decrease in radial correlation lengths of the turbulence was measured. This observation is in agreement with theoretical models which predict that an increase in the absolute shear suppresses turbulent fluctuations in the plasma, leading to a reduction inLr. Measurements ofLr versus the perpendicular wavenumber of the
turbulencek were also obtained, which prompted an investigation of the correlation Doppler
reflectometer response function using a 2-dimensional finite difference time domain (FDTD) code. The simulation results show that the magnitude of the measuredLr is dependent on the
v
Parts of this dissertation were published in:
J.Schirmer, G.D.Conway, W.Suttrop, H.Zohm and the ASDEX Upgrade Team, (2004)Radial Electric Field Shear and Correlation Length Measurements in ASDEX Upgrade using Corre-lation Doppler Reflectometry, in: Europhysics Conference Abstracts (CD-ROM, Proc. of the 31st EPS Conference on Plasma Physics, London, 2004), P-4.127.
J.Schirmer, G.D.Conway, W.Suttrop, S.Klenge, H.Zohm and the ASDEX Upgrade Team, (2004)Plasma Turbulence Studies Using Correlation Doppler Reflectometry On The ASDEX Upgrade Tokamak, in: Conference Digest of the 2004 Joint 29th International Conference on Infrared and Millimeter Waves and 12th International Conference on Terahertz Electronics, Karlsruhe, 2004, P-2.56.
J.Schirmer, G.D.Conway, H.Zohm, W.Suttrop, E.Holzhauer and the ASDEX Upgrade Team, (2005) Radial Correlation Doppler Reflectometry on ASDEX Upgrade, in: IPP-Report 2/9 (Proc. of the 7th International Reflectometry Workshop for Fusion Plasma Diagnostics, Garch-ing, 2005).
G.D.Conway, J.Schirmer, W.Suttrop, S.Klenge, E.Holzhauer, D.Wagner, H.Zohm and the AS-DEX Upgrade Team, (2003)Latest results and future plans for Doppler reflectometry on AS-DEX Upgrade, in: Proc. 6th International Reflectometry Workshop for Fusion Plasma Diag-nostics, San Diego, 2003.
G.D.Conway, J.Schirmer, S.Klenge, W.Suttrop, E.Holzhauer and the ASDEX Upgrade Team, (2004)Plasma rotation profile measurements using Doppler reflectometry, Plasma Physics and Controlled Fusion 46, 951-970.
D.P.Coster, A.Chankin, G.D.Conway, L.Horton, L.Kaveeva, C.Konz, J.Neuhauser, M.Reich, T.Ribeiro, V.Rozhansky, J.Schirmer, B.D.Scott, M.Tsalas, S.Voskoboynikov and the ASDEX Upgrade Team,Edge simulations of an ASDEX Upgrade Ohmic shot, in: Europhysics Confer-ence Abstracts (CD-ROM, Proc. of the 32nd EPS ConferConfer-ence on Plasma Physics, Terragona, 2005), P-1.008.
L.D.Horton, G.D.Conway, A.W.Degeling, T.Eich, A. Kallenbach, P.T.Lang, J.B.Lister, A.Loarte, Y.R.Martin, P.J.McCarthy, H.Meister, J.Neuhauser, J.Schirmer, A.C.C.Sips, W.Suttrop and the ASDEX Upgrade Team, (2004)ITER-relevant H-mode physics at ASDEX Upgrade, Plasma Physics and Controlled Fusion 46, B511-B525.
H.Meyer, P.G.Carolan, G.D.Conway, G.Cunningham, L.D.Horton, A.Kirk, R.Maingi, F.Ryter, S.Saarelma, J.Schirmer, W.Suttrop, H.R. Wilson and the MAST, ASDEX Upgrade and NSTX teams, (2005) H-mode physics of near double null plasmas in MAST and its applications to other tokamaks, submitted to Nuclear Fusion.
vii
Acknowledgement
In the three years of this research work, I benefited from the knowledge, encouragement and support of several people. At this stage, I would like to express my gratitude.
It is a pleasure to thank my academic supervisor Professor Hartmut Zohm. He has given me the opportunity to take on this project and has bestowed on me support and trust. Our monthly meetings have given me the motivation I needed to complete this work.
I thank Dr. Garrard Conway for his supervision and for introducing me to the fascinating world of microwave technology. He has invested a tremendous amount of time in satisfying my curiosity. I am especially grateful to him for the last few months, in which he gave up his weekends for the correction of this thesis work.
I would also like to thank Dr. Wolfgang Suttrop who acted as my mentor. His support both academically and morally is greatly appreciated. Both his widespread knowledge in physics and his ability to explain difficult concepts in the simplest way continue to inspire me.
I am highly indebted to Dr. Eberhard Holzhauer, who has written the 2D FDTD code used in this thesis work. Although he is based in Stuttgart and has recently entered retirement, our constant telephone communication right until the end of this thesis kept the work on track and ensured progress in this field. The simulation results are a credit to him.
The Doppler reflectometry group at ASDEX Upgrade is fortunate to have Mr. Ewald Schmid as a technician. I have learned alot from him about electronics and even had the opportunity to improve my Bayrisch at the same time.
I am thankful to Dr. Christoph Fuchs for providing a fitting program for density profiles, to Dr. Emanuele Poli who offered support in the use of the TORBEAM code and to Dr. Hans Meister who always had an answer to any IDL programming problem. I also appreciate Dr. Bruce Scott and Dr. Frank Jenko for taking on the difficult challenge of explaining tokamak turbulence theory to an experimentalist.
Contents
1 Introduction 1
1.1 Fusion Energy . . . 1
1.2 Magnetic Confinement . . . 3
1.3 Plasma Turbulence . . . 4
1.4 Scope of this Work . . . 5
2 Tokamak Operation 7 2.1 The ASDEX Upgrade Tokamak . . . 7
2.2 Plasma Heating Systems . . . 10
2.3 Plasma Configuration . . . 11
2.3.1 Plasma Shape . . . 11
2.3.2 Magnetic Field Line Helicity and Co-/Counter- NBI Injection . . . . 13
2.4 Plasma Scenarios . . . 15
2.4.1 Low Confinement versus High Confinement Discharges . . . 15
2.4.1.1 Edge Localized Modes (ELMs) . . . 17
2.4.2 Improved H-mode . . . 18
2.4.3 Quiescent H-mode . . . 18
3 Plasma Turbulence 21 3.1 Anomalous Transport . . . 21
3.2 Properties of Plasma Turbulence . . . 22
3.3 Turbulence Measurements in Tokamaks . . . 24
3.4 Turbulence Suppression . . . 25
3.4.1 The Radial Electric Field . . . 25
3.4.2 The Radial Electric Field Shear . . . 26
3.4.2.1 BDT Model . . . 28
4 Doppler Reflectometer Diagnostic 31 4.1 Theory of Doppler Reflectometry . . . 31
4.1.1 Fundamental Wave Theory . . . 31
4.1.2 Microwave Propagation in a Plasma . . . 32
4.1.2.1 The Ordinary Mode . . . 34
4.1.2.2 The Extraordinary Mode . . . 34
4.1.3 Principle of Doppler Reflectometry . . . 35
4.1.4 Reflectometer Signals : Homodyne versus Heterodyne Detection . . . 37
4.2 Doppler Reflectometer Diagnostic in ASDEX Upgrade . . . 39
4.2.1 Hardware Components . . . 39
4.2.2 Data Control and Acquisition . . . 41
4.3 Development of a new Correlation Doppler Reflectometer System . . . 42
5 Measurement Technique&Data Analysis 45 5.1 Reflection Cutoff Layers . . . 45
5.1.1 Electron Density Profiles . . . 46
5.1.2 Poloidal Cross Sections of the Radial Cutoff Layers . . . 48
5.1.3 Beam Tracing with TORBEAM . . . 50
5.2 Obtaining the Doppler Shifted Frequency, fD . . . 52
5.2.1 Measurement Difficulties in H-mode . . . 53
5.3 Single Channel Doppler Reflectometer . . . 54
5.3.1 Calculation of the Perpendicular Rotation of the Turbulence . . . 55
5.3.2 Calculation of the ExB velocity and the Radial Electric Field . . . 56
5.4 Dual Channel Doppler Reflectometer . . . 57
5.4.1 Calculation of the Radial Electric Field Shear . . . 57
5.4.2 Calculation of the Radial Correlation Lengths of the Turbulence . . . 58
5.5 Errors in the Doppler Measurement . . . 61
6 Perpendicular Rotation Measurements 63 6.1 The L-H Transition . . . 63
6.2 ExB Velocity Components . . . 65
6.2.1 The Toroidal Impurity Velocity . . . 65
6.2.2 The Ion Diamagnetic Velocity . . . 66
6.2.3 The Poloidal Velocity . . . 67
6.3 Dependence on Plasma Confinement . . . 67
6.4 Dependence on Plasma Configuration . . . 68
6.5 Dependence on Magnetic Field . . . 71
CONTENTS xi
7 The Radial Electric Field and its Associated Shear 75
7.1 Measurement of the Radial Electric Field . . . 75
7.1.1 Dependence on Plasma Confinement . . . 75
7.1.2 Dependence on Plasma Heating . . . 78
7.1.3 Dependence on Plasma Shape . . . 81
7.1.4 Comparison with ModeledEr Profiles . . . 84
7.2 Measurements of the Radial Electric Field Shear . . . 85
7.3 Summary . . . 88
8 Radial Correlation Length of the Turbulence 91 8.1 Experimental Measurements . . . 91
8.1.1 Radial Correlation Lengths in L-mode and H-mode . . . 91
8.1.2 Lr as a Function of Plasma Normalized Radius . . . 92
8.1.3 The Relationship BetweenLrandk . . . 93
8.2 2D Full Wave Simulation of Doppler Reflectometry . . . 95
8.2.1 The 2D Finite Difference Time Domain Full Wave Code . . . 95
8.2.2 The Input Parameters . . . 96
8.2.2.1 Experimental Electron Density and Magnetic Field . . . . 96
8.2.2.2 Antenna Characteristics . . . 97
8.2.2.3 Modeling Turbulent Density Fluctuations . . . 98
8.2.3 ObtainingLr from the 2D Full Wave Code . . . 99
8.2.4 Testing of the 2D Code . . . 100
8.2.4.1 Radial Electric Field Patterns and Density Fluctuation Levels 101 8.2.4.2 The I and Q Output Signals . . . 104
8.2.5 Results . . . 106
8.3 Summary . . . 111
Chapter 1
Introduction
The World Energy Council projects that by the year 2050 the world wide energy demand will be double its present level. With such expected high energy consumption, the need for new long-term sources of energy is evident. At present day, the main energy sources consist of exhaustible resources of coal, gas, and oil. These sources are known for creating air pollution and are thus, not considered environment friendly. Other energy sources include hydroelectric, solar and wind power, the exploitation of which is limited to specific locations. Even nuclear power in the form of fission, although capable of producing large amounts of inexpensive fuel, is not favorable due to the radioactive waste created. In light of this information, alternative forms of energy should be investigated to ensure a future energy supply which is both diverse and sustainable.
1.1 Fusion Energy
Fusion, as a possible new source of energy, was first considered in the late 1930s once it had been recognized as the power of the sun and other stars [1]. Since then, fusion research has been undertaken in laboratories all over the world aimed at reproducing fusion on Earth in a controlled manner. Fusion is a process where atomic nuclei of light elements are combined to form heavier elements, thereby releasing energy. The sun generates its energy by fusing hydrogen isotopes into stable helium in three steps:
p p D e νe (1.1)
D p
3
2He γ (1.2)
3
2He
3
2He
4
2He 2p (1.3)
Reaction 1.1 requires a weak interaction in order to transform protons to neutrons. This weak interaction makes these fusion processes very slow. Nevertheless, the sun (and all other stars) overcome the slow reaction rates due to their large mass. On Earth, however, this weak in-teraction and its associated small reaction probability must be avoided since a fusion reactor
is many orders of magnitude smaller than a star. Possible candidates for fusion reactions on Earth are: 2D 3T 4He
n 176 MeV (1.4)
2D
3He
4He
p 184 MeV (1.5)
3D
2D
2He
n 327 MeV (1.6)
2D
2D
3T
p 4032 MeV (1.7)
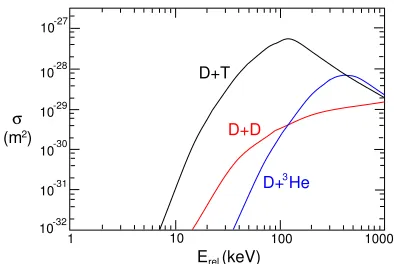
These reactions are induced by collisions between their reactant particles and therefore their cross sections are of fundamental importance. The cross sections for these reactions can be seen in figure 1.1.
At low energies, the cross section for fusion
σ
(m )2
E (keV)rel
1 10 100 1000
10-27 10-28 10-29 10-30 10-31 10-32 D+T D+D
D+ He3
Figure 1.1: Cross sections for different fusion reactions.
is small due to the Coulomb barrier prevent-ing the nuclei of the reactants to approach each other close enough to fuse [2]. This re-pulsive force is eventually overcome as the kinetic energy of the nuclei increases. Ac-tually, the deuterium-tritium reaction (reac-tion 1.4) can occur even before the Coulomb barrier is overcome because of quantum me-chanical tunneling. From figure 1.1, it can be seen that reaction 1.4 has the highest cross section at lowest energies and is there-fore the most promising reaction.
The reactants essential for reaction 1.4 are deuterium and tritium. Deuterium, a hydrogen isotope, can be extracted from our oceanic waters, about 30 grams per cubic meter of water. If burned in a fusion reactor, this amount of deuterium could produce as much energy as 300 cubic meters of gasoline, clearly demonstrating the huge amounts of energy which are to be gained using fusion. Tritium, on the other hand, is an unstable radioactive isotope of hydrogen and therefore does not occur naturally. Nevertheless, tritium can be produced in a nuclear reaction between the neutrons, released from the D-T reaction, and lithium, an element found in great supplies in the Earth’s crust.
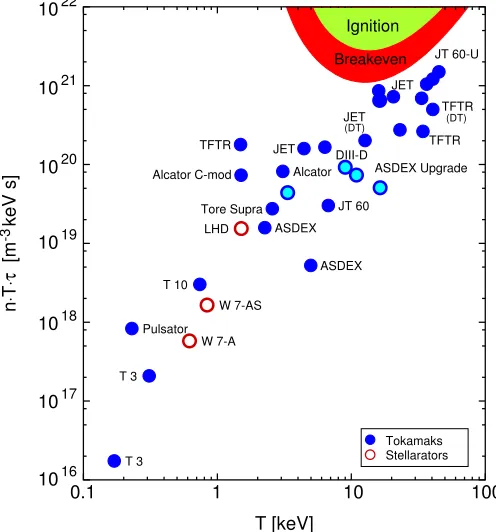
1.2. MAGNETIC CONFINEMENT 3 reached. The progress towards ignition can be expressed as a parameter, nTτE where n is
the density, T the temperature andτE the energy confinement time. The energy confinement
time gives an indication of the quality of the heat insulation. It increases with the volume of the plasma since a larger plasma is better confined in the core than a smaller plasma. Figure 1.2 shows the research progress of several international fusion devices towards ignition. It is expected that the next generation device ITER will come close to or reach ignition.
T [keV]
n
⋅
T
⋅τ
[m keV s]
-3
0.1 1 10
1017 1022 1021 1020 1019 1018 100 1016 T 3 T 3 T 10 Pulsator W 7-A W 7-AS ASDEX ASDEX ASDEX Upgrade Tore Supra JT 60
Alcator C-mod TFTR TFTR TFTR JET JET JT 60-U DIII-D JET (DT) (DT) Ignition Alcator Tokamaks Stellarators LHD Breakeven
Figure 1.2:nTτE values in different experiments.
1.2 Magnetic Confinement
adding helicity to the magnetic field lines (i.e. a poloidal magnetic field component), the field lines become twisted and the undesirable drifts are compensated for. Presently, there are two main toroidal devices taking advantage of helical magnetic field lines: the stellerator and the tokamak, as seen in figure 1.3.
a) b)
Transformer coil
Toroidal field coils
Magnetic surface
Field line Coil for plasma shaping
Plasma current
Figure 1.3:Schematic Drawing of a Stellerator (a) and a Tokamak (b).
In a stellerator, the poloidal magnetic field is generated by a complicated winding of external coils. The advantage of such a device is its potential to sustain a steady-state plasma. No strong plasma current is needed to maintain the poloidal magnetic field. Nevertheless, the tokamak is preferred at present due to its simple coil geometry (from the engineering point of view) and its toroidal symmetry. In a tokamak, the toroidal magnetic field is generated by the toroidal field coils whereas the poloidal magnetic field is created by the plasma toroidal electric current. This plasma current is induced by a central solenoid transformer where the plasma acts as the secondary winding of the transformer core. Since a transformer can induce current only for a finite time, alternative methods for driving current need to be researched to achieve steady-state tokamak operation. The additional vertical field coils illustrated in figure 1.3(b) are mainly for plasma shaping and stability. Further details about tokamaks and in particular, the ASDEX Upgrade Tokamak, operated at MPI Garching, on which this thesis is based, can be found in chapter 2.
1.3 Plasma Turbulence
1.4. SCOPE OF THIS WORK 5 variation leads to gradients in the plasma, resulting in fluxes which determine the structure of the plasma [3].
The rate of transport in a tokamak caused by Coulomb collisions is known as neoclassical transport. Tokamak experiments have shown that ion thermal transport is similar to the neo-classical prediction, although electron thermal transport is substantially higher [4, 5]. In ad-dition, plasmas with auxiliary heating exhibit even higher transport rates than those without external heating (i.e. Ohmic plasmas). Hence, the predictions of neoclassical transport do not support the experimental measured values of total fluxes. As a result, transport is of-ten anomalous. This anomalous transport has long been believed to be caused by micro-instabilities in the plasma [6]. The fluctuations in the electric and magnetic fields caused by micro-instabilities lead in turn to fluctuations in the velocities and positions of the plasma particles, and thus to transport.
The incoherent type of motion arising from plasma instabilities is denoted turbulence. Under-standing plasma turbulence and how to control it are the key issues dominating the realization of a reactor relevant tokamak. The gradients in the plasma are recognized as the driving forces for the multitude of turbulence existent in a plasma. Nevertheless, it was found that the mech-anism for turbulence stabilization is generic for many types of turbulent fluctuations [7]. It is now widely accepted that a shearedE Bflow deforms and tears the turbulent eddies in
the plasma, reducing their radial correlation extent and thus limiting the transport of energy and particles across the field lines [8]. The importance of the E B shear flow make
mea-surements of the radial electric field in a plasmaErand in particular its first derivative∂Er ∂r
highly desirable.
1.4 Scope of this Work
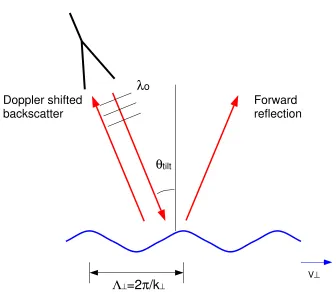
reflec-tometry. The main difference to standard reflectometry is that the microwave beam in the Doppler reflectometry technique is launched into the plasma at an oblique angle,θtilt.
Conse-quently, the diagnostic selects density perturbations with wavenumbers in the reflecting cut-off layer perpendicular to the magnetic field (k 2k sinθtilt) according to the Bragg condition.
To date, Doppler reflectometry has been used for the measurement of the propagation velocity of these perturbations,u [9, 10, 11]. The perpendicular rotation is obtained from the Doppler
shift of the returning microwave. Since the perpendicular rotation is a measure of the plasma
E Bvelocity, the plasma radial electric fieldEr may be extracted. This is one aspect of the
diagnostic, which is studied in this thesis. A survey in both perpendicular rotation and radial electric field measurements are presented for a variety of plasma conditions in the ASDEX Upgrade tokamak.
Furthermore, by using two microwave sources at slightly different frequencies, several prop-erties of the turbulence may be inferred. This technique developed as a part of this thesis project is called correlation Doppler reflectometry. For the first time, the technique is used for the measurements of radial electric field shear∂Er ∂rand radial correlation lengthsLr of the
turbulence. These parameters are of major interest to the fusion community sinceEr shear is
believed to be fundamental for turbulence suppression and Lr gives an indication of the type
of turbulence and its behaviour in the plasma. The relationship between Lr andk , obtained
experimentally by the correlation Doppler reflectometer, can give additional information on the turbulence. The measurements however revealed unexpected behaviour, which motivated the undertaking of numerical simulations of the Doppler reflectometer response using a 2-dimensional full-wave finite-difference time-domain (FDTD) code.
Chapter 2
Tokamak Operation
This chapter is an introduction to basic tokamak operation. The emphasis is placed on the AS-DEX Upgrade tokamak, upon which this thesis work is based. The various plasma scenarios, configurations and tokamak heating systems employed on ASDEX Upgrade will be described. These topics will be touched upon again in the discussion of the Doppler reflectometry mea-surements.
2.1 The ASDEX Upgrade Tokamak
The ASDEX Upgrade tokamak, named after its predecessor ASDEX (AxiSymmetricDivertor
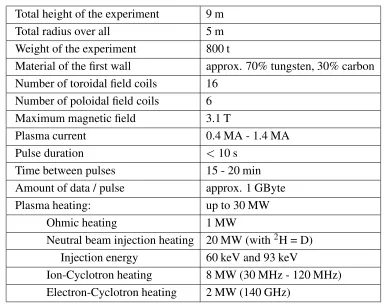
EXperiment), is a middle sized tokamak with a major radius of 1.65m and a minor radius of 0.5m. The technical data and main parameters of the device are listed in Tables 2.1 and 2.2. ASDEX was one of the first tokamaks to use a divertor concept. With the help of a divertor, the impact of wall contact on plasma operation is minimized, thereby keeping the plasma well confined and free of undesirable impurities. Consequently, this improvement in plasma confinement led to the discovery of the high confinement mode (H-mode) on ASDEX [12]. An H-mode plasma has roughly double the energy confinement time than the earlier low confinement mode (L-mode) plasmas. Both these plasma scenarios, along with several others, will be described further in section 2.4.
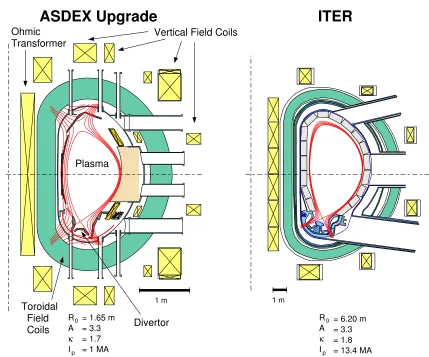
One of the main goals of ASDEX Upgrade is to provide data needed for next generation fusion devices, such as ITER. Figure 2.1 illustrates the poloidal cross sections of ASDEX Upgrade and ITER. A poloidal cross section offers a view of a vertical slice through one side of the donut-shaped tokamak. In the poloidal cross sections of figure 2.1, the principal components of these two tokamaks may be seen. An array of vertical magnetic field coils, controlling the plasma shape, and the primary winding of the transformer are illustrated as yellow boxes. The green outer layer represents the tokamak toroidal field coils. Not shown in the ASDEX Upgrade cross section, is the vacuum chamber which encloses the plasma and is needed to provide low base pressure and control the hydrogen pressure outside the plasma. In the core of the tokamaks, the plasmas are outlined in red. The similarity between the two cross sections indicates the ITER relevance of ASDEX Upgrade.
Technical data:
Total height of the experiment 9 m Total radius over all 5 m Weight of the experiment 800 t
Material of the first wall approx. 70% tungsten, 30% carbon Number of toroidal field coils 16
Number of poloidal field coils 6 Maximum magnetic field 3.1 T
Plasma current 0.4 MA - 1.4 MA
Pulse duration 10 s
Time between pulses 15 - 20 min Amount of data / pulse approx. 1 GByte Plasma heating: up to 30 MW
Ohmic heating 1 MW
Neutral beam injection heating 20 MW (with2H = D) Injection energy 60 keV and 93 keV
Ion-Cyclotron heating 8 MW (30 MHz - 120 MHz) Electron-Cyclotron heating 2 MW (140 GHz)
Table 2.1:Technical data of ASDEX Upgrade as of 2005
Typical plasma parameters:
Major plasma radiusR0 1.65 m
Minor horizontal plasma radiusa 0.5 m Minor vertical plasma radiusb 0.8 m Ellipticityb a 1.8 Triangularity (top/bottom) 0.4 / 0.4
Plasma types deuterium, hydrogen, helium Plasma volume 14 m3
Plasma mass 3 mg
Electron density 1 x 10²⁰m
3
Plasma temperature 60 to 250 million degree
2.1. THE ASDEX UPGRADE TOKAMAK 9
ASDEX Upgrade
ITER
1 m 1 m
= 1.65 m = 3.3 = 1.7 = 1 MA R
A
κ
I 0
p
= 6.20 m = 3.3 = 1.8 = 13.4 MA R
A
κ
I 0
p Vertical Field Coils
Ohmic Transformer
Divertor Plasma
Toroidal Field Coils
Figure 2.1: Comparison of the poloidal cross sections of ASDEX Upgrade and ITER.
Current research emphasis includes investigating the physics of advanced tokamak regimes and testing of alternative first wall materials, such as tungsten [13]. Advanced tokamak sce-narios include internal transport barriers and improved H-mode scesce-narios. These advanced scenarios are of key interest in fusion research since they may lead to enhanced plasma perfor-mance, long hybrid operation and even possibly steady state operation. The investigation of alternate wall materials is of particular importance since future tokamaks, such as ITER, might not use carbon as a first wall material. Carbon is subject to strong chemical erosion and can entrap tritium in deposited layers. Hence, ASDEX Upgrade has entered a multistep program toward a carbon-free machine by slowly replacing its carbon with tungsten.
heating systems on ASDEX Upgrade allow a greater variety of experiments to be performed. These heating systems are briefly described in the following section.
2.2 Plasma Heating Systems
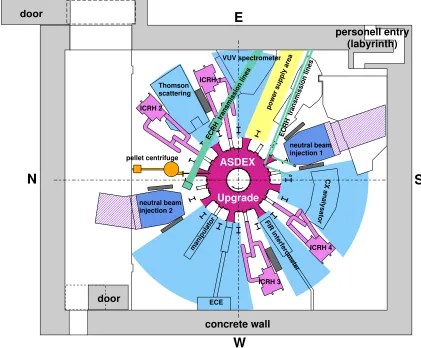
Current flowing in the plasma produces ohmic heat due to finite resistivity. However, this heat is not sufficient for heating the plasma to fusion relevant temperatures. Consequently, three auxiliary heating systems are employed on ASDEX Upgrade. They are neutral beam, ion cyclotron and electron cyclotron heating. These systems supply a maximum of 30MW heating power. Their positions around the tokamak with several other diagnostics are shown in figure 2.2.
neutral beam injection 2
Thomson scattering
ICRH 2
pellet centrifuge
ICRH 1
ICRH 3
ICRH 4 neutral beam injection 1
manipulator
ECE
FIR interferometer
CX analysator
power supply area
W
S
E
N
ECRH transmission lines VUV spectrometer
ECRH transmission lines
ASDEX
Upgrade
concrete wall
door
door
personell entry (labyrinth)
Figure 2.2: Schematic of the ASDEX Upgrade experimental hall, showing the positions of the heating systems and several plasma diagnostics.
2.3. PLASMA CONFIGURATION 11 and accelerated in an electric field. By propagating through a neutralizer chamber filled with neutral deuterium gas, the fast particles become neutralized by charge exchange reactions. They then undergo further charge exchange reactions upon entering the plasma, resulting in a population of fast ions. The plasma heating is then produced by collisions of the fast ions with the thermal particles. This heating method is responsible for the toroidal momentum input in a plasma, which drives the plasma toroidal rotation,vφ.
The other two heating systems, known as Electron Cyclotron Resonance Heating (ECRH) and Ion Cyclotron Resonance Heating (ICRH), are based on a wave heating method. They launch electromagnetic waves into the plasma with frequencies in the range of the electron (140GHz) and ion (30-120MHz) cyclotron frequencies respectively.
The ICRH heating system consists of four generators, each capable of launching 2MW of power into the tokamak vessel via four antennae in the vaccuum chamber [16]. The ICRH power is absorbed in the plasma by either ions or electrons. Where the frequency matches the local ion cyclotron resonance frequency, direct absorption by ions occurs. If however there is no strong ion absorption and the phase velocity of the wave is near the thermal velocity of the electrons, direct absorption by electrons takes place. This heating power is suitable for experiments studying fast particles as well as the effects on plasmas without momentum input (normally provided by NBI heating).
ECRH heating power, on the other hand, is ideal for studies related to electron heat transport via heat waves. This heating power is currently generated by four diode-type gyrotrons oper-ated at 140GHz frequency, corresponding to the second harmonic electron cyclotron resonance at 2.5T [13]. A maximum of 2MW per 2s pulse length is achievable with the system.
2.3 Plasma Configuration
The tokamak machine was designed such that plasma configuration could be altered. The shape and position of the plasma is controlled by a set of vertical field coils. By increasing or decreasing the strength of the various vertical magnetic fields produced by these coils, the plasma may be moved up or down, in or out, as well as create field nulls, i.e. X-points at the top and bottom of the plasma donut. In addition, the polarity of the toroidal magnetic field and the toroidal current (i.e. the poloidal magnetic field) may be reversed. This then changes the magnetic field line helicity of the plasma as well as the co or counter direction of the NBI with respect to the main plasma current, since the toroidal injection angles of the NBI sources are fixed on ASDEX Upgrade. A change in the plasma configuration can have dramatic effects on plasma performance and therefore these aspects need to be addressed in tokamak research.
2.3.1 Plasma Shape
the X-point, the poloidal field is zero. A safety factor q describes the geometry of the field lines in a tokamak and is defined by
q
m n
number o f toroidal circulations
number o f poloidal circulations (2.1)
For example, a q 2 1 magnetic surface has closed field lines after two toroidal and one
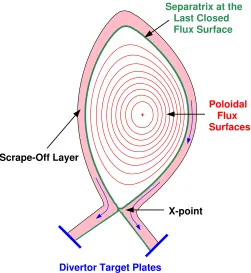
poloidal windings. At the separatrix, the safety factorqgoes to infinity. Outside the separatrix is a region defined as the Scrape Off Layer (SOL). Particles and energy from the main plasma migrate across the field lines to the SOL where they flow down to the divertor and become neutralized at the target plates. Hence, strong heat flow and particle fluxes are expected at the plates since the magnetic field lines intersect the plasma vessel at these points. In order to study plasma performance in the various plasma shapes, a tokamak needs to be specially designed to withstand the excessive erosion which can occur at these points. ASDEX Upgrade has divertor plates at the top and bottom of the vacuum vessel and hence most plasma shapes may be tested, thus enabling a wide variety of plasma experiments to be undertaken and the associated physics to be studied. It will later become evident that the three regions of a plasma (i.e. plasma core, edge and SOL) are usually treated separately. This is because the physics in each of these regions are unique and the behavior in all three is very different.
Divertor Target Plates
Separatrix at the Last Closed Flux Surface
Scrape-Off Layer
X-point
Poloidal Flux Surfaces
Figure 2.3:A plasma poloidal cross section illustrating the poloidal flux surfaces and the flow of particles in the SOL to the divertor plates. The separatrix is defined as the boundary of the last closed flux surface and the SOL is the region outside the separatrix.
2.3. PLASMA CONFIGURATION 13 are elongation (κ) and upper (δupper) and lower (δlower) triangularity. For example, a typical
LSN discharge would have a small δupper and a large δlower. By moving the plasma in the
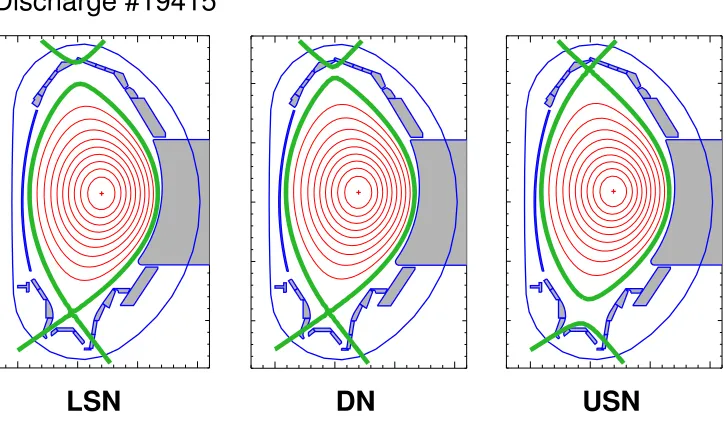
zdirection (i.e. up or down), the vertical field coil strengths in the plasma are changed and two other plasma shapes, namely the Double Null (DN) and Upper Single Null (USN) shapes, may be created. All three shapes are shown in figure 2.4 with several poloidal flux surfaces in proportion to the tokamak vessel. The DN configuration forms two X-points, one at the top and one at the bottom. Table 2.3 lists the three plasma shapes (shown in figure 2.4) in discharge # 19415 and the triangularities typical of these shapes.
LSN DN USN
Discharge #19415
Figure 2.4:The various plasma shapes achievable on ASDEX Upgrade.
Plasma Shape Time (s) δupper δlower
LSN 3.0 0.205 0.334 DN 4.4 0.220 0.333 USN 5.8 0.269 0.265
Table 2.3: The various plasma shapes in discharge # 19415 with their upper and lower trian-gularities. The most common plasma shape used on ASDEX Upgrade is LSN.
2.3.2 Magnetic Field Line Helicity and Co-/Counter- NBI Injection
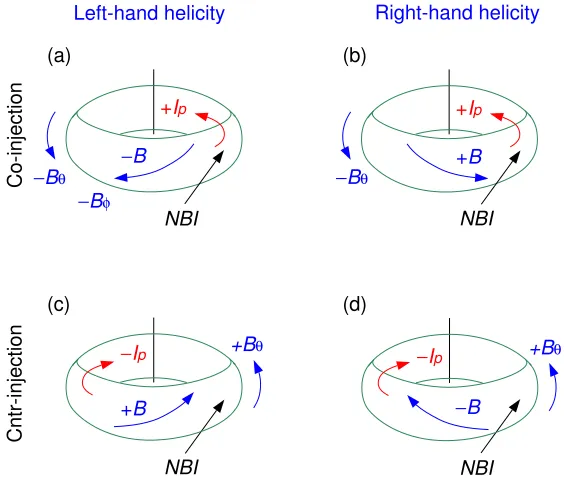
On ASDEX Upgrade, the standard discharge configuration has a negative toroidal magnetic field ( Bφ) and a positive plasma current ( Ip). Here positive is defined as toroidally
counter-clockwise and negative counter-clockwise when viewed from above. The Ipcreates a poloidal
the Bφ to create a left-handed helicity of the totalB field. However, both the direction of
Bφ as well as Ip may reverse directions such that four configurations are possible. The four
possibilities are sketched in figure 2.5. Of the four possible configurations, the Bφ, Ip is
preferred on ASDEX Upgrade for LSN discharges for several reasons.
Co-injection
Left-hand helicity
+Ip
−Bφ
NBI
−Bθ −B
+B
Cntr-injection
−Ip
NBI (a)
(c)
+B
Right-hand helicity
+Ip
NBI
−B
−Ip
NBI (b)
(d)
−Bθ
+Bθ +Bθ
Figure 2.5:The four possible combinations of plasma toroidal field and poloidal current.
First, the two NBI injector boxes are fixed with a predominant counter clockwise toroidal injection angle. For Ip, the toroidally induced rotation from the NBI beams is with the
current (called co-injection). For Ip, the beams are counter-injecting. When the NBI is
counter-current injected, high first orbit losses are observed. In this case, the ion gyro-orbits are shifted inwards in the plasma (due to the gradient in the magnetic fieldBwhich is stronger in the plasma core than at the edge), resulting in the ion B ∇B drift pointing upwards. On
the other hand, in an NBI co-injected plasma, the ion gyro-orbits are shifted outwards from the plasma, leading to the ion B ∇B drift pointing downwards. Physical sputtering, high
localized thermal loads and less efficient plasma heating are all consequences of the first orbit losses detected in counter-current NBI injected discharges.
The other determining factor is the sign of the toroidal magnetic field since it determines the magnetic field line helicity. The lower divertor on ASDEX Upgrade is specially designed for discharges with a left-handed magnetic field line helicity. In this case, the magnetic field lines strike the tilted divertor tiles with a small incident angle, thereby avoiding strong local heat loading. In contrast, for discharges with right handed field line helicity, such as in Bφ
Ip
(figure 2.5d) and Bφ
Ip (figure 2.5b) configurations, the magnetic field lines strike the
2.4. PLASMA SCENARIOS 15 Nevertheless, ASDEX Upgrade is still able to perform both right-handed helical configurations with the use of USN shaped plasmas. This is because the upper divertor target tiles are non-tilted so that the magnetic field line inclination angle on the targets is independent of the applied magnetic field line helicity. This makes the upper divertor particularly useful since all four plasma configurations may be performed in an USN discharge. However, it should be noted that less auxiliary heating may be applied to the upper divertor due to its more sensitive tungsten coating [17] and reduced power handling capabilities.
2.4 Plasma Scenarios
Small-scale turbulence in a confined plasma causes radial transport of particles and energy. In several plasma scenarios, a suppression in turbulence amplitude is detected in a certain plasma volume correlated with a reduction in particle and heat diffusivity. The restricted location in a plasma in which this occurs is called a transport barrier. There exist both edge and internal transport barriers and much research has been devoted to the study of such barriers. Since the results presented in this thesis are concentrated on the plasma edge, this section will describe several plasma scenarios where edge transport barriers have been observed.
2.4.1 Low Confinement versus High Confinement Discharges
The Low to High confinement mode (L-H) transition is one of the most famous bifurcation phenomena in confined plasmas. Under the constant supply of energy, the density and tem-perature profiles change dramatically at the transition. Figure 2.6 shows the time evolution of typical plasma parameters during an L-H transition. The discharge begins with pure ohmic heating from the induced Ip. At 1.9s, additional heating in the form of 2.1MW of NBI is
applied. The plasma electron density and temperature rise but the overall confinement of the plasma is poor. This is called the low-confinement mode (L-mode). However, if the additional heating is above some threshold, the confinement spontaneously improves by a factor of two or so. This phase is called the high-confinement mode (H-mode).
In figure 2.6, the top time trace shows the heating power while the second trace shows the
Dα line radiation intensity in the divertor measured by a spectrometer. The L-H transition is identified at the point when theDα line emission drops and is then followed by spikes. These spikes indicate the edge localized modes (ELMs) which are a characteristic of H-modes. ELMs are repetitive edge MHD instabilities and will be decribed in the next section. The third time trace shows how the core electron density (measured by the DCN interferometer) and core electron temperature (from the ECE diagnostic) rise at the L-H transition. The last time trace shows the plasma stored energy and theH98scaling factor; both being indications of the plasma
confinement. The H-factor is given by
H
τE
τEscaling
whereτEis the measured energy confinement time andτEscalingis an energy confinement from
a scaling law. In this thesis, theH98 factor is used for comparing confinement in the various
discharges. It is calculated using the ITER scaling law [18]. The time trace shows the H98
factor increasing from roughly 0.6 in L-mode to 1.0 in H-mode. Similarly, the plasma stored energy also increases at the L-H transition, indicating the improvement in confinement.
2.3 0 1 2 3 0.0 0.2 0.4
1.6 1.7 1.8 1.9 2.0 2.1 2.2 Time (s) 0 2 4 6 NBI Radiated L-H Transition Dα ne Te Ohmic Power Stored Energy H98 0.0 0.2 0.4 0.6 0.8 1.01.2 1.4 arbitrary units MW keV ,
10 m
19
-3
MJ
,
arbitrary units
Figure 2.6:Time traces of common plasma parameters measured in discharge # 17439 during the transition from L to H-mode. The first shows the heating power, second the deuterium alpha trace, third the core electron density and temperature and lastly, the plasma stored energy and H98factor.
The changes occurring in the electron density and temperature are clear in the radial profiles in figure 2.7. HereTe andne are plotted versus normalized poloidal flux radius (ρpol), which
is defined by
ρpol
Ψ Ψa Ψs Ψa
2.4. PLASMA SCENARIOS 17 whereΨis the poloidal flux and the subscriptssandadenote the separatrix and the magnetic axis respectively. The normalized radius is a common choice for plotting many quantities, like pressure and density, since these quantities are constant on the poloidal flux surfaces. For such a definition, the separatrix at the last closed poloidal flux surface will always be atρpol 1.
0 0.1 0.2 0.3 0.4 0.5 0.6 0.7 0.8 0.9 1 1.1
0 1 2 3 4 5 6 7 8 H-mode L-mode
Electron Density (10 m )
19 -3 Normalized Radius Pedestal Transport Barrier
(a)Electron density profiles from core Thomson scattering, profile reflectometry, DCN and CO2 diagnostics.
Transport Barrier
Normalized Radius
Electron Temperature (keV)
H-mode
L-mode
0 0.1 0.2 0.3 0.4 0.5 0.6 0.7 0.8 0.9 1 1.1
0 0.5 1.0 1.5 2.0 2.5
(b)Electron temperature profiles from Thomson scattering diagnostic.
Figure 2.7: Electron density and temperature profiles measured in the L-mode (1.9s) and H-mode (2.2s) phases in discharge # 17439. The H-H-mode profiles form a so called ’pedestal’ at the plasma edge in H-mode.
At the L-H transition, the amplitude of the turbulence decreases abruptly at the plasma edge inside the LCFS and a spontaneous edge transport barrier is created. Its effect may be seen in Figure 2.7. In H-mode, a significant steepening of the density gradient at the plasma boundary is observed. At aroundρpol 0
9, the H-mode density profile rolls over, forming a knee-point
in the profile known as the ’pedestal’. A similar effect is seen in the electron temperature profiles. The temperature just inside the transport barrier is significantly higher in H-mode. Inside the transport barrier, the density gradient lengthn ∇nand temperature gradient length
T ∇T remain the same as in L-mode (called profile stiffness). Thus, the result of the H-mode pedestal is to raise the coreneandTeand hence the fusion performance.
2.4.1.1 Edge Localized Modes (ELMs)
due to the heat loss. This can be detected in the divertor as a temporal spike in theDα line ra-diation intensity. The sudden particle and heat loss result in a temporary flattening in the steep edge density and temperature profiles [19], reducing the ∇P below the critical MHD thresh-old. After an ELM collapse, the radial heat and particle transport from within the plasma core restores the plasma pressure on a time scale of a few ms until the next ELM event occurs. This cycle may repeat itself numerous times in one plasma discharge. The positive aspect of ELMs is that undesirable impurities are ejected and stationary H-mode plasmas are achieved. The disadvantage, however, is the fast energy loss which could cause considerable damage to the divertor material. Consequently, ELMs with small losses associated with high frequency are preferred over low frequency large ELMs.
Further information on the characteristics of ELMs on ASDEX Upgrade can be found in ref-erence [20].
2.4.2 Improved H-mode
In addition to the normal H-mode, there are other modes of enhanced confinement. The im-proved H-mode, first observed in the late nineties [21, 22], is a candidate for an advanced tokamakscenario. Advanced scenarios have by definition very good confinement and MHD stability properties [23]. The confinement is measured by the H-factor, where H98 factors
greater than 1 mean an improvement with respect to standard H-modes. A measure of how efficiently the magnetic field is being used is given by normalized beta,βN. It is defined by
βN β
aB
Ip (2.4)
where β is the volume average of the plasma over magnetic pressure (2µ p B
2) anda the
plasma minor radius. In order for a scenario to be denoted advanced, the product βNH must
be higher than that of a standard H-mode. For comparison, improved H-modes on ASDEX Upgrade have factors of βNH98 greater than 3.5 while standard H-modes have factors around
2.5. There is a limit as to how high βN can be in a plasma discharge. The limitation arises
from sawteeth instabilities in the plasma which trigger neoclassical tearing modes NTM (called neoclassical since it cannot be explained by classical transport theory). NTMs are responsible for reducing βN and are therefore undesirable. The improved H-mode, being sawteeth free,
can as such achieve a higherβN limit in comparison to standard H-modes.
The improved H-mode achieves its high performance by a delicate control of the plasma cur-rent and electric field profiles in the discharge. Both edge transport barriers and internal trans-port barriers can appear in improved H-modes. This scenario is still in the exploratory stage.
2.4.3 Quiescent H-mode
2.4. PLASMA SCENARIOS 19 of consequence. Quiescent H-mode discharges have also recently been obtained on ASDEX Upgrade [25, 26]. Figure 2.8 shows the time evolution of the plasma heating andDα radiation intensity of one such discharge. Note that the QH-phase between 2.0s and 3.5s is ELM-free. One feature of the QH-mode is the occurance of a large amplitude MHD mode located around the pedestal region, called an Edge Harmonic Oscillation (EHO). The EHO appears to replace the controlling effect of the ELMs on the edge density. In comparison with standard H-modes, higher confinement is observed in QH-modes by an increase in the H-factor. The higher con-finement is detected on ASDEX Upgrade by the Doppler reflectometer. These measurements are presented in chapters 6 and 7.
Time (s)
NBI
ICRH Radiated
Dα
8
6 4
2 0 1.0 0.8 0.6 0.4 0.2 0.0
0 1 2 3 4 5 6
Power
QH-mode
MW
arbitrary units
Figure 2.8:Time traces of the heating power and Dαradiation measured in quiescent H-mode
Chapter 3
Plasma Turbulence
Doppler reflectometry is a diagnostic which provides experimental measurements of the tur-bulent properties of the plasma, such as the radial correlation lengths of the turbulenceLr, as
well as parameters which are linked to the suppression of turbulence, like the radial electric fieldEr and its associated sheardEr dr. This chapter reviews the present theoretical models
and experimental results of plasma turbulence and the mechanisms for its suppression.
3.1 Anomalous Transport
Plasmas were initially thought to be quiescent so that transport would occur according to classical diffusion, where particles are lost only by Coulomb collisions with other particles. However, measured particle and energy transport in tokamaks are generally enhanced beyond the level determined by collisions. Observations show that in reality plasmas are not quiescent but rather have fluctuations in all their parameters, such as in the density ˜n, temperature ˜T, po-tential ˜Φand the magnetic field ˜B. These fluctuations, which give rise to an incoherent type of motion called turbulence, are believed to be the chief cause ofanomalous transport. Anoma-lous transport, although not fully understood, is known to strongly affect the performance of fusion devices and is among the most important outstanding problems in plasma physics. There are two types of fluctuations which may cause transport: electrostatic and magnetic fluctuations. In the case of electrostatic perturbations, the cross-field velocity is governed by theE Bdrift velocity, where the electric fieldE ∇Φ. In the second case, when magnetic
field perturbations exist, magnetic islands are formed in a plasma so that radial diffusion along a field line around the island now occurs at a much higher rate than across the field lines. The larger the islands are, the greater the resulting diffusion. Both types of turbulence have been observed on tokamaks but it is not entirely clear which of the two is responsible for transport. Section 3.2 presents the various types of turbulence present in tokamak machines. The follow-ing section 3.3 describes the experimental efforts in searchfollow-ing for firm proof of the connection between turbulence andanomalous transport. Considerable progress has also been made on the theoretical front, as high performance computing allows large scale numerical simulations of transport and strong turbulence to be performed. Some of the theoretical findings, especially
concerning the mechanism of turbulence suppression, will be presented in section 3.4. In both experiment and theory, an observed correlation between the amplitude of the turbulence and the confinement properties of the plasma offer confirmation of their relationship.
3.2 Properties of Plasma Turbulence
A variety of turbulence exists in a plasma due to the inhomogeneities in a plasma. Turbulence is driven by these inhomogeneities in the form of gradients. The most dominant gradients in a plasma are found in the density (∇n), temperature (∇T), pressure (∇P) and current density (∇J). Figure 3.1 illustrates the various instabilities present in the various regions of a plasma. It is evident that instabilities and their driving forces are unique in each of these plasma regimes: SOL, edge and core.
Edge: 0.85 <ρpol< 1 Dominated by ∇ P Electromagnetic Drift-wave turbulence Scrape-Off-Layer: ρpol> 1 Dominated by ∇n
Interchange/flute-type turbulence
Core: ρpol< 0.85
∇T>∇n
Mostly Electrostatic ITG, TEM, ETG turbulence
∼
∼
Figure 3.1:A poloidal cross-section showing the various micro-instabilities present in a toka-mak plasma.
In the SOL exist mainly interchange, flute-type turbulence. Flute modes are low-frequency electrostatic oscillations stretched along the magnetic field (k
0) and become unstable due
3.2. PROPERTIES OF PLASMA TURBULENCE 23 plasma turbulence. In the plasma core, the turbulence is mainly electrostatic. The temperature gradient becomes more significant than the density gradient, leading to ITG (ion temperature gradient) and ETG (electron temperature gradient) modes of turbulence. Trapped particle modes also exist here and in particular, TEM (trapped electron mode) turbulence is believed to play a key role. An important point to note is that several types of turbulent modes can exist simultaneously in both time and place.
The various types of turbulence may be categorized by their unique properties. They have different scale lengths; for example ITG modes have scale lengths of the ion Larmor radius (i.e. long wavelength) whereas ETG modes scale with the Larmor radius of electrons (i.e. short wavelength). The poloidal wavenumbers kθ for several turbulent modes are shown in figure 3.2. The figure shows typical fluctuation spectra obtained from a collective scattering experiment [27]. ITG, drift-wave and TEM modes have relatively low poloidal wavenumbers, which are generally more accessible for diagnostics. ETG, however, occurs at a much higher poloidal wavenumber (kθ 10cm
1). Current efforts are being made to develop diagnostics
capable of measuring high-k, short-wavelength turbulence.
S(k)
(arb.)
100
10
1
0.1
kθ
(cm )
-110
10
110
0-1
10
2ITG / DW
TEM
ETG
Figure 3.2: The range of poloidal wavenumbers covered by ITG, drift-waves, TEM and ETG modes of turbulence.
The turbulence also has a spatial extent, and may be thought of as eddies or blobs which travel perpendicular to the magnetic field and are either stretched in the radial or poloidal direction. As a result, radial and poloidal correlation lengths may be used to define the spatial size of a turbulent eddy.
3.3 Turbulence Measurements in Tokamaks
The connection between micro-instabilities and transport has been a strong motivation for the development of diagnostics to measure fluctuations in tokamaks. Below is a list of typical fluctuation diagnostics and the parameters which they measure.
Diagnostic Type of Fluctuations Magnetic coils & probes magnetic
Langmuir probes density, electric field, potential
Soft X-ray detectors plasma emission: temperature, density, effective charge Microwave scattering electron density
Laser scattering electron density Reflectometry electron density Beam emission spectroscopy (BES) electron density
Heavy ion beam probe (HIBP) electron density, potential Electron cyclotron emission (ECE) electron temperature
Thomson scattering electron temperature
Table 3.1: The diagnostics specializing in the measurement of turbulent plasma fluctuations. Most are for plasma edge measurements due to easier accessibility.
Fluctuation measurements tend to concentrate on the plasma edge due to easier accessibility as well as greater theoretical interest, especially after the discovery of H-mode. The fluctuations in density ( ˜n), electrostatic potential ( ˜Φ), magnetic field ( ˜B) and temperature ( ˜T) are all relevant to confinement. Many features of the fluctuations in tokamaks are nearly universal and some will be reviewed here.
The relative amplitude of density fluctuations ( ˜n n) can be measured by Langmuir probes, BES and HIBP diagnostics, all of which can be easily calibrated. On the other hand, scattering and reflectometry systems can offer only approximate values of this measurement. In several fusion devices, the relative amplitude ˜n nwas observed to increase towards the edge and peak just inside or on the LCFS. For example, in TFTR, 0.1-1% was measured in the core and 5-10% at the plasma edge [28]. In TEXT, edge ˜n nwas found to be around 10-20 %, reaching up to 50 % in the SOL [29]. Similar behaviour was observed in Alcator A and Alcator C [30] and in DIII-D [31].
3.4. TURBULENCE SUPPRESSION 25 ˜B are heat sensitive and thus can only be used at the plasma edge. Typical measurements of magnetic field fluctuations give ˜B/B 10
5
10
4[32]. Similarly, the diagnostics for
temper-ature fluctuation measurements, namely Thomson scattering and correlation ECE, have their limitations. The Thomson scattering diagnostic is spatial and/or temporal limited whereas the ECE diagnostic measures the rms value of the temperature fluctuations but not its spectrum. Furthermore, the diagnostics for potential fluctuations are expensive and the analysis is com-plicated. Hence, the database for density fluctuation measurements is considerably larger than all other fluctuation measurements.
Besides traditional fluctuation diagnostics, there has been effort to develop new and more di-versified diagnostic techniques for other types of turbulence measurements. One such example is the correlation Doppler reflectometer, from which the radial correlation lengths of the turbu-lence may be obtained. This new technique has recently been applied on ASDEX Upgrade and is a major part of this thesis work. (The results may be found in chapter 8). Radial correlation lengths have also been determined on other fusion machines using different diagnostics. In TFTR, values of 2-3cm at the edge and 1-2 cm in the core were derived from BES data [33]. At JET, core radial correlation lengths in the range 2-20mm were measured by a correlation reflectometer [34]. A correlation reflectometer was also employed on DIII-D, which reported radial correlation lengths in the range 1-5mm [35]. The lower range of the JET and DIII-D radial lengths correspond to Ohmic and H-mode plasmas while the upper range was measured in L-mode plasmas. Recent measurements on DIII-D show radial correlation lengths small at the plasma edge ( 0.5cm) and increasing into the plasma core, up to 4cm [36]. There
are however a range of methods for obtaining radial correlation lengths [37], which makes a comparison of the radial correlation length measurements from the various machines difficult.
3.4 Turbulence Suppression
The confinement of a plasma is a key factor in determining the efficiency of a fusion reactor. The better the confinement, the smaller the reactor needs to be. This would reduce develop-ment costs and lead to a more economically attractive fusion reactor. Therefore, understanding the mechanisms of turbulence suppression in a plasma and discovering techniques to control turbulence are needed for developing magnetic fusion. This section examines the mechanisms of turbulence suppression in confined plasmas using existent theories and experimental results.
3.4.1 The Radial Electric Field
The radial electric field in a plasma is not zero as one might have expected in an electrically neutral plasma, where the average charge density is zero. By Maxwell’s equations, an electric field arises as the plasma moves in a magnetic field. This non-negligible electric field creates a fluid like motion known as theE Bdrift given by
vE B
E B
In the past, little attention was paid to the plasma radial electric field since no major effects of
Er on plasma confinement was observed. However, when the transition from low-confinement
mode (L-mode) to high-confinement mode (H-mode) was found on ASDEX in the 1980’s [12], a spontaneous bifurcation ofEr was used as a theoretical model for explaining the improved
confinement.
The radial electric field can be deduced from the radial force balance for any plasma species j
Er
1
njej
d pj
dr vθjBφ vφjBθ (3.2)
where ej, pj, nj, vθj and vφj are the charge, pressure, density and poloidal and toroidal
ve-locities of species j. Equation 3.2 shows a relationship betweenEr and the cross field heat
and particle transport (∇pj), cross field angular momentum transport (vφj) and poloidal flow
(vθj). The electric field is usually determined by spectroscopic measurement of the rotation
of impurities. Using this technique on several machines such as in DIII-D [38], JFT-2M [39] and ASDEX [40], a sudden change in Er at the plasma periphery in an L-H transition was
seen. The significant change inEr right at the L-H transition was detected before the density
and temperature profiles changed, indicating that the initial change inEr is not caused by the
improved confinement [38, 41, 42]. However, theErmay change further with the development
of the profiles [38, 43, 44, 45]. This sequence is what one would expect from a model in which the change inEr stabilizes turbulent fluctuations, which then leads to a change in the particle
and heat fluxes [41].
By experimentally inducing an external radial electric field in the plasmas of CCT [46] and TEXTOR [47] fusion devices, H-modes could be triggered. These experiments, which produce H-modes by plasma biasing, have shown that after the bias is applied,Er evolves to a certain
point where bifurcation occurs and the H-mode develops. This supports the casual role ofEr.
There are two important mechanisms in the formation ofEr:
1) Damping term which is viscosity in plasma rotations (i.e. strongly damped in the poloidal direction)
2) Driving force to rotate plasmas toroidally or poloidally
Of the driving force, two types are considered: one is the force due to neutral beam injection and the other is the non-ambipolar flux due to electron or ion diffusion across the magnetic field.
In tokamak fundamental transport equations, all the direct radial electric field effects cancel and only the derivatives of Er enter into the equations [48]. Thus, it is not yet known which
quantity (Er or its first derivative ∂Er ∂r) is more decisive for transport and turbulence
sup-pression.
3.4.2 The Radial Electric Field Shear
There is accumulating evidence that shearedE Brotation is the mechanism most likely
3.4. TURBULENCE SUPPRESSION 27 ITBs) in plasmas. TheE Bflow shear reduces the plasma turbulence by nonlinear
decorre-lation and linear stabilization of turbulent eddies. In nonlinear turbulence decorredecorre-lation theory [8, 49], theE B velocity shear decorrelates the turbulent fluctuations, decreases the radial
correlation lengths and fluctuation amplitudes and changes the phase between density and ve-locity fluctuations, thereby resulting in a reduction in radial transport. In linear stabilization theory [50, 51, 52], the velocity shear can couple unstable modes to stable modes leading to transport reduction.
V
Lr
∆
r
Lr
1
2
3
Figure 3.3: The effect of a sheared vE B on a turbulent eddy. The shear breaks apart the
turbulent eddy, leading to smaller radial correlation lengths, Lr.
The effect of nonlinear decorrelation is illustrated in figure 3.3. The figure shows a sketch of a turbulent eddy with a geometry labeled 1, giving a specific radial correlation length,Lr. In the
presence of anE Bvelocity shear, the eddy becomes elongated (labeled 2) and eventually
if the shear is strong enough, broken up (labeled 3). The resulting eddies now have smaller radial correlation lengths in comparison with the original eddy.
Figure 3.4 gives an illustration of numerical simulation of turbulence decorrelation [53]. Elec-tromagnetic turbulence is generated by a gyrofluid model andE Bflow shear is imposed on
the turbulence. With increasing shear, the structures in ion temperatureTi are first deformed
and then broken up.
Equation 3.1 shows a link between shear in theE B velocity and shear in the radial
elec-tric field∂Er ∂r. Therefore, if theE B velocity shear is indeed responsible for turbulence
suppression, the ∂Er ∂r may be considered as fundamental in quenching turbulence. This
θ
r
E×B
v
E×B
v
E
×
B
Increasing
ω
Figure 3.4: The effect of a sheared vE B on plasma turbulence [53]. Increasing the shear ωE B tears apart the turbulent eddies, leading to transport reduction.
the L-H transition, an electric field shear develops in a localized region near the plasma edge [41, 42, 54, 55]. These experiments also show how in the same edge region, the turbulent density fluctuations decreased. There was also evidence of a coinciding decrease in particle and energy transport detected by an increase in the local gradients [39, 42, 54, 56]. Not only a spatial correlation between increasedEr shear, decreased density fluctuations and improved
transport was observed, but also a temporal correlation [41].
3.4.2.1 BDT Model
From the theoretical point of view, the Biglari, Diamond and Terry model developed in the early 1990’s has been the most oft-cited model includingEr shear effects. The BDT model
shows concisely how electric field shear can nonlinearly stabilize a broad class of general, flute-like turbulent modes in the plasma. The criterion for shear decorrelation to be important is when the shearing rate exceeds the decorrelation time. This can be written as
∇Er
Bφ
∆ωt
3.4. TURBULENCE SUPPRESSION 29 where Bφ is the toroidal magnetic field, ∆ωt is the turbulent decorrelation frequency, Lr is
the radial correlation length andkθ is the poloidal wavenumber of the turbulence. Note how turbulence stabilization is independent of the sign of∇Er.
In addition, the BDT model accounts for the different behavior at the large and small major radius sides of the plasma. Due to the tokamak’s toroidal geometry, variation inErshear exists.
This can be seen by the equation for the shearing rate given by
∇Er
Bφ
RBθ
2
Bφ d
2Φ
dψ2
(3.4)
whereΦis the electrostatic potential,ψ the poloidal flux function,Bθ the poloidal magnetic field andRthe major radius. Assuming that the electrostatic potential (d2Φ dψ2) is constant
on a flux surface, the electric field shear term varies as
RBθ
2 B
φ. This quantity is