IJEDR1503038 International Journal of Engineering Development and Research (www.ijedr.org) 1
Analysis of Change Detection Techniques using
Remotely Sensed Data
1Sadhana Tripathi,2Prof. Ameya Naik,3Mrs. Swapna Patil 1M.E. Student,2Professor,3Assistant professor 1Electronics & Telecommunications Department, 1Shree L R Tiwari College of Engineering, Mumbai, India
________________________________________________________________________________________________________ Abstract – Accurate information about nature and extent of land cover changes especially in rapidly growing areas is essential. Change detection plays very important role in different applications such as video surveillance, medical imaging and remote sensing. It plays a very important role in landuse and cover analysis, forest and vegetation inspection and flood monitoring. Semarang City, located on the north coast of island of Java, Indonesia that is very much prone to tidal floods. The objective of this research is to assess, evaluate and monitor the nature and extent of land cover changes in Semarang city through the period from 2012 to 2014 using remotely sensed Landsat multispectral images. Four change detection techniques namely; post-classification, image differencing, image regression and principal component analysis were applied. The objective is extended to examine the effectiveness of each change detection technique regarding the ability to differentiate changed from unchanged areas based on the pixel-by-pixel analysis and calculating the overall number of changed pixels. The results indicated that the post classification change detection technique provided the highest accuracy while the principal component analysis technique gave the least accuracy.
IndexTerms – Change detection, Post classification, Image differencing, Image regression, Principal component Analysis
_______________________________________________________________________________________________________
I.INTRODUCTION
The earth's surface is changing as a result of natural phenomena or human activity, for example, wildfires, lightning strikes, storms, pests, agro-forestry, agricultural expansion, social, economic, technological, historical factors and urban growth. Change detection can be defined as the process of identifying differences in the state of an object or phenomenon by observing it at different times. This process is usually applied to Earth surface changes at two or more times. Data from remote sensing with its synoptic and regular coverage at short interval and consistent image quality provides a viable source of updated land cover information which can be extracted efficiently and cheaply in order to inventory and monitor types and extent of environmental changes. The basic premise in using remotely sensed data is that, changes in land cover must result in differences in radiance values that must be large enough with respect to radiance changes caused by other false factors such as differences in atmospheric conditions, illumination, and viewing angle.
Semarang city, located to the north coast of Java, Indonesia has been considered as sixth most populous city and the fifth largest Indonesian city after Jakarta, Surabaya, Bandung, and Medan. Greater Semarang (aka Kedungsapur) has a population of close to 6 million, and is located at6°58′S 110°25′E. It is considered as one of the tidal flood prone area on the island. So, it became important to have institutional capabilities for monitoring, assessment and control of land cover changes for this island city. Moreover, the quantitative and qualitative analysis of these changes will certainly provide very important information for the prediction of the future changes which will certainly help for the decision making for economic development and resource management of Semarang city. The objective of this research is to identify the nature and extent of land-cover changes of Semarang city through the period from 2012 to 2014. There are several methods for mapping land cover changes using remotely sensed data. In this study, four of the most commonly used change detection techniques were applied to detect the nature and extent of the land-cover changes in Semarang city using Landsat multispectral images. These techniques are; (1) post-classification, (2) image differencing, (3) image regression, and (4) principal component analysis. Finally, quantitative evaluations for the results of these techniques were performed to determine the most appropriate change detection technique which will provide the highest accuracy for identifying the nature and extent of land-cover changes in Semarang city. In this study several image processing steps were conducted by the aid of MATLAB software version 7.1.
II.STUDY AREA AND DATA SETS
Study area
IJEDR1503038 International Journal of Engineering Development and Research (www.ijedr.org) 2 Data Sets
Two Landsat subscenes covering the study area were used. The first subscene was acquired in 2012 which shows the image befor the city was hit by floods and the second subscene was acquired in 2014 which shows the image after the city was hit by floods. Both the subscenes are available in bands 3, 2 and 1 as shown in Figure 1.
Fig.1(a) Semarany City, 2012 Fig.1(b) Semarang City, 2014
III.METHODOLOGY AND RESULTS
Four of the most commonly used change detection methods were applied to the multi-temporal Landsat images. These methods are: (1) Post-Classification (2) Image differencing (3) Image regression, and (4) Principal Components Analysis (PCA). The output was then analysed on pixel-by-pixel to detect the overall number of changed pixels using all the four methods mentioned before. Finally, the analysis of the results obtained using all the methods was done to find the most accurate method of Change Detection based the number of changed pixels detected.
Post Classification Comparison
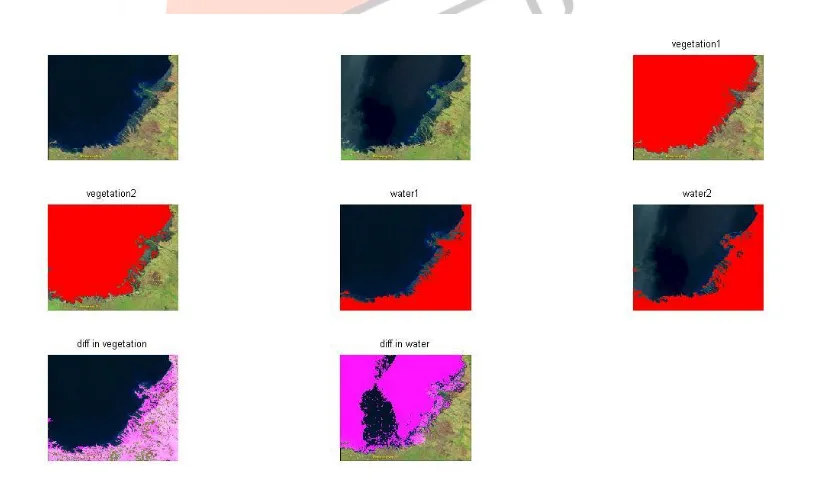
Initially, an unsupervised classification was applied to both the acquired multi-temporal images using MATLAB software. Both the multi-temporal images were classified into two classes namely, water and vegetation. Lastly, the classified image of Semarang city after flood taken in 2014 was subtracted from the pre-flood 2012 image. The analysis of the output was done on pixel-by-pixel basis and the total number of changed pixels were calculated. The simulation results of the Post Classification method is shown in Figure 2.
Fig 2. Simulation results of Post Classification method
IJEDR1503038 International Journal of Engineering Development and Research (www.ijedr.org) 3 vegetation2 image is subtracted from vegetation1 image as shown in diff in vegetation image in which purple colored pixels shows the changed pixels. Similarly, diff in water image shows changes in the water pixels in the images.
Image Differencing
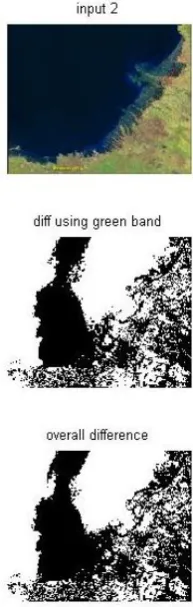
Image differencing change detection technique is performed by subtracting the digital number (DN) value of a pixel in one date for a given band from the DN value of the same pixel for the same band of another date. For each band, image 2012 was subtracted from image 2014 in a pixel by pixel manner resulting in three difference images for the three bands 3, 2 and 1. For each difference image, a threshold value based on standard deviation (SD) is required to delineate the changed pixels from the unchanged pixels. To determine the most appropriate threshold value, an iterative process was carried out by selecting different threshold values of the standard deviation. The results of the image differencing technique are simply the pixels that changed between the two acquisition dates. The simulation results of Image Differencing method using MATLAB is shown in Figure 3.
Fig.3 Simulation results of Image Differencing Change Detection Method
Figure 3 shows the two datasets, along with the number of changed pixels shown by white colored pixels in bands 3,2 and 1 and finally the overall number of changed pixels is shown by the white colored area.
Image Regression
The regression intersection method of minimizing the effect of the atmosphere is attractive to many analysts as it provides absolute results from the image data without the use of ancillary data. The method generally involves calculation of regression lines for a number of surface materials of contrasting spectral properties. The regression line method (RLM) determines a 'best fit' line for multispectral plots of pixels within homogenous cover types. Ideally, the intersection of lines must represent a point of zero ground reflectance since this is the only point at which radiometric values of two spectrally different materials can be safe. If no atmospheric scattering has taken place, the intersection of the line would be expected to pass through the origin. The slope of the plot is proportional to the ratio of the reflective material. However, the lines will, in reality, intersect the x and y axis producing two offset values. These brightness values represent the amount of bias caused by atmospheric scattering Crippen (1987) recommends the collection of a series of training areas resulting in many regression lines intersecting in two dimensional spaces at the same point using training sets to represent homogeneous land cover types. The relative values generated by regression method tend to be more reliable.
IJEDR1503038 International Journal of Engineering Development and Research (www.ijedr.org) 4 Fig.4 Simulation results of Image Regression Change Detection method
Figure 4 shows the two image data sets used as input1 and input2 along the regressed image shown as predicted image2 which is then subtracted from input2. The final image 2predicted minus image2 image shows the overall number of changed pixels by blue colored pixels and green colored pixels.
Principal Component Analysis (PCA)
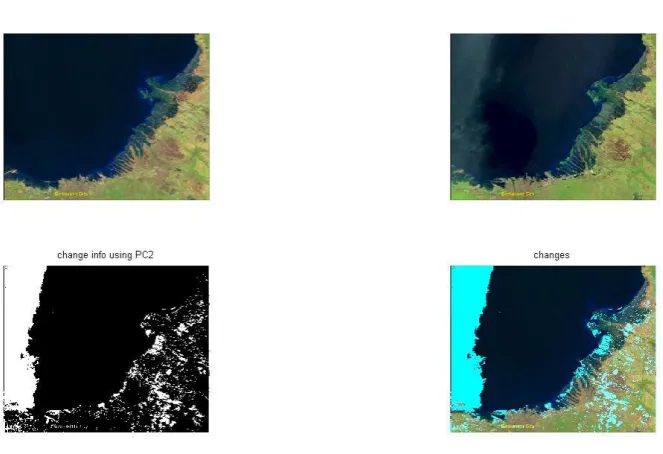
The principal components are based on the eigenvectors of the variance – covariance matrix of the merged data set (the six bands). These eigenvectors were linearly transformed to provide the eigenstructure which specify the type of information content and the weight of which band variance loaded and involved in each principal component. Thus, the unchanged areas which have high correlation between the two examined images, i.e., areas of common variance in the two dates could be explained by the first PCs as they sought to account for the maximum possible variance of the multi-date data. In contrast, changed areas which can be interpreted as the features that are not present in either of the sets and occupy only a minor proportion of the two dates would be presented in the latter order of the principal components. This whole procedure was implemented using MATLAB software and the output of only PC 2 component was considered which gave the information about the changes occurred in the images. The simulation results of the PCA change detection method is shown in figure 5.
Fig.5 Simulation results of Principal Component Analysis Change Detection method
IJEDR1503038 International Journal of Engineering Development and Research (www.ijedr.org) 5
IV.ANALYSIS OF RESULTS
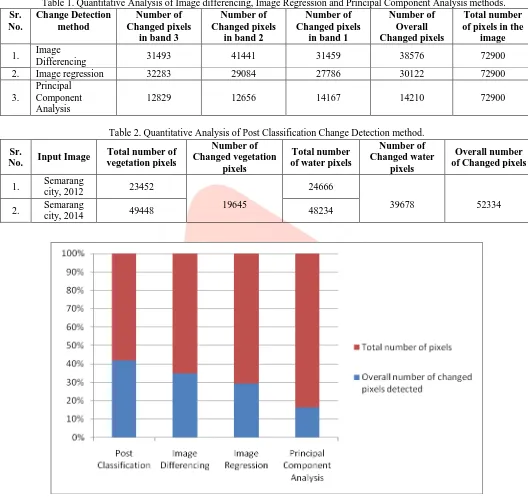
The quantitative analysis of all the four methods implemented using MATLAB software can be summarized in the following table 1 and table 2. Table 1 shows the ocerall number of changed pixels detected by Image Differencing, Image regression and Principal component analysis methods while table 2 shows the overall number of changed pixels detected by the Post classification change detection method.
Table 1. Quantitative Analysis of Image differencing, Image Regression and Principal Component Analysis methods.
Sr. No. Change Detection method Number of Changed pixels
in band 3
Number of Changed pixels
in band 2
Number of Changed pixels
in band 1
Number of Overall Changed pixels
Total number of pixels in the
image
1. Image
Differencing 31493 41441 31459 38576 72900
2. Image regression 32283 29084 27786 30122 72900
3.
Principal Component Analysis
12829 12656 14167 14210 72900
Table 2. Quantitative Analysis of Post Classification Change Detection method.
Sr.
No. Input Image
Total number of vegetation pixels
Number of Changed vegetation
pixels
Total number of water pixels
Number of Changed water
pixels
Overall number of Changed pixels
1. Semarang
city, 2012 23452
19645
24666
39678 52334
2. Semarang
city, 2014 49448 48234
Graph 1. Overall number of changed pixels detected by all the four methods.
Graph 1 summarizes the overall accuracy calculated from each change/unchange and classified number of pixels by applying the four change detection techniques, it can be noted that the post-classification change detection technique has provided the highest overall accuracy compared to the other three change detection techniques, it is followed by the image differencing and image regression techniques and finally the principal component technique. This is because the post classification technique requires less processing steps which depend mainly on the individual classifications of the two data sets.
V.CONCLUSION
IJEDR1503038 International Journal of Engineering Development and Research (www.ijedr.org) 6 determining the appropriate threshold value etc. These additional processing steps resulted in more errors induced and consequently reduced the overall accuracy of the results obtained using these change detection techniques. The obtained accuracy due to using the principal component technique for the change/unchange and classified change image is the lowest compared to the other used techniques. It seems that, the changed areas between the two original images are not effectively represented by the information content of PC2.
VI.ACKNOWLEDGMENT
I take this opportunity to express a deep sense of gratitude towards my guide Prof. Ameya Naik, for providing excellent guidance, encouragement and inspiration throughout the project work. Without his invaluable guidance, this work would never have been a successful one. Also specially thanks to Mrs. Pragati Dwivedi for helping me in accomplishing my project.
REFERENCES
[1] Singh, A., 1989. “Review Article Digital change detection techniques using remotely- sensed data”, International Journal of Remote Sensing 10, 989–100
[2] Hafez A. Afify, “Evaluation of change detection techniques for monitoring land-cover changes: A case study in new Burg El-Arab area”, Alexandria Engineering Journal (2011) 50, 187–195.
[3] Masroor Hussain, DongmeiChen , AngelaCheng, HuiWei, DavidStanley(2013),” Change detection from remotely sensed images: From pixel-based to object-based approaches”, ISPRS Journal of Photogrammetry and Remote Sensing
[4] J.-F. MAS,” Monitoring land-cover changes: a comparison of change detection techniques”, Int. j. remote sensing, 1999, VOL. 20, NO. 1, 139 -152.
[5] Nathan Longbotham, Alina Zare, Emmanuel Christophe, Jocelyn Chanussot,” Multi-Modal Change Detection, Application to the Detection of Flooded Areas: Outcome of the 2009–2010 Data Fusion Contest”, IEEE journal of selected topics in applied earth observations and remote sensing, vol. 5, no. 1, february 2012
[6] N. Amiri, “Evaluation of different change detection techniques in forestry for improvement of spatial objects extraction algorithms by very high resolution remote sensing digital imagery”, International Archives of the Photogrammetry, Remote Sensing and Spatial Information Sciences, Volume XL-1/W3, 2013 SMPR 2013, 5 – 8 October 2013, Tehran, Iran
[7] Vikrant Gulati , Pushp Araj Pal ,” Survey on Various Change Detection Techniques for Hyper Spectral Images” , International Journal of Advanced Research in Computer Science and Software Engineering, Volume 4, Issue 8, August 2014
[8] Zhang Xiaodong*, Gong JianYa, Li Deren (1989),” A STRATEGY OF CHANGE DETECTION BASED ON REMOTELY SENSED IMAGERY AND GIS DATA”, ISPRS proceedings,XXXVI,part7.
[9] Zhengguang Shen and Qi Wang,, “Failure Detection, Isolation, and Recovery of Multifunctional Self-Validating Sensor” IEEE Transactions On Instrumentation And Measurement, Vol. 61, No. 12, December 2012.
[10] Yakoub Bazi, Member, IEEE, Farid Melgani, Senior Member, IEEE, and Hamed D. Al-Sharari, “Unsupervised Change Detection in Multispectral Remotely Sensed Imagery With Level Set Methods”, IEEE Transactions On Geoscience And Remote Sensing, vol. 48, no. 8, august 2010.