c
⃝Owned by the authors, published by EDP Sciences, 2017
Standard Model and New physics for
ε
′K
/ε
KTeppei Kitahara1,2,a
1Institute for Theoretical Particle Physics (TTP), Karlsruhe Institute of Technology, Engesserstraße 7, D-76128 Karlsruhe,
Ger-many
2Institute for Nuclear Physics (IKP), Karlsruhe Institute of Technology, Hermann-von-Helmholtz-Platz 1, D-76344
Eggenstein-Leopoldshafen, Germany
Abstract. The first result of the lattice simulation and improved perturbative calculations have pointed to a discrepancy between data onε′
K/εK and the standard-model (SM) prediction. Several new physics (NP) models can explain this discrepancy, and such NP models are likely to predict deviations ofB(K→πνν) from
the SM predictions, which can be probed precisely in the near future by NA62 and KOTO experiments. We present correlations betweenε′K/εKandB(K→πνν) in two types of NP scenarios: a box dominated scenario and aZ-penguin dominated one. It is shown that different correlations are predicted and the future precision
measurements ofK→πννcan distinguish both scenarios.
1 Introduction and Standard-Model
predictions of
ε
′KCharge-parity (CP) violating flavour-changing neutral cur-rent decays of K mesons are extremely sensitive to new physics (NP) and can probe radiative corrections of parti-cles with masses far above the reach of the Large Hadron Collider. Prime examples of such observables are a direct
CPviolation inK→ππdecays andB(KL→π0νν).
In K → ππdecays, one distinguishes between two
types ofCPviolations: direct and indirectCPviolations which are parametrized byε′K andεK, respectively. Both
types ofCPviolations have been quantified by many kaon experiments precisely. WhileεKis a per mille effect in the
Standard Model (SM),ε′K is smaller by another three or-ders of magnitude:ε′K ∼ O(10−6). This strong suppression
comes from the smallness of the isospin-3/2 amplitude compared to the isospin-1/2 amplitude (∆I = 1/2 rule) and an accidental cancellation of leading contributions in the SM. Their suppressions lead to high sensitivity to the physics beyond the SM.
Until recently, large theoretical uncertainties precluded reliable predictions forε′K. Although SM predictions ofε′K
using chiral perturbation theory are consistent with the ex-perimental value, their theoretical uncertainties are large. In contrast, calculation by the dual QCD approach [1] finds the SM value much below the experimental one. A major breakthrough has been the recent lattice-QCD cal-culation of the hadronic matrix elements by RBC-UKQCD collaboration [2, 3], which gives support to the latter re-sult.
ae-mail: [email protected]
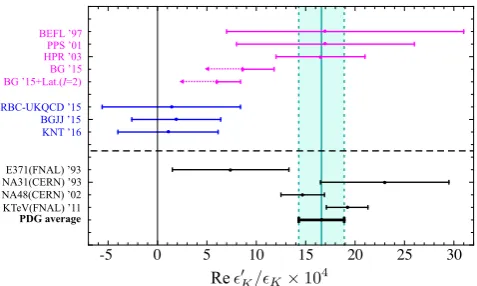
BEFL ’97 PPS ’01 HPR ’03 BG ’15
BG ’15+Lat.(I=2)
RBC-UKQCD ’15 BGJJ ’15 KNT ’16
E371(FNAL) ’93 NA31(CERN) ’93 NA48(CERN) ’02 KTeV(FNAL) ’11
PDG average
Re
-5 0 5 10 15 20 25 30
Figure 1.Compilation of representative SM predictions and the experimental values for Re(ε′
K/εK). All error bars represent 1σ range. The SM predictions are taken from Bertoliniet al.(BEFL ’97) [4], Pallante et al. (PPS ’01) [5], Hambyeet al. (HPR ’03) [6], Buras and Gérard (BG ’15) [7, 8], RBC-UKQCD lat-tice result [2, 3], Buraset al. (BGJJ ’15) [9], and Kitaharaet al. (KNT ’16) [10], where magenta bars are based on analytic ap-proaches to hadronic matrix elements, while blue bars are based on lattice results. The black thick one is the world average of the experimental values [15].
The compilation of representative SM predictions and the experimental values for Re(ε′K/εK) is given in
Fig. 1. The SM predictions (colored bars) are taken from: Bertolini et al. (BEFL ’97) [4], Pallante et al. (PPS ’01) [5], Hambyeet al. (HPR ’03) [6], Buras and Gérard (BG ’15) [7, 8] with lattice result forI=2 (BG ’15+Lat.),
ex-perimental values (black bars) are taken from: E371 [11], NA31 [12], NA48 [13] and KTeV [14] collaborations, and the black thick one is the world average of the experimen-tal values [15]
Re(ε′K/εK)exp=(16.6±2.3)×10−4. (1)
In order to predictε′K in the SM, one has to calculate the hadronic matrix elements of four-quark operators with nonperturbative methods. The magenta bars in Fig. 1 have utilized analytic approaches to calculating them: chiral quark model (BEFL ’97), chiral perturbation theory (PPS ’01) with minimal hadronic approximation (HPR ’03), and the dual QCD approach (BG ’15). Note that the dual QCD approach predicts an upper bound on ε′K/εK. Recently,
the result of the chiral perturbation theory has been up-dated [16]:
(ε′
K/εK)ChPT=(15±7)×10−4. (2)
On the other hand, a determination of all hadronic ma-trix elements from lattice QCD has been obtained only re-cently by the RBC-UKQCD collaboration [2, 3], and the blue bars are based on the lattice result:
ε′K/εK=
(1.9±4.5)×10
−4 (BGJJ ’15),
(1.06±5.07)×10−4 (KNT ’16). (3)
These results are obtained by next-to-leading order (NLO) calculations exploiting CP-conserving data to reduce hadronic uncertainties and include isospin-violating con-tributions [17] which are not included in the lattice re-sult. Furthermore, the latter result includes an additional O(α2EM/α2s) correction, which appears only in this order,
and also utilizes a new analytic solution of the renor-malization group (RG) equation which avoids the prob-lem of singularities in the NLO terms. The two numbers in Eq. (3) disagree with the experimental value in Eq. (1) by 2.9σ[9] and 2.8σ[10], respectively. The uncertain-ties are dominated by the lattice statistical and systematic uncertainties for theI=0 amplitude.
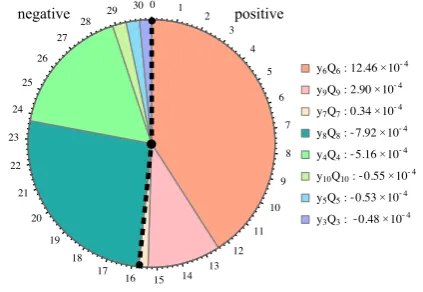
In Fig. 2, the contributions of individual operators to
ε′K/εKare shown, whereyifori=3,4, . . . ,10 are the
cor-responding Wilson coefficients. These values are based on
Ref. [10].Q3–Q6are called QCD penguin operators,
Q3=( ¯sd)V−A ∑
q
(¯qq)V−A, (4)
Q4= (
¯
sαdβ )
V−A ∑
q (
¯
qβqα )
V−A, (5)
Q5=( ¯sd)V−A ∑
q
(¯qq)V+A, (6)
Q6= (
¯
sαdβ )
V−A ∑
q (
¯
qβqα )
V+A, (7)
y6Q6: 12.46×10⁻⁴
y9Q9: 2.90×10⁻⁴
y7Q7: 0.34×10⁻⁴
y8Q8:-7.92×10⁻⁴
y4Q4:-5.16×10⁻⁴
y10Q10:-0.55×10⁻⁴
y5Q5:-0.53×10⁻⁴
y3Q3:-0.48×10⁻⁴
0 1 2
3 4
5 6
7
8
9 10 11 12 13 14 15 16 17 18 19 20 21 22 23 24
25 26
27 28
29 30 positive
negative
Figure 2. The composition ofε′
K/εKwith respect to the oper-ator basis. The right and left side of the dashed lines represent positive and negative contributions toε′K/εK, respectively. This figure is based on the result of Ref. [10].
whileQ7–Q10are called electroweak penguin operators,
Q7=3
2( ¯sd)V−A ∑
q
eq(¯qq)V+A, (8)
Q8=32 (
¯
sαdβ )
V−A ∑
q
eq (
¯
qβqα )
V+A, (9)
Q9=32( ¯sd)V−A ∑
q
eq(¯qq)V−A, (10)
Q10 =32 (
¯
sαdβ )
V−A ∑
q
eq (
¯
qβqα )
V−A, (11)
whereV ∓Arepresentsγµ(1∓γ5),αandβdenote color
indices, andeq is the electric charge of the quarkq. The
leading contributions come from Q6 andQ8, having
op-posite sign, and thus a cancellation emerges. Remarkably, this figure also shows that even if one includes sub-leading contributions, the cancellation still exists with high preci-sion.
The main difference between each result of analytic
approaches and the lattice result comes from the hadronic parameter B(1/2)
6 ∝ ⟨(ππ)I=0|Q6|K0⟩, which controls the
largest positive contribution to ε′K/εK (they6Q6
compo-nent in the Fig. 2). In chiral perturbation theory, typically large values are obtained: B(1/2)
6 ∼1.6 (BEFL ’97),∼1.6
(PPS ’01), and∼3 (HPR ’03, see Ref. [7]). On the other hand, the dual QCD approach predicts a smaller number,
B(1/2) 6 ≤B(3
/2)
8 ∼0.8 (BG ’15). The lattice result is
consis-tent with the latter result:B(1/2)
6 =0.56±0.20 [3, 10].
Al-though the lattice simulation [3] includes final-state inter-actions partially along the line of Ref. [18], final-state in-teractions have to be still fully included in the calculations in light of a discrepancy of a strong phase shiftδ0[19, 20].
perimental values (black bars) are taken from: E371 [11], NA31 [12], NA48 [13] and KTeV [14] collaborations, and the black thick one is the world average of the experimen-tal values [15]
Re(ε′K/εK)exp=(16.6±2.3)×10−4. (1)
In order to predictε′K in the SM, one has to calculate the hadronic matrix elements of four-quark operators with nonperturbative methods. The magenta bars in Fig. 1 have utilized analytic approaches to calculating them: chiral quark model (BEFL ’97), chiral perturbation theory (PPS ’01) with minimal hadronic approximation (HPR ’03), and the dual QCD approach (BG ’15). Note that the dual QCD approach predicts an upper bound on ε′K/εK. Recently,
the result of the chiral perturbation theory has been up-dated [16]:
(ε′
K/εK)ChPT=(15±7)×10−4. (2)
On the other hand, a determination of all hadronic ma-trix elements from lattice QCD has been obtained only re-cently by the RBC-UKQCD collaboration [2, 3], and the blue bars are based on the lattice result:
ε′K/εK=
(1.9±4.5)×10
−4 (BGJJ ’15),
(1.06±5.07)×10−4 (KNT ’16). (3)
These results are obtained by next-to-leading order (NLO) calculations exploiting CP-conserving data to reduce hadronic uncertainties and include isospin-violating con-tributions [17] which are not included in the lattice re-sult. Furthermore, the latter result includes an additional
O(α2EM/α2s) correction, which appears only in this order,
and also utilizes a new analytic solution of the renor-malization group (RG) equation which avoids the prob-lem of singularities in the NLO terms. The two numbers in Eq. (3) disagree with the experimental value in Eq. (1) by 2.9σ[9] and 2.8σ[10], respectively. The uncertain-ties are dominated by the lattice statistical and systematic uncertainties for theI=0 amplitude.
In Fig. 2, the contributions of individual operators to
ε′K/εKare shown, whereyifori=3,4, . . . ,10 are the
cor-responding Wilson coefficients. These values are based on
Ref. [10].Q3–Q6are called QCD penguin operators,
Q3=( ¯sd)V−A
∑
q
(¯qq)V−A, (4)
Q4=
(
¯
sαdβ )
V−A
∑
q
(
¯
qβqα )
V−A, (5)
Q5=( ¯sd)V−A
∑
q
(¯qq)V+A, (6)
Q6=
(
¯
sαdβ )
V−A
∑
q
(
¯
qβqα )
V+A, (7)
y6Q6: 12.46×10⁻⁴
y9Q9: 2.90×10⁻⁴
y7Q7: 0.34×10⁻⁴
y8Q8:-7.92×10⁻⁴
y4Q4:-5.16×10⁻⁴
y10Q10:-0.55×10⁻⁴
y5Q5:-0.53×10⁻⁴
y3Q3:-0.48×10⁻⁴
0 1 2 3 4 5 6 7 8 9 10 11 12 13 14 15 16 17 18 19 20 21 22 23 24 25 26 27 28
29 30 positive
negative
Figure 2. The composition ofε′
K/εK with respect to the
oper-ator basis. The right and left side of the dashed lines represent positive and negative contributions toε′K/εK, respectively. This
figure is based on the result of Ref. [10].
whileQ7–Q10are called electroweak penguin operators,
Q7=3
2( ¯sd)V−A
∑
q
eq(¯qq)V+A, (8)
Q8=32
(
¯
sαdβ )
V−A
∑
q
eq(q¯βqα )
V+A, (9)
Q9=32( ¯sd)V−A
∑
q
eq(¯qq)V−A, (10)
Q10=32
(
¯
sαdβ )
V−A
∑
q
eq(q¯βqα )
V−A, (11)
whereV∓Arepresentsγµ(1∓γ5),αandβdenote color
indices, andeq is the electric charge of the quarkq. The leading contributions come from Q6 andQ8, having
op-posite sign, and thus a cancellation emerges. Remarkably, this figure also shows that even if one includes sub-leading contributions, the cancellation still exists with high preci-sion.
The main difference between each result of analytic
approaches and the lattice result comes from the hadronic parameter B(1/2)
6 ∝ ⟨(ππ)I=0|Q6|K0⟩, which controls the
largest positive contribution to ε′K/εK (the y6Q6
compo-nent in the Fig. 2). In chiral perturbation theory, typically large values are obtained: B(1/2)
6 ∼1.6 (BEFL ’97),∼1.6
(PPS ’01), and∼3 (HPR ’03, see Ref. [7]). On the other hand, the dual QCD approach predicts a smaller number,
B(1/2) 6 ≤B(3
/2)
8 ∼0.8 (BG ’15). The lattice result is
consis-tent with the latter result:B(1/2)
6 =0.56±0.20 [3, 10].
Al-though the lattice simulation [3] includes final-state inter-actions partially along the line of Ref. [18], final-state in-teractions have to be still fully included in the calculations in light of a discrepancy of a strong phase shiftδ0[19, 20].
In the near future, the increasing precision of lattice cal-culations with improved methods will further sharpen the SM predictions in Eq. (3) and answer the question about NP inε′K/εK[21].
We also should comment on the ∆I = 1/2 rule
(ReA0/ReA2)exp.=22.45±0.05. Although none of the
an-alytic approaches can explain such a large value, the first lattice calculation has found a consistent value within 1σ,
(ReA0/ReA2)Lat.=31.0±11.1 [2, 3, 8].
Several NP models including supersymmetry (SUSY) can explain the discrepancy of ε′K/εK. It is known that
such NP models are likely to predict deviations of branch-ing ratios of the kaon rare decay from the SM predictions, especially B(K → πνν) which includes CP-violating flavour-changing neutral current decay and can be probed precisely in the near future by NA62 and KOTO experi-ments.1 In this contribution, based on the lattice result of
ε′K/εKand Eq. (3), we present correlations betweenε′K/εK
andB(K → πνν) in two types of NP scenarios: a box dominated scenario and aZ-penguin dominated one, and discuss how to distinguish between them.
2 Box dominated (Trojan penguin)
scenario
We first focus on the box dominated scenario, where all NP contributions to|∆S|= 1 and|∆S| =2 processes are
dominated by the four-fermion box diagrams. Such a sit-uation is realized in the minimal supersymmetric standard model (MSSM) [23]. The desired effect in ε′K is gener-ated via gluino-squark box diagrams which are shown in Fig. 3, when the mass difference between the right-handed
up and down squarks exists. Such a contribution is called
Trojan penguinbecause its effect is parameterized by the
electroweak penguin operator at low energy scale [24]. While the sizable effects inε′Kare obtained by the
Tro-jan penguin contributions, a simultaneous efficient
sup-pression of the SUSY QCD contributions toεK can also
be achieved, which is shown in the following subsection.
2.1 Suppression of contributions toεK
An explanation of the puzzle between Eq. (1) and Eq. (3) by physics beyond the SM requires a NP contribution which is seemingly even larger than the SM contribution. However, it is known that once constraints from the cor-responding|∆S|=2 transition are taken into account, one
expects that NP effects in a|∆S| = 1 four-quark process
are highly suppressed. To explain the NP hierarchy in
|∆S| = 1 vs|∆S| = 2 transitions, we specify toε′K and εK: The SM contributions are governed by the
combi-nation τ = −VtdVts∗/(VudV∗
us) ∼ (1.5−i0.6)×10−3 with ε′KSM ∝ Imτ/M2
W andεSMK ∝ Imτ2/MW2. If the NP
con-tribution enters through the |∆S = 1| parameter δ and is mediated by heavy particles of mass M, one obtains
ε′KNP ∝ Imδ/M2,εNP
K ∝ Imδ2/M2, and therefore the
ex-perimental constraint|εNPK | ≤ |εSMK |leads to
�� �� ��ε
′NP K ε′KSM
�� �� ��≤
��
�ε′KNP/ε′KSM��� ��
�εNPK /εSMK ��� =O (Reτ
Reδ
)
. (12)
1The correlations betweenε′
K/εK,B(K→πνν), andεKthrough the
CKM components in the SM are discussed in Ref. [22].
Figure 3.Trojan penguin contributions to ImA2formU¯ mD¯.
If NP enters through a loop with particles of massM >∼1 TeV, the NP effects can be relevant only for|δ| ≫ |τ|, and thus Eq. (12) seemingly forbids detectable NP contribu-tions toε′K.
In the MSSM, there is a bypass to Eq. (12). The Majorana nature of the gluino leads to a suppression of gluino-squark box contributions to εK. This is so,
because there are two such diagrams (crossed and un-crossed boxes) with opposite signs. If the gluino mass
mg˜ equals roughly 1.5 times the average down squark
mass MS, both contributions to εSUSYK cancel [25]. For
mg˜ > 1.5MS, the gluino-box contribution approximately
behaves as [m2 ˜
g−(1.5MS)2]/m4g˜, and the 1/m2g˜decoupling
sets in. Note that this suppression appears only when a hi-erarchy∆Q,12≫∆D¯,12of∆Q,12≪∆D¯,12is satisfied, where
the following notation is used for the squark mass matri-ces: M2
X,i j=m2X
(
δi j+ ∆X,i j
)
,withX=Q, U¯, or ¯D.
2.2 Contributions toε′K
The master equation forε′K/εK(see e.g. Ref. [9]) reads:
ε′K εK =
ω+ √
2|εexpK |ReAexp0
[
ImA2
ω+ −
(
1−Ωˆeff )
ImA0
]
, (13)
with ˆΩeff = (14.8 ±8.0) ×10−2, the measured |εexpK |,
ω+ = (4.53±0.02) ×10−2, and the amplitudes AI = ⟨(ππ)I|H|∆S|=1|K0⟩involving the effective|∆S|=1
Hamil-tonianH|∆S|. I =0,2 represents the strong isospin of the
final two-pion state.
The MSSM contributions toε′K/εK have been widely
studied in the past. However, the SUSY-breaking scaleMS
was considered in the ballpark of the electroweak scale, so that the suppression mechanism inferred from Eq. (12) is avoided. The low-energy Hamiltonian in the case of small left-right squark mixing reads
H|∆S|=1 eff, SUSY=
GF √ 2 ∑ q 2 ∑
i=1
cqi(µ)Qqi(µ)
+ 4
∑
i=1
[c′iq(µ)Q′iq(µ)+c˜′iq(µ) ˜Q′iq(µ)]
+H.c.,
whereGF is the Fermi constant and
Qq=u,c,t
1 =
(
¯
sαqβ )
V−A
(
¯
qβdα )
V−A, (15)
Qq=u,c,t
2 =( ¯sq)V−A(¯qd)V−A, (16)
Q′q=all
1 =( ¯sd)V−A(¯qq)V+A, (17)
Q′q=all
2 =
(
¯
sαdβ )
V−A
(
¯
qβqα )
V+A, (18)
Q′q=all
3 =( ¯sd)V−A(¯qq)V−A, (19)
Q′q=all
4 =
(
¯
sαdβ )
V−A
(
¯
qβqα )
V−A. (20)
Here, opposite-chirality operators ˜Q′iq are given by inter-changingV−A↔V+A.
In this section, we focus on a case that the dominant SUSY contribution comes from Trojan penguin diagrams in Fig. 3. The other SUSY solution focusing theZ-penguin contributions is investigated in the next section. The box diagrams contribute to ImA2 when mU¯ mD¯. Because
these contributions are governed by the strong interaction and there is an enhancement factor 1/ω+ = 22.1 for the
ImA2term in (13), they easily become the largest
contri-bution toε′K/εK [24]. In order to obtain the desired large
effect inε′K, one needs a contribution to the operatorsQ′1,2
with (V−A)×(V+A) Dirac structure, whose matrix
ele-ments are chirally enhanced by a factor (mK/ms)2. Hence,
the flavour mixing has to be in the left-handed squark mass matrix. The opposite situation with right-handed flavour mixing and ˜uL- ˜dLmass splitting is not possible because of the SU(2)Linvariance.
For the calculation of SUSY contributions to ε′K/εK,
one has to use the RG equations to evolve the Wilson coefficients calculated at the high scale MS down to the
hadronic scaleµh = 1.3 GeV at which the hadronic
ma-trix elements are calculated [2, 3, 10]. To use the well-known NLO 10×10 anomalous dimensions for the SM four-fermion operator basis [26], we switch from Eq. (14) to
H|∆S|=1 eff, SUSY=
GF
√
2
10
∑
i=1
[Ci(µ)Qi(µ)+Ci˜(µ) ˜Qi(µ)]+H.c.,
(21)
whereQ1,...,10 are given in Eqs. (4)–(11), (15), and (16),
and
C1,2(µ)=cu1,2(µ), (22)
˜
C1,2(µ)=0, (23)
C3,4,5,6(µ)=1
3[c
′u
3,4,1,2(µ)+2c
′d
3,4,1,2(µ)], (24)
C7,8,9,10(µ)=23[c′1u,2,3,4(µ)−c
′d
1,2,3,4(µ)], (25)
and the coefficients ˜C3,...10 for the opposite-chirality
oper-ators can be obtained fromC3,...10by replacingc
′q
i → c˜
′q
i .
Note that the contribution of Fig. 3 is collected into the coefficientsC7,8. For the RG evolution of the coefficients,
we use the new analytic solution of the RG equations dis-cussed in Ref. [10].
1.01
1.05
0.95
0.99 1.1
1.2 1.3
1.4
1.5
0.7 0.8 0.9 0.9
1. 2. 3. 5. 7. 10. 20.
1. 2. 3. 5. 7. 10. 20.
MS TeV
mU
-TeV
Figure 4.Theε′K/εKdiscrepancy between Eq. (1) and Eq. (3) is
resolved at the 1σ(2σ) level within the dark (light) green region. The red shaded region is excluded byεKat 95 % C.L. using the
inclusive value|Vcb|, while the region between the blue-dashed
lines can explain theεKdiscrepancy which is present if the
exclu-sive determination of|Vcb|is used [27]. The blue shaded region is
excluded by the current LHC results from CMS and ATLAS [28– 30]. The only nonzero off-diagonal element of the squark mass
matrices is∆Q,12 =0.1 exp(−iπ/4) formU¯ >mD¯ = MS (upper
branch) and∆Q,12 =0.1 exp(i3π/4) formU¯ <mD¯ =MS (lower
branch). Black contour representsB(KL → π0νν)/BSM(KL →
π0νν).
In Fig. 4, the portion of the squark mass plane which simultaneously explains ε′K/εK discrepancy and εK
con-straint is shown. As input, we take the grand-unified the-ory (GUT) relation for gaugino masses,αs(MZ)=0.1185,
mg˜/MS = 1.5 for the suppressed εK, andmQ = mD¯ =
µSUSY=MS with varyingmU¯. The universal slepton mass
is set to be mL = 300 GeV. Furthermore, the trilinear
SUSY-breaking matrices Aq are set to zero, tanβ = 10,
and the only nonzero off-diagonal element of the squark
mass matrices is ∆Q,12 = 0.1 exp(−iπ/4) for the
left-handed squark sectors formU¯ >mD¯ =MS (upper branch)
and∆Q,12 = 0.1 exp(i3π/4) formU¯ < mD¯ = MS (lower
branch). We have calculated all relevant one-loop contri-butions to the coefficients in Eq. (14) in the squark mass
eigenbasis. Theε′K/εK discrepancy between Eq. (1) and
Eq. (3) can be resolved at 1σ(2σ) in the dark (light) green
region. The red region is excluded by the measurement ofεKat 95 % C.L. in combination with the inclusive|Vcb|,
while the region between the blue dashed lines can explain theεKdiscrepancy at 95 % C.L. for the exclusive value of
|Vcb| [27]. Note that θ = ±π/4 maximizes the effect in εSUSYK , while the SUSY contributions to ε′K/εK is
whereGF is the Fermi constant and
Qq=u,c,t
1 =
(
¯
sαqβ )
V−A
(
¯
qβdα )
V−A, (15)
Qq=u,c,t
2 =( ¯sq)V−A(¯qd)V−A, (16)
Q′q=all
1 =( ¯sd)V−A(¯qq)V+A, (17)
Q′q=all
2 =
(
¯
sαdβ )
V−A
(
¯
qβqα )
V+A, (18)
Q′q=all
3 =( ¯sd)V−A(¯qq)V−A, (19)
Q′q=all
4 =
(
¯
sαdβ )
V−A
(
¯
qβqα )
V−A. (20)
Here, opposite-chirality operators ˜Q′iqare given by inter-changingV−A↔V+A.
In this section, we focus on a case that the dominant SUSY contribution comes from Trojan penguin diagrams in Fig. 3. The other SUSY solution focusing theZ-penguin contributions is investigated in the next section. The box diagrams contribute to ImA2 when mU¯ mD¯. Because
these contributions are governed by the strong interaction and there is an enhancement factor 1/ω+ = 22.1 for the
ImA2term in (13), they easily become the largest
contri-bution toε′K/εK [24]. In order to obtain the desired large
effect inε′K, one needs a contribution to the operatorsQ′1,2
with (V−A)×(V+A) Dirac structure, whose matrix
ele-ments are chirally enhanced by a factor (mK/ms)2. Hence,
the flavour mixing has to be in the left-handed squark mass matrix. The opposite situation with right-handed flavour mixing and ˜uL- ˜dLmass splitting is not possible because of the SU(2)Linvariance.
For the calculation of SUSY contributions toε′K/εK,
one has to use the RG equations to evolve the Wilson coefficients calculated at the high scale MS down to the
hadronic scaleµh = 1.3 GeV at which the hadronic
ma-trix elements are calculated [2, 3, 10]. To use the well-known NLO 10×10 anomalous dimensions for the SM four-fermion operator basis [26], we switch from Eq. (14) to
H|∆S|=1 eff, SUSY=
GF
√
2
10
∑
i=1
[Ci(µ)Qi(µ)+Ci˜(µ) ˜Qi(µ)]+H.c.,
(21)
whereQ1,...,10 are given in Eqs. (4)–(11), (15), and (16),
and
C1,2(µ)=cu1,2(µ), (22)
˜
C1,2(µ)=0, (23)
C3,4,5,6(µ)=1
3[c
′u
3,4,1,2(µ)+2c
′d
3,4,1,2(µ)], (24)
C7,8,9,10(µ)=23[c′1u,2,3,4(µ)−c
′d
1,2,3,4(µ)], (25)
and the coefficients ˜C3,...10 for the opposite-chirality
oper-ators can be obtained fromC3,...10by replacingc
′q
i → c˜
′q
i .
Note that the contribution of Fig. 3 is collected into the coefficientsC7,8. For the RG evolution of the coefficients,
we use the new analytic solution of the RG equations dis-cussed in Ref. [10].
1.01
1.05
0.95
0.99 1.1
1.2 1.3
1.4
1.5
0.7 0.8 0.9 0.9
1. 2. 3. 5. 7. 10. 20.
1. 2. 3. 5. 7. 10. 20.
MS TeV
mU
-TeV
Figure 4.Theε′K/εKdiscrepancy between Eq. (1) and Eq. (3) is
resolved at the 1σ(2σ) level within the dark (light) green region. The red shaded region is excluded byεKat 95 % C.L. using the
inclusive value|Vcb|, while the region between the blue-dashed
lines can explain theεKdiscrepancy which is present if the
exclu-sive determination of|Vcb|is used [27]. The blue shaded region is
excluded by the current LHC results from CMS and ATLAS [28– 30]. The only nonzero off-diagonal element of the squark mass
matrices is∆Q,12 =0.1 exp(−iπ/4) formU¯ >mD¯ = MS (upper
branch) and∆Q,12 =0.1 exp(i3π/4) formU¯ <mD¯ =MS (lower
branch). Black contour representsB(KL → π0νν)/BSM(KL →
π0νν).
In Fig. 4, the portion of the squark mass plane which simultaneously explains ε′K/εK discrepancy and εK
con-straint is shown. As input, we take the grand-unified the-ory (GUT) relation for gaugino masses,αs(MZ)=0.1185,
mg˜/MS = 1.5 for the suppressed εK, andmQ = mD¯ =
µSUSY=MS with varyingmU¯. The universal slepton mass
is set to be mL = 300 GeV. Furthermore, the trilinear
SUSY-breaking matrices Aq are set to zero, tanβ = 10,
and the only nonzero off-diagonal element of the squark
mass matrices is ∆Q,12 = 0.1 exp(−iπ/4) for the
left-handed squark sectors formU¯ >mD¯ =MS (upper branch)
and∆Q,12 = 0.1 exp(i3π/4) formU¯ < mD¯ = MS (lower
branch). We have calculated all relevant one-loop contri-butions to the coefficients in Eq. (14) in the squark mass
eigenbasis. Theε′K/εK discrepancy between Eq. (1) and
Eq. (3) can be resolved at 1σ(2σ) in the dark (light) green
region. The red region is excluded by the measurement ofεKat 95 % C.L. in combination with the inclusive|Vcb|,
while the region between the blue dashed lines can explain theεKdiscrepancy at 95 % C.L. for the exclusive value of
|Vcb| [27]. Note that θ = ±π/4 maximizes the effect in εSUSYK , while the SUSY contributions to ε′K/εK is
maxi-mized atθ= ±π/2 resulting instead in a vanishing effect
inεSUSYK . Therefore, Fig. 4 is a conservative result in light
of theCP-violating phase.
The blue shaded region is excluded by the current LHC results [28–30]. Here, in order to be conservative, we use the most stringent one, i.e. we maximize the bound which is a function of the neutralino mass.
The black contour representsB(KL→π0νν) which is normalized byBSM(KL→π0νν)=(2.9±0.2)×10−11[31].
In this setup, we find that B(KL → π0νν)/BSM(KL →
π0νν) ≃ 1.05–1.1 is predicted in light of the ε′K/εK
dis-crepancy (and the potentialεK discrepancy) ifmU¯ >mD¯.
More detailed investigation ofB(KL→π0νν) is shown in the next subsection.
2.3 B(KL→π0νν)andB(K+→π+νν)
The SUSY contributions toεK can be suppressed by the
crossed and uncrossed box diagrams when the gluino mass is heavier than the squark mass, while there is no such can-cellation in a chargino box contribution toKL→π0ννand K+ → π+ννwhich permits potentially large effects. We
investigate the correlation betweenε′K andB(K → πνν)
varying the following parameters:
|∆Q,12|, θ, M3, mU¯/mD¯, (26)
with 0<|∆Q,12|<1 and 0 < θ <2π. Here, defining the
bilinear terms for the squarks as θ ≡ arg(∆Q,12). We fix
the slepton mass and the lightest squark mass close to the experimental limit (mL = 300 GeV andmq˜1 = 1.5 TeV)
and use GUT relations among all three gaugino masses. Figure 5 shows the correlations between ε′K and
B(K →πνν) in theB(KL→π0νν)–B(K+ →π+νν) plane
which are normalized by their SM predictions [31]. We find that the necessary amount of the tuning in the gluino mass and theCPviolating phase in order to suppress con-tributions to εK determines deviations of B(K → πνν)
from the SM values. A quantity which parameterizes the fine-tuning parameter is defined in Ref. [31]. The current ε′K/εK discrepancy between Eq. (1) and Eq. (3)
is resolved at 1σ(2σ) within the dark (light) green re-gion. In the top (bottom) panel we used mD¯/mU¯ = 1.1
(2) withmU¯ = mQ for 0 < θ < π, and mU¯/mD¯ = 1.1
(2) with mD¯ = mQ for π < θ < 2π. Numerically, we
observeB(KL → π0νν)/BSM(KL → π0νν) ≲2 (1.2) and
B(K+ → π+νν)/BSM(K+ → π+νν)≲ 1.4 (1.1) in light of
ε′K/εKdiscrepancy, if all squarks are heavier than 1.5 TeV
and if a 1 (10) % fine-tuning is permitted.
We also observe a strict correlation betweenB(KL →
π0νν) and mU¯/mD¯: sgn [B(KL → π0νν)− BSM(KL → π0νν)] = sgn [mU¯ −mD¯]. Thus, B(KL → π0νν) can
in-directly determine whether the right-handed up or down squark is the heavier one.
3
Z
-penguin dominated (modified
Z
-coupling) scenario
Next, we focus on theZ-penguin dominated scenario. The negative dominant contribution to ε′K/εK comes from Z
-penguin diagrams in the SM asy8Q8 (see Fig. 2). Since
0.0005
0.0005
0.001
0.001 0.003
0.003
0.0001 0.0001
0.4 0.6 0.8 1.0 1.2 1.4 1.6 1.8
0.0 0.5 1.0 1.5 2.0 2.5
0.005
0.003 0.005
0.005
0.4 0.6 0.8 1.0 1.2 1.4 1.6 1.8
0.6 0.7 0.8 0.9 1.0 1.1 1.2 1.3 1.4
0.003
Figure 5. The correlation is shown in the Trojan penguin sce-nario. The light (dark) blue region requires a milder parameter tuning than 1 % (10 %) of the gluino mass and theCPviolating phase in order to suppress contributions toεK. The red contour
represents the SUSY contributions toε′
K/εK, and theε′K/εK
dis-crepancy is resolved at 1σ(2σ) within the dark (light) green
re-gion. The lightest squark mass is fixed to 1.5 TeV. In the top
panel, mD¯/mU¯ = 1.1 (mU¯/mD¯ = 1.1) is used for 0 < θ < π
(π < θ <2π) to obtain a positive SUSY contribution toε′
K/εK.
While, mD¯/mU¯ = 2 (mU¯/mD¯ = 2) is used for 0 < θ < π
(π < θ <2π) in thebottompanel. The region on the right side
of the blue dashed lines are allowed by the current experimental measurements.
in the SM there is a large numerical cancelation between QCD-penguin and theZ-penguin contributions toε′K/εK,
a modifiedZ flavour-changing (s–d) interaction from NP can explain the currentε′K/εK easily [32]. Then, the
de-cay, s→ dνν, proceeding through an intermediateZ bo-son, is modified by NP. Therefore, the branching ratios of
once theε′K/εK discrepancy between Eq. (1) and Eq. (3)
is explained by the modifiedZ-coupling. They could be a signal to test the scenario. In the MSSM, such a scenario is also realized when the off-diagonal components of the
trilinear SUSY-breaking couplings are large [33–35]. Such a signal is constrained by εK. The
modi-fied Z couplings affect εK via the so-called double
pen-guin diagrams; the Z boson mediates the transition with two flavour-changing Z couplings. Such a contribution is enhanced when there are both left-handed and right-handed couplings because of the chiral enhancement of the hadronic matrix elements. An important point is that since the left-handed coupling is already present in the SM, the right-handed coupling must be constrained even without NP contributions to the left-handed one. Such interfer-ence contributions between the NP and the SM have been overlooked in the literature. References [35–37] have re-visited the modifiedZ-coupling scenario including the in-terference contributions, and found the parameter regions allowed by the indirectCPviolation change significantly.
We find that similar to the previous section, the devia-tions ofB(K → πνν) from the SM values are determined by the necessary amount of the tuning in NP contributions toεK. We parametrize it byξ: A degree of the NP
pa-rameter tuning is represented by 1/ξ, e.g.,ξ= 10 means
that the model parameters are tuned at the 10% level. The definition ofξis given in Ref. [36].
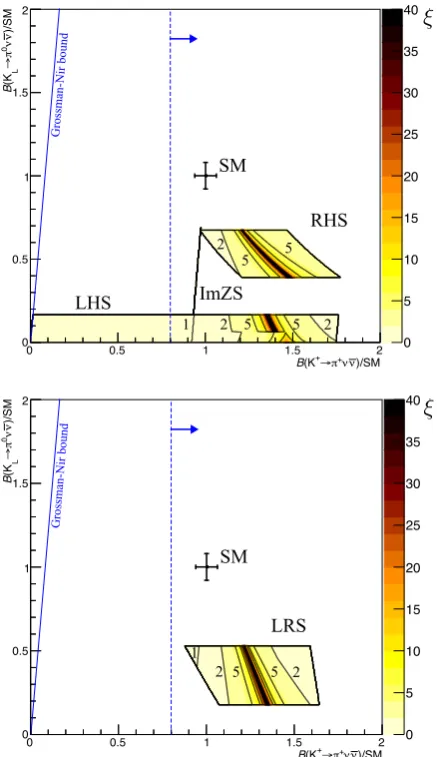
In Fig. 6, contours of the tuning parameterξare shown for the simplified scenarios: LHS (all NP effects appear as
left-handed), RHS (all NP effects appear as right-handed),
ImZS (NP effects are purely imaginary), and LRS
(left-right symmetric scenario) on the plane of the branching ra-tios ofK→πννwhich are normalized by their SM
predic-tions. We scanned the whole parameter space of the modi-fiedZ-coupling in each scenario, and selected the parame-ters whereε′K/εKis explained at the 1σlevel. The
experi-mental bounds fromεK,∆MK, andB(KL→µ+µ−) are
sat-isfied. In most of the allowed parameter regions,ξ=O(1)
is obtained. Thus, one does not require tight tunings in these simplified scenarios. In the figures,B(KL → π0νν)
is smaller than the SM value by more than 30%. On the other hand, B(K+ → π+νν) depends on the
scenar-ios. In LHS, we obtain 0 < B(K+ → π+νν)/B(K+ → π+νν)
SM < 1.8. In RHS,B(K+ → π+νν) is comparable
to or larger than the SM value, but cannot be twice as large. In ImZS, the branching ratios are perfectly corre-lated andB(K+ → π+νν) does not deviate from the SM
one. In LRS,B(KL→π0νν) does not exceed about a half
of the SM value. The more general situation is discussed in Ref. [36].
4 Discussion and conclusions
In this contribution, we introduced the current situation for theε′K/εKwithin the SM. The first lattice result and the
im-proved perturbative calculations have shown the discrep-ancy between the predicted value and the data. Several NP models can explain the discrepancy of ε′K/εK, and then
B(K→πνν) are predicted to deviate from the SM predic-tions. We have presented the correlations betweenε′K/εK,
0 5 10 15 20 25 30 35 40
)/SM
ν ν
+
π →
+
B(K
0 0.5 1 1.5 2
)/SM
ν
ν
0π→
L
B
(K
0 0.5 1 1.5 2
LHS
RHS SM
Grossman-Nir bound
ImZS 1
2
2 5
5 5
2 5
0 5 10 15 20 25 30 35 40
)/SM ν ν
+
π →
+
B(K
0 0.5 1 1.5 2
)/SM
ν
ν
0π→
L
B
(K
0 0.5 1 1.5 2
1
2 5 5 2 LRS SM
Grossman-Nir bound
Figure 6. Contours of the tuning parameterξare shown in the
simplified modifiedZ-coupling scenarios: LHS, RHS, and ImZS (toppanel) and LRS (bottom). In the colored regions,ε′K/εKis explained at 1σ, and the experimental bounds ofεK,∆MK, and
B(KL→µ+µ−) are satisfied. The right region of the blue dashed line is allowed by the measurement ofB(K+→π+νν) at 1σ. The NP scale is set to beµ=1 TeV.
B(KL→π0νν), andB(K+→π+νν) in the box dominated
scenario and the Z-penguin dominated one. It is shown that the constraint fromεKproduces different correlations
between two NP scenarios. In the future, measurements of B(K → πνν) will be significantly improved. The NA62 experiment at CERN measuring B(K+ → π+νν) is
aim-ing to reach a precision of 10 % compared to the SM value already in 2018 [38]. In order to achieve 5% accuracy more time is needed. ConcerningKL →π0νν, the KOTO
experiment at J-PARC aims in a first step at measuring B(KL → π0νν) around the SM sensitivity. Furthermore,
the KOTO-step2 experiment will aim at 100 events for the SM branching ratio, implying a precision of 10 % of this measurement [39]. Therefore, we conclude that when the ε′K/εK discrepancy is explained by the NP
ex-once theε′K/εK discrepancy between Eq. (1) and Eq. (3)
is explained by the modifiedZ-coupling. They could be a signal to test the scenario. In the MSSM, such a scenario is also realized when the off-diagonal components of the
trilinear SUSY-breaking couplings are large [33–35]. Such a signal is constrained by εK. The
modi-fied Z couplings affect εK via the so-called double
pen-guin diagrams; the Z boson mediates the transition with two flavour-changing Z couplings. Such a contribution is enhanced when there are both left-handed and right-handed couplings because of the chiral enhancement of the hadronic matrix elements. An important point is that since the left-handed coupling is already present in the SM, the right-handed coupling must be constrained even without NP contributions to the left-handed one. Such interfer-ence contributions between the NP and the SM have been overlooked in the literature. References [35–37] have re-visited the modifiedZ-coupling scenario including the in-terference contributions, and found the parameter regions allowed by the indirectCPviolation change significantly.
We find that similar to the previous section, the devia-tions ofB(K → πνν) from the SM values are determined by the necessary amount of the tuning in NP contributions toεK. We parametrize it byξ: A degree of the NP
pa-rameter tuning is represented by 1/ξ, e.g.,ξ =10 means
that the model parameters are tuned at the 10% level. The definition ofξis given in Ref. [36].
In Fig. 6, contours of the tuning parameterξare shown for the simplified scenarios: LHS (all NP effects appear as
left-handed), RHS (all NP effects appear as right-handed),
ImZS (NP effects are purely imaginary), and LRS
(left-right symmetric scenario) on the plane of the branching ra-tios ofK→πννwhich are normalized by their SM
predic-tions. We scanned the whole parameter space of the modi-fiedZ-coupling in each scenario, and selected the parame-ters whereε′K/εK is explained at the 1σlevel. The
experi-mental bounds fromεK,∆MK, andB(KL→µ+µ−) are
sat-isfied. In most of the allowed parameter regions,ξ=O(1)
is obtained. Thus, one does not require tight tunings in these simplified scenarios. In the figures,B(KL → π0νν)
is smaller than the SM value by more than 30%. On the other hand, B(K+ → π+νν) depends on the
scenar-ios. In LHS, we obtain 0 < B(K+ → π+νν)/B(K+ → π+νν)
SM < 1.8. In RHS,B(K+ → π+νν) is comparable
to or larger than the SM value, but cannot be twice as large. In ImZS, the branching ratios are perfectly corre-lated andB(K+ → π+νν) does not deviate from the SM
one. In LRS,B(KL→π0νν) does not exceed about a half
of the SM value. The more general situation is discussed in Ref. [36].
4 Discussion and conclusions
In this contribution, we introduced the current situation for theε′K/εKwithin the SM. The first lattice result and the
im-proved perturbative calculations have shown the discrep-ancy between the predicted value and the data. Several NP models can explain the discrepancy of ε′K/εK, and then
B(K→πνν) are predicted to deviate from the SM predic-tions. We have presented the correlations betweenε′K/εK,
0 5 10 15 20 25 30 35 40
)/SM
ν ν
+
π →
+
B(K
0 0.5 1 1.5 2
)/SM
ν
ν
0π→
L
B
(K
0 0.5 1 1.5 2
LHS
RHS SM
Grossman-Nir bound
ImZS 1
2
2 5
5 5
2 5
0 5 10 15 20 25 30 35 40
)/SM ν ν
+
π →
+
B(K
0 0.5 1 1.5 2
)/SM
ν
ν
0π→
L
B
(K
0 0.5 1 1.5 2
1
2 5 5 2 LRS SM
Grossman-Nir bound
Figure 6. Contours of the tuning parameterξare shown in the
simplified modifiedZ-coupling scenarios: LHS, RHS, and ImZS (toppanel) and LRS (bottom). In the colored regions,ε′K/εKis explained at 1σ, and the experimental bounds ofεK,∆MK, and
B(KL→µ+µ−) are satisfied. The right region of the blue dashed line is allowed by the measurement ofB(K+→π+νν) at 1σ. The NP scale is set to beµ=1 TeV.
B(KL→π0νν), andB(K+→π+νν) in the box dominated
scenario and the Z-penguin dominated one. It is shown that the constraint fromεKproduces different correlations
between two NP scenarios. In the future, measurements of B(K → πνν) will be significantly improved. The NA62 experiment at CERN measuring B(K+ → π+νν) is
aim-ing to reach a precision of 10 % compared to the SM value already in 2018 [38]. In order to achieve 5% accuracy more time is needed. ConcerningKL → π0νν, the KOTO
experiment at J-PARC aims in a first step at measuring B(KL → π0νν) around the SM sensitivity. Furthermore,
the KOTO-step2 experiment will aim at 100 events for the SM branching ratio, implying a precision of 10 % of this measurement [39]. Therefore, we conclude that when the ε′K/εK discrepancy is explained by the NP
contribu-tion, NA62 experiment could probe whether a modifiedZ -coupling scenario is realized or not, and KOTO-step2
ex-periment can distinguish the box dominated scenario and the simplified modifiedZ-coupling scenario.
We should also comment onKS → µ+µ−, which
pro-ceeds via long-distanceCP-conserving P-wave and short-distance CP-violating S-wave processes. Since the de-cay rate is dominated by the former, whose uncertainty is large, the sensitivity to the short-distance contribu-tions is diminished. However, it is pointed out that the short-distance contribution is enhanced through an inter-ference between theKLandKS states in the neutral kaon
beam [40]. Therefore, one can also distinguish the NP scenarios using the correlation withKS → µ+µ−. Such a
correlation has been investigated in the box dominated sce-nario (with large tanβ) [41] and the modifiedZ-coupling scenario [35, 40].
Acknowledgment
I would like to thank Veronika Chobanova, Andreas Criv-ellin, Giancarlo D’Ambrosio, Motoi Endo, Toru Goto, Miriam Lucio Martinez, Diego Martinez Santos, Satoshi Mishima, Ulrich Nierste, Isabel Suarez Fernandez, Paul Tremper, Daiki Ueda, and Kei Yamamoto for fruitful col-laborations on the presented work. I also want to warmly thank the organizers of FCCP 2017 for inviting and giv-ing me the opportunity to present these results in a great conference.
References
[1] A. J. Buras and J. M. Gérard, Nucl. Phys. B264, 371 (1986); A. J. Buras, J. M. Gérard and W. A. Bardeen, Eur. Phys. J. C74, 2871 (2014) [arXiv:1401.1385 [hep-ph]].
[2] T. Blum et al., Phys. Rev. Lett. 108, 141601 (2012) [arXiv:1111.1699 [hep-lat]]; T. Blum et al., Phys. Rev. D86, 074513 (2012) [arXiv:1206.5142 [hep-lat]]; T. Blumet al., Phys. Rev. D91, no. 7, 074502 (2015) [arXiv:1502.00263 [hep-lat]];
[3] Z. Bai et al. [RBC and UKQCD Collabora-tions], Phys. Rev. Lett. 115, no. 21, 212001 (2015) [arXiv:1505.07863 [hep-lat]].
[4] S. Bertolini, J. O. Eeg, M. Fabbrichesi and E. I. Lashin, Nucl. Phys. B 514, 93 (1998) [hep-ph/9706260].
[5] E. Pallante and A. Pich, Nucl. Phys. B592, 294 (2001) [hep-ph/0007208]; E. Pallante, A. Pich and I. Scimemi,
Nucl. Phys. B617, 441 (2001) [hep-ph/0105011].
[6] T. Hambye, S. Peris and E. de Rafael, JHEP0305, 027 (2003) [hep-ph/0305104].
[7] A. J. Buras and J. M. Gérard, JHEP1512, 008 (2015) [arXiv:1507.06326 [hep-ph]].
[8] A. J. Buras and J. M. Gerard, Eur. Phys. J. C77, no. 1, 10 (2017) [arXiv:1603.05686 [hep-ph]].
[9] A. J. Buras, M. Gorbahn, S. Jäger and M. Jamin, JHEP 1511, 202 (2015) [arXiv:1507.06345 [hep-ph]]. [10] T. Kitahara, U. Nierste and P. Tremper, JHEP1612,
078 (2016) [arXiv:1607.06727 [hep-ph]].
[11] L. K. Gibbons et al., Phys. Rev. Lett. 70, 1203 (1993).
[12] G. D. Barret al.[NA31 Collaboration], Phys. Lett. B 317, 233 (1993).
[13] V. Fantiet al. [NA48 Collaboration], Phys. Lett. B 465, 335 (1999) [hep-ex/9909022]; J. R. Batley et al.
[NA48 Collaboration], Phys. Lett. B 544, 97 (2002) [hep-ex/0208009].
[14] A. Alavi-Harati et al. [KTeV Collaboration], Phys. Rev. Lett. 83, 22 (1999) [hep-ex/9905060];
E. Abouzaidet al. [KTeV Collaboration], Phys. Rev. D83, 092001 (2011) [arXiv:1011.0127 [hep-ex]]. [15] C. Patrignani et al. [Particle Data Group], Chin.
Phys. C40, no. 10, 100001 (2016).
[16] H. Gisbert and A. Pich, arXiv:1712.06147 [hep-ph]. [17] V. Cirigliano, A. Pich, G. Ecker and H. Neufeld,
Phys. Rev. Lett.91, 162001 (2003) [hep-ph/0307030].
[18] L. Lellouch and M. Luscher, Commun. Math. Phys. 219, 31 (2001) [hep-lat/0003023].
[19] G. Colangelo, J. Gasser and H. Leutwyler, Nucl. Phys. B603, 125 (2001) [hep-ph/0103088].
[20] R. Garcia-Martin, R. Kaminski, J. R. Pelaez, J. Ruiz de Elvira and F. J. Yndurain, Phys. Rev. D83, 074004 (2011) [arXiv:1102.2183 [hep-ph]].
[21] X. Feng, arXiv:1711.05648 [hep-lat].
[22] C. Lehner, E. Lunghi and A. Soni, Phys. Lett. B759, 82 (2016) [arXiv:1508.01801 [hep-ph]].
[23] T. Kitahara, U. Nierste and P. Tremper, Phys. Rev. Lett. 117, no. 9, 091802 (2016) [arXiv:1604.07400 [hep-ph]].
[24] A. L. Kagan and M. Neubert, Phys. Rev. Lett. 83, 4929 (1999) [hep-ph/9908404]; Y. Grossman, M.
Neu-bert and A. L. Kagan, JHEP 9910, 029 (1999) [hep-ph/9909297].
[25] A. Crivellin and M. Davidkov, Phys. Rev. D 81, 095004 (2010) [arXiv:1002.2653 [hep-ph]].
[26] A. J. Buras, M. Jamin, M. E. Lautenbacher and P. H. Weisz, Nucl. Phys. B 400, 37 (1993) [hep-ph/9211304]; A. J. Buras, M. Jamin and M. E.
Laut-enbacher, Nucl. Phys. B 400, 75 (1993) [hep-ph/9211321]; M. Ciuchini, E. Franco, G. Martinelli
and L. Reina, Nucl. Phys. B 415, 403 (1994) [hep-ph/9304257].
[27] J. A. Baileyet al.[SWME Collaboration], Phys. Rev. D92, no. 3, 034510 (2015) [arXiv:1503.05388 [hep-lat]].
[28] G. Aad et al. [ATLAS Collaboration], JHEP 1510 (2015) 054 [arXiv:1507.05525 [hep-ex]].
[29] The ATLAS collaboration [ATLAS Collaboration], ATLAS-CONF-2016-078.
[30] CMS Collaboration [CMS Collaboration], CMS-PAS-SUS-16-015.
[31] A. Crivellin, G. D’Ambrosio, T. Kitahara and U. Nierste, Phys. Rev. D 96, no. 1, 015023 (2017) [arXiv:1703.05786 [hep-ph]].
A. J. Buras, D. Buttazzo and R. Knegjens, JHEP1511, 166 (2015) [arXiv:1507.08672 [hep-ph]]; A. J. Buras, JHEP1604, 071 (2016) [arXiv:1601.00005 [hep-ph]]. [33] M. Tanimoto and K. Yamamoto, PTEP2016, no. 12,
123B02 (2016) [arXiv:1603.07960 [hep-ph]].
[34] M. Endo, S. Mishima, D. Ueda and K. Yamamoto, Phys. Lett. B762, 493 (2016) [arXiv:1608.01444 [hep-ph]].
[35] M. Endo, T. Goto, T. Kitahara, S. Mishima, D. Ueda and K. Yamamoto, arXiv:1712.04959 [hep-ph]. [36] M. Endo, T. Kitahara, S. Mishima and K. Yamamoto,
Phys. Lett. B771, 37 (2017) [arXiv:1612.08839 [hep-ph]].
[37] C. Bobeth, A. J. Buras, A. Celis and M. Jung, JHEP 1707, 124 (2017) [arXiv:1703.04753 [hep-ph]].
[38] E. Cortina Gil et al. [NA62 Collaboration], JINST12, no. 05, P05025 (2017) [arXiv:1703.08501 [physics.ins-det]].
[39] Talk by H. Nanjo in International workshop on physics at the extended hadron experimental facility
of J-PARC, KEK Tokai, Japan, 5-6 March 2016; Talk
by G. Ruggiero in EPS Conference on High Energy Physics, Venice, Italy, 5-12 July 2017.
[40] G. D’Ambrosio and T. Kitahara, Phys. Rev. Lett. 119, no. 20, 201802 (2017) [arXiv:1707.06999 [hep-ph]].

![Figure 5 shows the correlations betweenthe fine-tuning parameter is defined in Ref. [31].currentis resolved at 1gion](https://thumb-us.123doks.com/thumbv2/123dok_us/8047417.1340465/5.595.307.526.80.521/figure-correlations-betweenthe-tuning-parameter-dened-currentis-resolved.webp)