Available online: https://edupediapublications.org/journals/index.php/IJR/ P a g e | 474
Analytical Investigation of Material Removal Rate during WEDM
and the Effect of Process Parameters on It
E. SAIKISHORE M.Tech., - CAD/CAM
Sree Dattha Institute Of Engineering And Science college
Shariguda,Ibrahimpatnam, Ranga Reddy District
RAHUL Assistant Professor,
Department of Mechanical Engineering Sree Dattha Institute Of Engineering And
Science college
Shariguda,Ibrahimpatnam, Ranga Reddy District
Abstract
For any machining process and, particularly, in process related to Wire
Electrical Discharge Machining
(WEDM) the right selection of machining conditions is one of the most important aspects to be taken into consideration. WEDM is capable of machining of geometrically complex shapes or material components having higher hardness, that are precise and very difficult-to-machine such as composites, super alloys heat treated tool steels, ceramics, heat resistant steels, carbides etc. These hard material components are widely used in aerospace industries, die and mold making industries, aeronautics and nuclear industries. This investigation discusses the effects of machining parameters like pulse on time, pulse off time and voltage on the material removal rate of wire electric discharge machining. For this investigation, stainless steel (SS 304) has been used as a work piece and a brass wire and a diffused wire having 0.25 mm diameter is used as tool electrodes. The design of experiment is based on Taguchi Design approach L9 orthogonal array. Further, the analysis of variance (ANOVA) is used to analyze the results obtained from Taguchi design approach. The analysis of results indicates that diffused wire
gives more material removal rate (MRR) as compare to the brass wire. The results show that, the pulse on time and servo voltage has the highest influence on material removal rate (MRR). As the pulse on time increases, the material removal rate increases. It is also concludes that, with the increase of pulse off time and servo voltage, the material removal rate decreases.
INTRODUCTION
Available online: https://edupediapublications.org/journals/index.php/IJR/ P a g e | 475
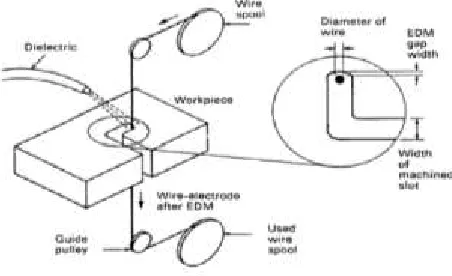
drilled in the material, and then the wire can be fed through the hole to complete the machining. In a Wire-Cut EDM, the wire electrode is held vertically by two wire guides located separately above and below the work piece with the wire traveling longitudinally during machining. The work piece is usually mounted on an x-y table.
Fig. 1 Setup of Wire-Cut EDM
The Wire-Cut EDM machine tool comprises of a main worktable (X-Y) on which the work piece is clamped; an auxiliary table (U-V) and wire drive mechanism. The main table moves along X and Y-axis and it is driven by the D.C servo motors. The travelling wire is continuously fed from wire feed spool and collected on take up spool which moves though the work piece and is supported under tension between a pair of wire guides located at the opposite sides of the work piece. The lower wire guide is stationary whereas the upper wire guide, supported by the U-V table, can be displaced transversely along U and V-axis with respect to lower wire guide. The upper wire guide can also be positioned vertically along Z-axis by moving the quill. A series of electrical pulses generated by the pulse generator unit is applied between the work piece
and the travelling wire electrode, to cause the electro erosion of the work piece material. As the process proceeds, the X-Y controller displaces the worktable carrying the work piece transversely along a predetermined path programmed in the controller.
While the machining operation is continuous, the machining zone is continuously flushed with water passing through the nozzle on both sides of work piece. Since water is used as a dielectric medium, it is very important that water does not ionize. Therefore, in order to prevent the ionization of water, an ion exchange resin is used in the dielectric distribution system to maintain the conductivity of water.
Figure 2: Wire-Cut EDM machine tool
Available online: https://edupediapublications.org/journals/index.php/IJR/ P a g e | 476
techniques like turning and milling due to its high hardness and strength levels.
Wire electrical discharge machining a type of unconventional machining process, is employed to accomplish the objective. WEDM plays significant role in cutting the electrically conductive materials to produce intricate profiles and complex shapes. The material removal takes place due to melting and evaporation of workpiece because of the heat produced by discharges. The wire traverse is regulated by numerically controlled system to accomplish the desired accuracy of components.
The most significant performance measures of WEDM are material removal rate (MRR) and surface roughness (Ra) of workpiece. Spark gap voltage, discharge current, pulse on-time, pulse off-time and dielectric flushing conditions are the machining
parameters that influence the
performance measures. Tosun et al. investigated the effect of WEDM machining parameters on performance characteristics, i.e MRR, kerf width and Ra. An optimum combination of process parameters was derived for large MRR and small Ra by using analysis of variance (ANOVA).
Poros et al. made an attempt to develop a model to correlate the thermal properties of material and the efficiency of machining. Buckingham pi theorem was employed to establish the relationship between the variables used in the study. Tzeng et al. studied the influences of cutting speed, depth of cut and feed rate on surface roughness using the Taguchi technique and grey relational analysis. In this study, an
orthogonal array was applied to plan the experiments for optimizing the cutting operations with multiple response measures. Chiang et al. carried out grey relational analysis to optimize the wire-EDM process with multiresponse characteristics such as MRR and Ra.
The optimum process parameters were selected from the response graph obtained by grey relational grade. Kumar et al. employed a grey relational methodology to optimize the input parameters of EDM, i.e., duty factor, pulse on-time and peak current to maximize MRR. The optimum process
parameters were validated by
confirmation experiments. Wang et al. explored the possibility of removing a recast layer using etching by means of EDM. An L9 orthogonal array was selected to design the experiments for
attaining the optimum process
parameters. Somasekhar et al. presented the modelling and optimization of micro-EDM using back propagation and genetic algorithms.
The neural network model has been established and simulated using MATLAB. Lin et al. attempted to
improve the multiple response
characteristics using Taguchi technique with grey relational analysis by optimizing the process parameters of EDM. Patel et al. developed a surface roughness prediction model for electric discharge machining of Al2O3/SiC/TiC
ceramic composite. This model
Available online: https://edupediapublications.org/journals/index.php/IJR/ P a g e | 477
parameters have been optimized for each performance measure by using Taguchi method.
The purpose of the present study is to examine the effects of machining parameters on material removal rate (MRR) and surface roughness (Ra) of hot-pressed boron carbide. The material removal rate (MRR) can be considered as the degree of production whereas surface roughness (Ra) represents the measure of surface quality. Based on the literature survey, several pilot experiments have been performed to select the process parameters influencing on performance characteristics.
The chosen machining variables are pulse on-time, pulse off-time, peak current and spark voltage. The Taguchi technique is a dominant experimental planning tool that uses an efficient and orderly approach for obtaining the
optimum process variables. An
appropriate design of experiments (DOE) is selected to perform more precise and accurate experiments. In the present research, an L16 Taguchi standard orthogonal array was selected for the design of experiments. Confirmation experiments were then conducted based on the Taguchi analysis. The surfaces of machined samples were examined using scanning electron microscopy (SEM). The influences of machining parameters on mechanism of MRR and Ra were described.
MATERIAL & METHODS
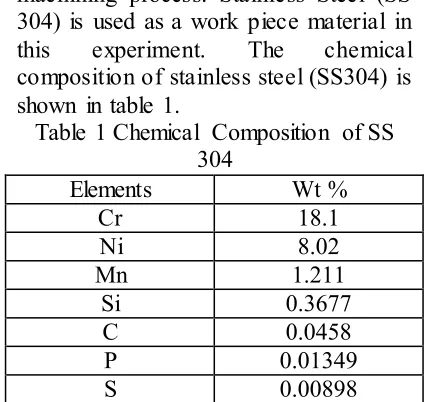
Work Piece MaterialThe Wire Electric Discharge Machining is used to machine hard materials like
steel, carbides and composites. The work piece material should be electrically conductive for an Electrical discharge machining process. Stainless Steel (SS 304) is used as a work piece material in
this experiment. The chemical
composition of stainless steel (SS304) is shown in table 1.
Table 1 Chemical Composition of SS 304
Elements Wt %
Cr 18.1
Ni 8.02
Mn 1.211
Si 0.3677
C 0.0458
P 0.01349
S 0.00898
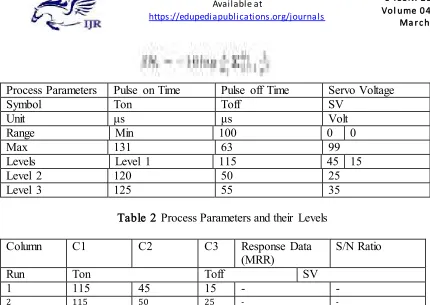
Process Parameters and Design of Experiment
Available online: https://edupediapublications.org/journals/index.php/IJR/ P a g e | 478
Process Parameters Pulse on Time Pulse off Time Servo Voltage
Symbol Ton Toff SV
Unit μs μs Volt
Range Min 100 0 0
Max 131 63 99
Levels Level 1 115 45 15
Level 2 120 50 25
Level 3 125 55 35
Table 2 Process Parameters and their Levels
Column C1 C2 C3 Response Data
(MRR) S/N Ratio
Run Ton Toff SV
1 115 45 15 - -
2 115 50 25 - -
Table 3: L9 Orthogonal Array in Terms of Actual Parameters
Conduct of Experiment
Experimentally, a brass wire and a diffused wire are used as electrode. Stainless steel (SS 304) is used as a work piece material. The experiment is performed on Sprintcut Electronica Wire-Cut EDM machine. De-ionized water is used as a dielectric fluid with external pressure flushing. The process parameters used for experiment are pulse
on time (Ton), pulse off time (Toff) and servo voltage (SV).
The machining performance is evaluated in term of material removal rate (MRR). In this experiment peak current, flushing pressure, wire feed and wire tension are kept constant 230 Amp, 0.2kgf/cm2, 8 m/min and 9 units respectively. The layout of design of experiment is based on Taguchi L9 orthogonal array.
Run Pulse on
Time (μs) Pulse off Time (μs) Servo Voltage (V) MRR (mm3/min) S/N Ratio Using Brass wire Using Diffused
Wire
Using Brass wire Using Diffused Wire
1 115 45 15 7.63 7.85 17.650 17.897
2 115 50 25 5.75 5.96 15.193 15.505
3 115 55 35 4.37 4.57 12.809 13.198
4 120 45 25 9.47 9.61 19.527 19.655
5 120 50 35 7.39 7.60 17.373 17.616
Available online: https://edupediapublications.org/journals/index.php/IJR/ P a g e | 479
7 125 45 35 10.97 11.18 20.804 20.968
8 125 50 15 9.75 9.96 19.780 19.965
9 125 55 25 8.96 9.17 19.046 19.247
Table 4: Observation Table The experiments were performed using a
CNC ULTRACUT WEDM (maker: Electronica Machine Tools Ltd). The wire cut electric discharge machine consists of a machine tool, a CNC pulse generator and a dielectric fluid supply unit. The tool consists of a main worktable, an auxiliary table and a wire drive mechanism. CuZn37 brass wire with 0.25 mm in diameter was employed in the present trials. Wire travels through the workpiece from upper and lower wire guides. In wire-cut EDM process the spark is generated between continuous travelling wire and workpiece.
Hot-pressed boron carbide blocks (100 mm × 100 mm × 5 mm thickness) were used. The strength of the material is 410 GPa, its hardness is 31 GPa, and the Young's modulus is 460 GPa. Machining performance was evaluated by MRR and SR.
The MRR was determined by equation (1)
MRR (mm3/min) = Vc × b × h
where Vc is the cutting rate; b is width of the cut; and h is the depth of the job (mm).
The surface roughness, usually expressed as Ra value in microns, was obtained by Taylor Hobson Surtronic 25 roughness checker.
Taguchi method: planning of
experiments
To study the effects of machining
parameters on the performance
characteristics (MRR and Ra) under the optimal machining parameters, a specifically designed experimental procedure is required. Based on the preliminary investigations, the input parameters chosen were pulse on-time (TON), peak current (IP) and spark voltage (SV). The working range of input parameters and the levels.
Table 5: Input process parameters and their levels.
Parameters Level 1 Level 2 Level 3 Level 4
TON/μs 0.65 0.7 0.75 0.8
IP/A 12 14 16 18
SV/V 10 15 20 25
In this study, the Taguchi method, a powerful tool for parameter design of performance characteristics, was used to optimize the machining parameters for
Available online: https://edupediapublications.org/journals/index.php/IJR/ P a g e | 480
(signal/noise) ratio to measure the quality and (ii) orthogonal array to accommodate many factors affecting simultaneously to evaluate the machining performances. According to Taguchi quality design concept, an L16
orthogonal array table with 16 rows was chosen for the experiments. The experimental observations are further transformed into a signal-to-noise (S/N) ratio by using ANOVA.
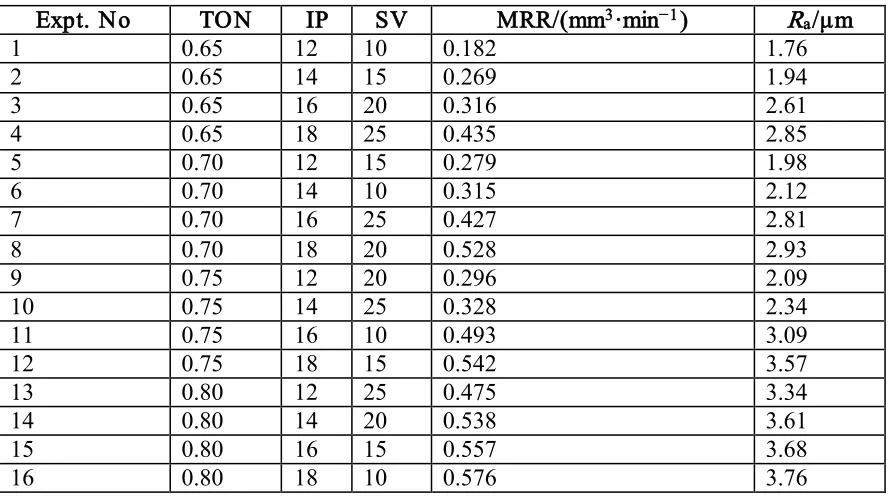
Table 6: Experimental design using L16 orthogonal array.
Expt. No TON IP SV MRR/(mm3·min−1) Ra/μm
1 0.65 12 10 0.182 1.76
2 0.65 14 15 0.269 1.94
3 0.65 16 20 0.316 2.61
4 0.65 18 25 0.435 2.85
5 0.70 12 15 0.279 1.98
6 0.70 14 10 0.315 2.12
7 0.70 16 25 0.427 2.81
8 0.70 18 20 0.528 2.93
9 0.75 12 20 0.296 2.09
10 0.75 14 25 0.328 2.34
11 0.75 16 10 0.493 3.09
12 0.75 18 15 0.542 3.57
13 0.80 12 25 0.475 3.34
14 0.80 14 20 0.538 3.61
15 0.80 16 15 0.557 3.68
16 0.80 18 10 0.576 3.76
The analysis of variance (ANOVA) of S/N data is carried out to identify the significant variables and quantify their effects on the response characteristics. In the present study, all designs, plots and analysis were carried out using Minitab statistical software. There are several S/N ratios available depending on the type of characteristics. The characteristic of which higher value represents better machining performance, such as MRR, is called ‘higher is better, HB’.
Available online: https://edupediapublications.org/journals/index.php/IJR/ P a g e | 481
Table 7: (a). Analysis of variance for MRR.
Source DF Seq SS Adj MS F P
TON 3 59.62 19.884 13.63 0.004
IP 3 57.98 19.328 13.25 0.005
SV 3 3.644 1.215 0.83 0.523
Residual error 6 8.754 1.459
Total 15 130.033
Table 7: (b). Analysis of Variance for Surface roughness.
Source DF Seq SS Adj MS F P
TON 3 38.463 12.82 17.05 0.002
IP 3 29.26 9.753 12.97 0.005
SV 3 1.465 0.488 0.65 0.612
Residual error 6 4.513 0.752
Total 15 73.701
ARTIFICIAL NEURAL NETWORK MODEL
Since the objective is to evolve a model that relates selected inputs with outputs, so, the back-propagation network (BPN) constitutes an excellent tool due to its universal approximation capabilities. The BPN is a multiple-layer network with an input layer, output layer, and some hidden layers between the input and output layers. Before practical application, the network has to be trained so that the free parameters or connection weights are determined, and the mapping between inputs and outputs is accomplished. The training method is called back-propagation, a supervised learning technique, which generally involves two phases through different layers of the network; a forward phase and a backward phase. In the forward phase, input vectors are presented and propagated forward to compute the output for each neuron. During this phase, synaptic weights, which are all randomly set to begin with, are fixed and the mean square error (MSE) of all of
the patterns in the training set is calculated.
The backward phase is an iterative error reduction performed in the backward direction from the output layer to the input layer. Usually, the gradient descent method, adding a momentum term, is used to minimize the error, MSE, as fast as possible. These two phases are iterated untilthe weight factors stabilize their values and the mean square error is at a minimum or an acceptably small
value. The advantage of Back
propagation network is that it provides a computationally efficient method for changing the weights in a feed forward network, with differentiable activation function units, to learn a training set of input-output examples.
Available online: https://edupediapublications.org/journals/index.php/IJR/ P a g e | 482
all, 20 such data sets were used, of which, 18 data sets were selected for training purpose and remaining 2 data sets were used for testing the predictive accuracy of the network model.
CHAPTER - 4
RESULTS AND
DISCUSSION
RESULTS:From the observation table, it is clears that the diffused wire gives more material removal rate as compared to brass wire. The response tables of S/N ratio for MRR using brass wire and diffused wire respectively. The delta values and ranks for pulse on time, pulse off time and servo voltage are 4.66, 2.56, 1.63 and 1, 2 and 3 respectively, as shown in response table 4.2 for S/N ratio (MRR) using brass wire. Similarly from table 4.3 i.e. the response table for S/N ratio (MRR) using diffused wire, the delta values and ranks for input parameters viz. pulse on time, pulse off time and servo voltage are 4.53, 2.48 and 1.58 and 1, 2 and 3 respectively. From these tables it is evident that the parameter having highest delta value gets highest rank. The pulse on time gets rank 1 followed by pulse off time and servo voltage. The rank shows the relative importance of each input factor to the response. The ranks and delta values indicates that the pulse on time (Ton) has the highest impact on the material removal rate (MRR) followed by the pulse off time and servo voltage.
Table 5: Response Table for S/N Ratio using Brass Wire
Level Ton Toff SV
1 15.22 19.33 18.62
2 18.44 17.45 17.92
Delta 4.66 2.56 1.63
Rank 1 2 3
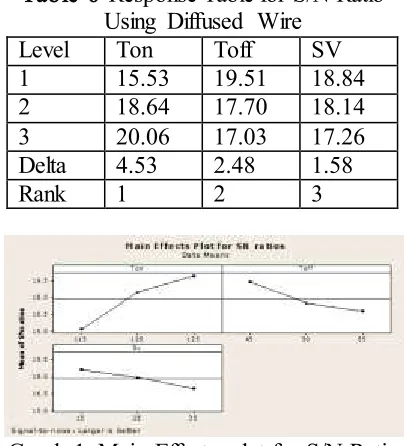
During the process of Wire-Cut EDM, the effect of various input parameter like pulse on time, pulse off time and servo voltage has significant effect on MRR as shown in main effect plot for S/N ratio of MRR. These graphs clearly show that as the pulse on time increases, the material removal rate also increases. On the other hand, as the pulse off time increases, the material removal rate decreases.
Table 6 Response Table for S/N Ratio Using Diffused Wire
Level Ton Toff SV
1 15.53 19.51 18.84
2 18.64 17.70 18.14
3 20.06 17.03 17.26
Delta 4.53 2.48 1.58
Rank 1 2 3
Graph 1: Main Effects plot for S/N Ratio using Brass Wire
Available online: https://edupediapublications.org/journals/index.php/IJR/ P a g e | 483
becomes more which leads to a higher material removal rate. With increase in spark gap set voltage the average discharge gap gets widened resulting into a lower material removal rate.
Graph 2: Main Effects plot for S/N Ratio using Diffused Wire
Source DF Seq SS Adj SS Adj MS F P %
contribut ion
Ton 2 34.1690 34.1690 17.0845 33.06 0.029 68.65
Toff 2 10.5728 10.5728 5.2864 10.23 0.089 21.24
Sv 2 3.9911 3.9911 1.9956 3.86 0.206 8.01
Error 2 1.0335 1.0335 0.5167
Total 8 49.7664
Table 7: Analysis of Variance for S/N Ratio using Brass Wire
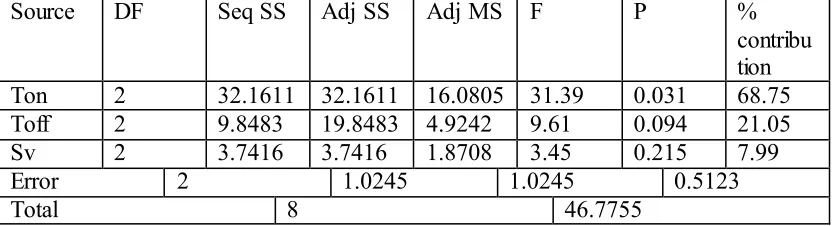
In an analysis of variance table, the P value indicates the most significant parameter. The factor whose P value is less than 0.05 will be most effective parameter. The analysis of variance tables for S/N ratio for both the wires shows that the servo voltage is not
important for influencing MRR and the value of pulse on time and pulse off time is most affected the MRR.
From these tables it is clearly definite that pulse on time is the most effective parameter for material removal rate followed by pulse off time and last one is the servo voltage.
Source DF Seq SS Adj SS Adj MS F P %
contribu tion
Ton 2 32.1611 32.1611 16.0805 31.39 0.031 68.75
Toff 2 9.8483 19.8483 4.9242 9.61 0.094 21.05
Sv 2 3.7416 3.7416 1.8708 3.45 0.215 7.99
Error 2 1.0245 1.0245 0.5123
Total 8 46.7755
Table 8: Analysis of Variance for S/N Ratio using Diffused Wire
The effect of peak current on MRR for various values of TON of 0.65 μs, 0.7 μs, 0.75 μs and 0.8 μs. It can be seen from Fig. 2 that the MRR value tends to increase with the higher TON and peak current levels. MRR is directly
Available online: https://edupediapublications.org/journals/index.php/IJR/ P a g e | 484
respectively, for achieving maximum MRR.
At low input power, a small amount of thermal energy is produced, and a significant portion of thermal energy is absorbed by the surroundings. This keeps available energy less. But the rise in input power generates an intense discharge, which impacts the surface of the workpiece and causes more molten material to be driven out of the crater. Flushing pressure (FP) has a significant influence on MRR.
Higher MRR can be achieved by supplying dielectric fluid at low velocity in the spark gap. This enhances an improvement in efficiency and thus increases MRR. Higher FP hinders the creation of ionized bridges across the gap, which would reduce spark energy and diminish MRR.
Graph 3: Effect of peak current on Material removal rate.
Increase in TON from 0.65 to 0.8 μs resulted in the formation of larger craters on the machined surface. This is reason for the increase in Ra with input power and TON. It is recommended to use TON of 0.65μs and IP of 12 A, respectively, for obtaining minimum Ra. The thermal power generates the high temperatures and causes the melting and
vaporization of the material. The demonstrate Ra in function of the parameters of TON and peak current. The data indicates that Ra decreases by decreasing TON and peak current values. The influence of spark voltage on response characteristics is shown in Fig. 5, for TON of 0.85 μs, TON of 32 μsec and peak current of 16 A.
The influence of spark voltage on surface roughness (Ra) is illustrated in Fig. 6. The plot exhibits a trend of increase from 1.26 to 2.35 μm. MRR is found to increase with spark voltage up to certain range and then it decreases at higher spark voltage due to widening of discharge gap. The depicts the effect of spark voltage on Ra. The Ra enhances with the raise in TON. With longer period of spark duration, the number of discharges increases, resulting in the wider craters. Hence, the surface finish will be rougher. When spark gap voltage is increased, the discharge gap gets widened, resulting in better surface accuracy due to stable machining. The influence of wire tension is not very significant.
Available online: https://edupediapublications.org/journals/index.php/IJR/ P a g e | 485
Graph 5: Effect of pulse on time on surface roughness The surfaces of machined samples were examined using scanning electron microscope (SEM). It is observed from SEM micrographs that the machined surfaces contain spherical modules, craters, pochmarks and microcracks. The TON (0.8 μs) and peak current (18 A) were observed as the most significant parameters affecting the surface properties. The increase in TON resulted in the formation of craters on the surface. These craters were developed due to a succession of sparks. Small portion of the melted material generated by the electric discharge was removed by the dielectric fluid.
The generation of spherical particles was noticed and it was attributed to the surface tension of molten material. Macro-ridges were also observed on the surface due to the protrusion of molten material. The demonstrates that fewer numbers of craters were formed at peak current (12 A) and TON (0.65 μs). Due to low peak current and TON, the machined surface is bombarded with fewer energy sparks. The crack formation is mainly attributed to the fast heating and cooling of the machined surface by dielectric fluid. The uneven
heating and cooling caused the development of stresses, which leads to crack formation.
ANALYSIS OF VARIANCE (ANOVA) TERMS AND NOTATIONS
In the analysis of variance many quantities such as degrees of freedom, sums of squares,
mean squares, etc., are computed and organized in a standard tabular format. C.F. = Correction factor n = Number of trials
r = Number of repetition e = Error
P = Percent contribution F = Variance ratio
T = Total of results f =
Degree of freedom
S = Sum of squares fe=
Degree of freedom of error
SS’= Pure sum of squares fT = Total degree of freedom
V= Mean squares (variance)
Degree of freedom: It is a measure of the amount of information that can be uniquely determined from a given set of data. DOF for data concerning a factor equals one less than the number of levels. Degree of freedom measures how much independents information is available to calculate each sum of square.
Available online: https://edupediapublications.org/journals/index.php/IJR/ P a g e | 486
term in the model measures the amount of variation in the response.
Adjusted Sum of Squares (Adj SS): The Adjusted sum of squares for term in the model measure the amount of additional variation in the response.
Adjusted Mean Square (Adj MS): The Adjusted Mean Square for a term is simply the Adjusted Sum of Squares divided by the Degree of Freedom. Variance Ratio: Variance ratio is the ratio of variance due to effect of a factor and variance due to the error term. This ratio is used to measure the significance of the factor under investigation with respect to the variance of all the factors included in the error term. The F value obtained in the analysis is compared with a value from standard F- tables for a given level of significance. When the computed F value is less than the value determined from the F tables at the selected level of significance, the factor does not contribute to the sum of squares within the confidence level. First the
formula finding for the Pure Sum of Square (SS’) is given below:
SS’= Seq SS – DF * (Adj MS Error) And the Percentage Contribution formula is given below:
Percentage contribution = (SS’/ Total Seq. SS) * 100%
PERCENTAGE CONTRIBUTION OF INPUT PARAMETERS TO OUTPUTS MRR, KERF WIDTH, AND SURFACE ROUGHNESS
ANOVA analysis carried out in Minitab 16 software and the results are shown here. If there is the p-value known as probability value is less than 0.05 (alpha value). It shows that all the parameters are significant. Statistically, F-test provides a decision at some confidence level as to whether these estimates are significantly different. Larger F-value indicates that the variation of the process parameter makes a big change on the performance characteristics.
ANOVA for MRR (Half Hard Brass Wire (0.25mm))
In this research work, ANOVA Table for MRR Half Hard Brass wire (0.25mm) is shown
Source DF Seq SS Adj SS Adj MS F P Percentage
Contribution
WF (m/min)
1 36.780 36.780 36.780 19.54 0.002 4.93
Ton (μs) 2 514.252 514.252 257.126 136.62 0.000 72.12
Toff (μs) 2 106.255 106.255 53.128 28.23 0.000 14.48
Ip (Amp) 2 16.506 16.506 8.253 4.39 0.052 1.80
Sv (Volt) 2 18.993 18.993 9.497 5.05 0.038 2.15
Error 8 15.056 15.056 1.882 4.52
Available online: https://edupediapublications.org/journals/index.php/IJR/ P a g e | 487
Calculation of SS’ and Percentage Contribution of MRR for Half Hard Brass wire.
1) Pure Sum of Square (SS’) - = For WF SS’:
= 36.780 – (1*1.882) = 36.780 – 1.882 = 34.898
For Ton SS’:
= 514.252 – (2*1.882) = 514.252 – 3.764 = 510.488
For Toff SS’:
= 106.255 – (2*1.882) = 106.255 – 3.764 = 102.491
For Ip SS’:
= 16.506 – (2*1.882) = 16.506 – 3.764 = 12.742
For SV SS’:
= 18.993 – (2*1.882) = 18.993 – 3.764 = 15.229
2) Percentage Contribution -
For WF Percentage Contribution: = 34.898/707.842* 100%
= 4.93 %
For Ton Percentage Contribution: = 510.488/707.842* 100% = 72.12 %
For Toff Percentage Contribution: = 102.491/707.842* 100% = 14.48 %
For Ip Percentage Contribution: = 12.742/707.842* 100%
= 1.80 %
For SV Percentage Contribution: = 15.229/707.842* 100% = 2.15 %
Above analysis shows the percentage contribution of individual process input parameters of WEDM on Pure Titanium for Material removal rate for Half Hard Brass Wire. The percentage contribution of Wire feed rate is 4.93%, Pulse on time is 72.12%, Pulse off time is 14.48%, Peak current is 1.80%, Servo voltage is 2.15%, and error is 4.52%. This error is due to machine vibration.
ANOVA for Kerf Width (Half Hard Brass wire (0.25mm))
In this research work, ANOVA Table for Kerf Width for Half Hard Brass wire (0.25mm) is shown
Source DF Seq SS Adj SS Adj MS F P Percentage
Contribution
WF (m/min)
1 0.0138889 0.0138889 0.0138889 35.74 0.000 39.60
Ton (μs) 2 0.0032444 0.0032444 0.0016222 4.17 0.057 7.23
Toff
(μs) 2 0.0087155 0.0087155 0.0043578 11.21 0.005 23.29
Ip
Available online: https://edupediapublications.org/journals/index.php/IJR/ P a g e | 488
Sv (Volt)
2 0.0019261 0.0019261 0.0009631 2.48 0.145 3.37
Error 8 0.0031089 0.0031089 0.0003886 19.38
Total 17 0.0340906 100
Calculation of SS’ and Percentage Contribution of Kerf Width for Half Hard Brass
wire.
1) Pure Sum of Square (SS’) - For WF SS’:
0.0138889 – (1*0.0003886) 0.0138889 – 0.0003886 0.013500
For Ton SS’:
0.0032444 – (2*0.0003886) 0.0032444 – 0.0007772 0.002467
For Toff SS’:
0.0087155 – (2*0.0003886)
0.0087155 – 0.0007772
0.007938 For Ip SS’:
0.0032068 – (2*0.0003886)
0.0032068 – 0.0007772
0.0024296 For SV SS’:
0.0019261 – (2*0.0003886)
0.0019261 – 0.0007772
0.0011489
Analysis of experimental results
Optimal parameter combination on the Pure Titanium work-piece for material removal rate, kerf width and surface roughness with different combinations of WEDM parameter of 18 experimental runs and used Half Hard Brass wire (0.25 mm) and Zn-Coated Brass Wire (0.25 mm).
Graph of Grey relational grades for Half Hard Brass Wire (0.25 mm)
According to performed experimental design, it is clearly observed from and the Grey relational grade graph which shows the change in the response when the factors go from one level to other that the WEDM parameters setting of experiment no. 12 has highest grey relation grade for Half Hard Brass wire. Thus, the twelve experiments gives the best multi- performance characteristics of the WEDM process among the 18 experiments.
Graph 7: Graph of Grey relational grades for Half Hard Brass Wire
Main effect plot for grey relational grade (Half Hard Brass Wire (0.25 mm)):
Available online: https://edupediapublications.org/journals/index.php/IJR/ P a g e | 489
The effect wire feed on grey relational grade. From this graph we conclude that at 8 m/min wire feed, grey relational grade is higher compare to 6 m/min. So, 8 m/min is optimum parameter level from two level of wire feed rate. the effect Pulse on time (Ton), on grey relational grade. From this graph we conclude that at 110 μs, grey relational grade is higher compare to 115 μs and 120 μs Pulse on time. So, 110 μs is optimum parameter level from three level of Pulse on time. The effect Pulse off time (Toff), on grey relational grade. From this graph we conclude that at 60 μs, grey relational grade is higher compare to 50 μs and 55 μs Pulse on time. So, 60 μs is optimum parameter level from three level of Pulse off time. The effect Peak current (Ip), on grey relational grade. From this graph we conclude that at 120 Amp, grey relational grade is higher compare to 140 Amp and 160 Amp Peak current. So, 120 Amp is optimum parameter level from three level of peak current. The effect Servo voltage (Sv), on grey relational grade. From this graph we conclude that at 20 V, grey relational grade is higher compare to 15 μs and 25 μs Servo voltage. So, 20 V is optimum parameter level from three level of Servo voltage.
Graph of Grey relational grades for Zn-Coated Brass Wire (0.25 mm)
Graph of Grey relational grades for Zn-Coated Brass Wire shown.
Graph 9: Graph of Grey relational grades for Zn-Coated Brass Wire
According to performed experimental design, it is clearly observed from the Grey relational grade graph which shows the change in the response when the factors go from one level to other that the WEDM parameters setting of experiment no. 12 has highest grey relation grade for Zn-Coated Brass wire. Thus, the twelve experiment gives the best multi- performance characteristics of the WEDM process among the 18 experiments.
Main effect plot for grey relational grade (Zn-Coated Brass Wire (0.25 mm)) The Main effect plot for grey relational grade for various input parameters for Zn-Coated Brass wire.
Graph 10: Graph of grey relational grade v/s Inputs Parameters
Available online: https://edupediapublications.org/journals/index.php/IJR/ P a g e | 490
at 8 m/min wire feed, grey relational grade is higher compare to 6 m/min. So, 8 m/min is optimum parameter level from two level of wire feed rate.The effect Pulse on time (Ton), on grey relational grade. From this graph we conclude that at 110 μs, grey relational grade is higher compare to 115 μs and 120 μs Pulse on time. So, 110 μs is optimum parameter level from three level of Pulse on time.
Confirmation test
The final step in the experiment is to do confirmation test. The purpose of the confirmation runs is to validate the conclusion drawn during the analysis phases. In addition, the confirmation tests need to be carried out in order to ensure that the theoretical predicted parameter combination for optimum results using the software is acceptable or not. The parameters used in the confirmation test are suggested by grey relational analysis.
The confirmation test with optimal process parameters for Half Hard Brass wire is performed on Wire cut EDM of Pure Titanium at levels A2 (8m/min wire feed rate), B1 (110 μs Pulse on time), C3 (60 μs Pulse off time), D1 (120 Amp Peak current), E2 (20 volts Servo voltage) and it gives material removal rate 13.8 mm2/min, kerf width of 0.1907 mm, and surface roughness of 2.04 μm with the error in material removal rate 2.89% and error in kerf width is 6.50% surface roughness is 5.88 %. The confirmation test with optimal process parameters for Zn-Coated Brass wire is performed on Wire cut EDM of Pure Titanium at levels A2 (8m/min wire feed rate), B1 (110 μs Pulse on time), C3 (60 μs Pulse off
time), D2 (140 Amp Peak current), E1 (15 volts Servo voltage) and it gives material removal rate 17.2 mm2/min, kerf width of 0.2843 mm, and surface roughness of 1.7849 μm with the error in material removal rate 5.23% and error in kerf width is 4.92% surface roughness is 4.386 %. In this one has done grey relational analysis based optimization of WEDM process parameters for Pure Titanium. Higher grey relational grade gives better multi performance characteristics and from the table of average grey relational grade, optimum parameter levels are obtained. With the next chapter, one has discussed the obtained results.
In the presented work, experiments are carried out on pure Titanium work-piece and used two wire like Half Hard Brass wire (0.25mm) and Zn-Coated Brass wire. The experiments are carried out for Material Removal Rate (MRR), Kerf width (Kw) and Surface Roughness (SR) with variables as wire feed, pulse on time, pulse off time, peak current and servo voltage. And finally result is described below.
Main effect plots for MRR (Half Hard Brass Wire (0.25mm))
Graph below shows the relation between all variable parameters like wire feed rate, pulse on time, pulse off time, peak current and servo voltage for Half Hard Brass wire for MRR. In the first graph shows the effect of wire feed rate on material removal rate. From it is clearly shown that with increase in wire feed rate, material removal rate increases.
Available online: https://edupediapublications.org/journals/index.php/IJR/ P a g e | 491
effect of pulse on time on material removal rate. From Figure 7.1, it is clearly shown that with increase in pulse on time material removal rate increases. When pulse on time increase from 110 to 115 μs, the material removal rate increase from 14.82 to 22.4567 mm2/min. When pulse on time again increases from 115 to 120 μs, material removal rate further increase from 22.4567 to 27.8483 mm2/min.
Graph 12: Graph of input parameters V/s. Material Removal Rate Main effect plots for Kerf Width (Half Hard Brass Wire (0.25mm))
Graph below shows the relation between all variable parameters like wire feed rate, pulse on time, pulse off time, peak current and servo voltage for Half Hard Brass wire for Kerf Width.
Graph 13: Graph of input parameters V/s. Kerf Width
Material Removal Rate (MRR) The MRR of Pure Titanium with Half Hard Brass wires under the same operational parameters for the Zinc-Coated Brass Wire.
Graph 14: MRR of Titanium for Both Wires
The MRR values for Pure Titanium machined with Zn-Coated Brass wire are higher than Pure Titanium machined with Half Hard Brass wire. The higher MRR is desirable. Good sparking properties of zinc layer on brass core result in improving cutting speed. In fact, the addition of zinc to brass wire leads to reduction in the wire melting point. The low melting temperature of wire improves the spark formation and decrease dielectric ionization time. Thus, the cutting rate increases and gets higher the MRR.
Kerf Width
Available online: https://edupediapublications.org/journals/index.php/IJR/ P a g e | 492
Good sparking properties of zinc layer on brass core result in improving sparking efficiency. The low melting temperature of wire improves the spark formation and decrease dielectric ionization time. Thus, the increasing erosion of material takes place. Hence, kerf width is higher in Zn-coated Brass wire.
Surface Roughness
The Zinc-Coated Brass wire can produce smoother surface in comparison to Half Hard Brass wire.
Graph 15: Surface Roughness of Titanium for Both Wires
The surface roughness values for Pure Titanium machined with Zn-Coated Brass wire are less than Pure Titanium machined with Half Hard Brass wire. The small surface toughness is desirable. The existence of zinc in coated brass wire provides higher tensile strength for 105 wire. The wire with high tensile strength is a good heat resistance in high temperature and
maintains straight under vibration and tension. Also, the uniform zinc layer on coated wire provides good discharge characteristics. A finer discharge can be
created with good discharge
characteristics and higher tensile strength. As a result, the quality of work piece surface will improve.
CONCLUSIONS
Available online: https://edupediapublications.org/journals/index.php/IJR/ P a g e | 493
was determined using ANOVA.
Discharge Current is the most significant parameter in influencing both MRR and TWR, followed by pulse on time and diameter of the tool. Feed forward-back propagation neural network of ANN for process modeling was developed to
evaluate the EDM performance
characteristics. The proposed NN models were verified with the two experimental data sets meant for testing. The result shows that the developed NN models can predict the MRR and TWR with reasonable accuracy.
REFERENCES:
1. Cyriac S., Prof. Sharos H. (2015), Optimization of wire-cut EDM Parameters of EN 24 Steel Using Taguchi’s Method. International Journal of Engineering Research and Technology, PP. 633-636.
2. Singh P., Chaudhary A. K., Singh T., Rana A.K. (2015), Experimental Investigation of Wire-Cut EDM to Optimize Dimensional Deviation of EN 8 Steel Through Taguchi’s Technique. International Research
Journal of Engineering and
Technology, PP. 1753-1757,
3. Sivaraman B., Eswaramoorthy C., Shanmugham E.P. (2015), Optimal Control Parameters of Machining in CNC Wire Cut EDM. International Journal of Applied Science and Engineering Research, PP. 102-121, 4. Nagaraja R., Chandrasekaran K.,
Shenbhgaraj S. (2015), Optimization of Parameter for Metal Matrix Composite in Wire-Cut EDM. International Journal of Engineering Science and Research Technology, PP. 570-574
5. Ramesh S., Natarajan N., Krishnaraj
V. (2014), Experimental
Investigation of Al6061/SiCp/B4Cp hybrid MMCs in Wire Electric Discharge Machine. Indian Journal of Engineering and Materials Science, PP. 409-417
6. Saini P.K., Verma M. (2014), Experimental Investigation of Wire-EDM Process Parameters on MRR of Ti-6al-4v Alloy. International Journal of Innovative Technology and Exploring Engineering, PP. 677-692
7. Saini P.K., Singh G., Singh T., Study the Effect of Process Variables on Cutting Velocity During wire-cut
EDM of Al/ZrO2-MMC.
International Journal of Engineering Science Invention Research & Development, PP. 564-573.
8. Mathew B., Benkim B.A., Babu J. (2014), Multi Process Parameter optimization of WIRE-CUT EDM on SS 304 Using Utility Approach.
International Conference on
Advances in Manufacturing and Materials Engineering, PP. 1863-1872
9. Lodhi B.K., Agarwal S. (2014),
Optimization of machining
parameters in WIRE-CUT EDM of AISI D3 Steel using Taguchi
Technique CIRP International
Conference on High Performance Cutting, PP. 194-199
10.Hemalatha K., Venkatachalapathy V.S.K., Alagumurthy N. (2014), Surface Integrity analysis in Wire-Cut Electric Discharge Machining of Al 6063/Al2O3 Metal Matrix
Composite through Response
Available online: https://edupediapublications.org/journals/index.php/IJR/ P a g e | 494
11.Garg S.K., Manna A., Jain A.
(2013), Multi-Objective
Optimization of Machining
Characteristics during Wire
Electrical Discharge Machining of Al/ZrO2 Particulate Reinforced Metal Matrix Composite. Journal of Engineering Research, PP. 145-160 12.N. Tosun, C. Cogun, G. Tosun, A
study on kerf and material removal rate in wire electrical discharge
machining based on Taguchi
method, J Mater Process Technol, 152 (2004), pp. 316–322
13.D. Poros, S. Zaborski, Semi-empirical model of efficiency of wire electrical discharge machining of hard-to-machine materials, J Material Process Technol, 209 (2009), pp. 1247–1253
14.C. Tzeng, Y. Lin, Y. Yang, M.C. Jeng, Optimization of turning
operations with multiple
performance characteristics using the taguchi method and grey relational analysis, J Material Process Technol, 209 (2009), pp. 2753–2759
15.K. Chiang, F. Chang, Optimization of the WEDM process of particle reinforced material with multiple performance characteristics using grey relational grade, J Material Process Technol, 180 (2006), pp. 96– 101
A. Kumar, S. Maheswari, S. Shrma, N. Beri, A study of multiobjective parametric optimization of silicon abrasive mixed electrical discharge machining of tool steel, Mater Manuf Process, 25 (2010), pp. 1041–1047 16.C.C. Wang, H.M. Chow, L.D. Yang,
C.T. Lu, Recast layer removal after electrical discharge machining via
taguchi analysis: a feasibility study, J Mater Process Technol, 209 (2009), pp. 4134–4140
17.K.P. Somashekhar, N.
Ramachandran, J. Mathew,
Optimization of material removal rate in micro-EDM using artificial
neural network and genetic
algorithms, Mater Manuf Process, 25 (2010), pp. 467–475
18.J.L. Lin, C.L. Lin, The use of the orthogonal array with grey relational analysis to optimize the electrical discharge machining process with multiple performance characteristics, Int J Mach Tools Manufac, 42 (2002), pp. 237–244
19.K.M. Patel, P.M. Pandey, P.V. Rao, Determination of an optimum parametric combination using a surface roughness prediction model for EDM of Al2O3/SiC/TiC ceramic composite, Mater Manuf Process, 24 (2009), pp. 675–682
20.Y. Lin, A. Wang, D. Wang, C. Chen,
Machining performance and
optimizing machining parameters of Al2O3-TiC ceramics using EDM based on the taguchi method, Mater Manuf Process, 24 (2009), pp. 667– 674
21.M.S. Phadke, Quality engineering using robust design, Prentice- Hall, New Jersey (1989), Electronica Machine Tools Ltd., Technology manual for Wire cut EDM - Elektra Sprintcut 734, 1–2.
22.M.C. Chua, M. Rahman, Y.S. Wong, H.T. Loh, Determination of optimal cutting conditions using design of experiments and optimization techniques Int J Mach Tools Manufac, 33 (1993), pp. 297–305 23.S.H. Lee, Optimization of cutting
Available online: https://edupediapublications.org/journals/index.php/IJR/ P a g e | 495
face milling operations Int J Prod Res, 41 (2003), pp. 497–511
24.S.S. Mahapatra, A. Patnaik, Optimization of wire electrical
discharge machining (WEDM)
process parameters using Taguchi method, J Adv Manuf Technol, 34 (2006), pp. 911–925
25.E. Kilickap, M. Huseyinoglu, Selection of optimum drilling parameters on burr height using response surface methodology and genetic algorithm in drilling of AISI 304 stainless steel Mater Manuf Process, 25 (2010), pp. 1068–1076 26.K. Palanikumar, Modeling and
analysis of delamination factor and surface roughness in drilling GFRP composites Mater Manuf Process, 25 (2010), pp. 1059.
27.Saini, P. K., & Verma, M. (2014). Experimental Investigation of Wire-EDM Process Parameters on MRR of Ti-6al-4v Alloy. International Journal of Innovative Technology and Exploring Engineering (IJITEE) ISSN, 2278-3075.
28.Singh, N., Kumar, P., & Goyal, K. (2014). Effect of Two Different Cryogenic Treated Wires in Wire Electrical Discharge Machining Of Aisi D3 Die Steel. Journal of Mechanical Engineering, 43(2), 54-60.
29.Bobbili, R., Madhu, V., & Gogia, A. K. (2015). Modelling and analysis of material removal rate and surface roughness in wire-cut EDM of armour materials. Engineering
Science and Technology, an
International Journal, 18(4), 664-668.
30.Goswami, A., & Kumar, J. (2014). Optimization in wire-cut EDM of
Nimonic-80A using Taguchi's
approach and utility concept.
Engineering Science and