Inferring web user sessions by
Clustering techniques
N. kalpana,G.V.S.N.R.V.Prasad
2 Computer Science & Engineering, Gudlavalleru Engineering College,Gudlavalleru (A.P), India.
Abstract—This paper focuses on the definition and identification of “Web user-sessions”, aggregations of several TCP connections generated by the same source host. The identification of a user-session is non trivial. Traditional approaches rely on threshold based mechanisms. However, these techniques are very sensitive to the value chosen for the threshold, which may be difficult to set correctly. By applying clustering techniques, we define a novel methodology to identify Web user-sessions without requiring an a priori definition of threshold values. We define a clustering based approach, we discuss pros and cons of this approach, and we apply it to real traffic traces. The proposed methodology is applied to artificially generated traces to evaluate its benefits against traditional threshold based approaches. We also analyze the characteristics of user-sessions extracted by the clustering methodology from real traces and study their statistical properties. Web user-sessions tend to be Poisson, but correlation may arise during periods of network/hosts anomalous behavior.
Index Terms
— Clustering methods, traffic measurement, web traffic characterization.I. INTRODUCTION
The study of telecommunication networks has been often based on traffic measurements, which are used to create traffic models and obtain performance estimates. While a lot of attention has been traditionally devoted to traffic characterization at the packet and transport layers (see for example [1]–[6]), few are the studies on traffic properties at the session/user layer [1], [7], [8]. This is due to the difficulty in defining the “session” concept itself [9], which depends on the considered application. Applications such as telnet or ssh
typically generate a single TCP connection per single user-session, whereas application layer protocols such as HTTP, IMAP/SMTP and X11 usually generate multiple TCP connections per user-session. Also, the generally accepted conjecture that such sessions follow a Poisson arrival process (see [10] for example) might have reduced the interest in the user-session process analysis.
User-session identification and characterization play an important role both in Internet traffic modeling and in the proper dimensioning of network resources. Besides increasing the knowledge of network traffic and user behavior, they yield workload models which may be exploited for both performance evaluation and dimensioning of network elements. Synthetic workload generators may be defined to assess network performance, e.g., benchmarking of server
farms, firewalls, proxies or NATs, as in [11], [12]. Similarly, user-session characterization allows researchers to build realistic scenarios when assessing the performance of a complex network via simulation. The main contributions of this paper are the following. First, we adapt classical clustering techniques to the described scenario, a nontrivial task that requires ingenuity to optimize the performance of user-session identification algorithms both in terms of speed and precision. By running a clustering algorithm, we avoid the need of setting a priori a threshold value, since clustering
techniques automatically adapt to the actual user behavior, as better explained later.
Furthermore, the algorithm does not require any training phase to properly run. We test the proposed methodology on artificially generated traces i) to ensure its ability to correctly identify a set of TCP connections belonging to the same user-session, ii) to assess the error performance of the proposed technique, and iii) to compare it with traditional threshold based mechanisms. Analytical results are presented to determine the performance of threshold based mechanisms. Finally, we run the algorithms over real traffic traces, to obtain statistical information on user-sessions, such as distributions of i) session duration, ii) amount of data transferred in a single session, iii) number of connections within a single session. A study of the inter-arrival times of Web user-sessions is also presented, from which it emerges that Web user-sessions tend to be Poisson, but correlation may arise due to network/ hosts anomalous behavior. Preliminary results on user-sessions statistical characterization were presented in [19].
II RELATED WORK
approach can be very effective, it does not scale well and, by leveraging on a specific application level protocol, can be hardly generalized. Furthermore, since the payload of all packets must be analyzed, this approach is not practical when, for security or privacy reasons, data payloads (and application layer headers) are not available. Thus, in this paper, TCP headers only are analyzed, limiting privacy issues and significantly reducing the probe complexity. Our methodology is rather general, and is much more robust than any threshold based approach.
III CLUSTERING TECHNIQUES
Our goal is to exploit this property to group connections (objects) to identify user-sessions (clusters) in an automatic fashion.
Let us consider a metric space X , named sampling space, and a set of samples A={x1,x2,….xn, xiεX} which have to be grouped (clustered) into ‘K’ subsets: we wish to find a partition C={c1,c2,…ck},such that UiCi=A and Ci∩Cj=Ф. The subsets in the partition are named clusters. Clusters
contain “similar” samples, whereas samples associated with different clusters should be “dissimilar”, the similarity being measured via the sample-to-sample and cluster-to-cluster distances.
IV. USING CLUSTERING TECHNIQUES ON THE MEASUREMENT DATA SET A. Clustering Algorithm Description
For a given host with IP address AP*, the set A(IP), whose elements are TCP connection opening times within a given time-frame, represents the samples of the clustering procedure:
Where ti(fid) is the connection opening time associated with sample i. To take the advantages and to avoid the drawbacks of both methodologies, we use a mix of them.
Thus, for each A (IP) the following three-step algorithm is run to identify user-sessions:
1) An initial clustering is obtained using a partitional algorithm;
2) A hierarchical agglomerative algorithm is used to aggregate the clusters and to obtain a good estimation of the final number of clusters Nc ;
3) a partitional algorithm is used to obtain a fine definition of the clusters Nc.
1) Initial Clustering Selection:
We start with a partitional algorithm with K clusters, with significantly K smaller than the total number of samples (a study on the impact of K is presented in Section VI). To efficiently position, in our uni-dimensional metric space, the
K representatives at procedure startup, we evaluate the distance between any two adjacent samples ti,ti+1..
According to the distance metric we take the farthest (K-1) couples and determine intervals. Let tI,inf ,tI,sup be the inferior and superior bounds of interval I; the centroid position of
each cluster is set to and the
partitional algorithm is run for up to 1000 iterations: therefore, K initial clusters are obtained. Each cluster C is represented by a small subset R(C) of samples;
R(C) <=2 is enough in our case, since the metric space is R. . Possible choices for the representative samples R(C) are: (i) the cluster centroid, which gives the name “centroid” (or K-means) to the procedure; (ii) the gth and(100-gth) percentiles, with g≠0; (iii) the gth and(100-gth) percentiles with g=0 , which yields the “single linkage” algorithm.
2) The Hierarchical Agglomerative Procedure:
In the second step, a hierarchical agglomerative algorithm is iteratively run, using only the representative samples {R(C)} to evaluate the distance between two clusters. Since the procedure starts with K initial clusters, the number of steps is bounded. At each step s, the hierarchical agglomerative procedure merges the two closest clusters; then, distances among clusters are recomputed. After K iterations, the process ends. The clustering quality indicator function γ(S) permits to select the best clustering among those determined in the iterative process. Indeed, at each step s, the clustering quality must be evaluated to determine if the optimal number of clusters has been found. Denote the jth cluster at step s as Cj(s) ; at eachstep, the procedure evaluates the function γ(S):
And is defined according to (1)
A sharp increase in the value of γ(S) is an indication that the merging procedure is artificially merging two clusters which are too far apart.
Which is computed for the index S that corresponds to the sharpest increase in γ(S) A typical evolution of the function
γ(S) is reported in Fig. 1, where the sharpest increase is clearly visible.
The plot refers to an artificial trace obtained as described in Section VI, and shows that for about 1000 steps the aggregation of the two closest clusters is clearly beneficial in terms of clustering quality. Then, the aggregation process merges two clusters which are too far apart, forcing a sudden increase in dmin(s) at step s, and, therefore, in γ(S). . When γ(S) reaches the maximum, the merging procedure is forcing an artificial aggregation of two distinct clusters. Other errors are induced later in the iterative aggregation process: although clearly visible in Fig. 1, they have a minor impact on the quality indicator function.
3) Final Clustering Creation: A partitional clustering
procedure is run over the original data set, which includes all samples using the optimal number of clusters Nc determined so far and the same choice of cluster representatives adopted in the first step. A fixed number of iterations is run to obtain a final refinement of the clustering definition. This phase is not strictly required, since at the end of the hierarchical agglomerative procedure a partition is already available. However, it produces clusters of real samples instead of
representatives (which may not be data points). Furthermore, the computational cost of this Phase is almost negligible compared to previous.
V PERFORMANCE ANALYSIS: ARTIFICIAL TRAFFIC
Let us consider a simple artificial trace in which a single user
generates sessions according to an ON/OFF process. The session ON and OFF periods are assumed exponentially distributed, with whereas ranges between 30 s and 2000 s. During each session ON period, a random number of TCP connections is generated, with mean inter-arrival time we consider both exponential and Pareto distributions.
Fig 2.clustering sensitivity to initial no clusters K for exponential connection interarrivals
Parameter Sensitivity
We initially evaluate the influence on performance results of the values chosen for i) the initial number of clusters K , used in the first clustering phase, and ii) the percentile g , used in the hierarchical agglomerative clustering phase. K is not a critical parameter, provided it is sufficiently larger than the number of sessions. In all the experiments, we choose K=10000 for simplicity as shown in fig 2.
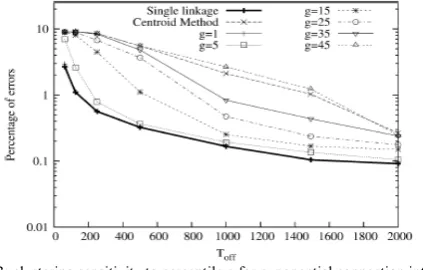
Fig. 3 shows instead the influence of the parameter, g that determines the value of the percentile used to select the cluster representatives in the cluster-to-cluster distance. We report the single linkage algorithm, which takes the two extreme values in the sample distribution as cluster representatives, The better accuracy of the single linkage algorithm is mainly due to the fact that gth percentile algorithms clusters real samples in the data set.
Fig 3: clustering sensitivity to percentile g for exponential connection inter-arrivals
VI PERFORMANCE ANALYSIS OF TRACE DATA SET
Web User-Session Characterization
Fig. 4 reports the PDF of the number of different server IP addresses in each session. Roughly 66% of session’s aggregate connections from a single server, and about 22% of sessions refer to only two servers. However, the PDF has a
Fig 4: PDF of no. of different server IP addresses per session. Complementary CDF in inset.
Fig 5: PDF of session length. Complementary CDF in inset.
Fig 5 shows the session duration PDF. The two different distributions reflect the effect of different definitions of Web user-sessions. Indeed, user-session duration may be defined as: the time between the first SYN segment of the first connection and (i) the last segment observed during the last connection tear-down, for “protocol sessions”; (ii) the last segment carrying payload of the last connection for “application sessions”. Therefore, using the notation introduced in Section IV, for a given session/cluster C, we can define the protocol session duration ∆Te and the application session duration as ∆Td as
The protocol session definition is relevant, for example, when either Web servers or client resources are considered, since TCP connections must be managed until the tear-down procedure is completed. On the contrary, the application session definition is relevant for users, since users are satisfied when all data are correctly sent/received. The protocol session distribution has obviously a larger support, but also biased peaks at 20 s, 60 s and 3600 s. They correspond to application layer timers imposed by Web browsers or HTTP servers which trigger the connection tear-down procedure after idle periods.
For example, Web servers may wait for a timer to expire (usually after 20 seconds) before closing the connection. Similarly, HTTP 1.1 and Persistent-HTTP 1.0 protocols use an additional timer, usually set to a multiple of 60 seconds.
Therefore, the protocol session duration highlights the bias induced by those timers. The bias disappears when application session duration is evaluated. Session duration distributions have a large support, showing large variability in user’s behavior. Indeed, there is a large percentage of very short sessions (that last less than few seconds), but also user activities that last for several hours. The tail of the complementary CDF shown in the inset highlights the heavy tailed distribution of session duration.
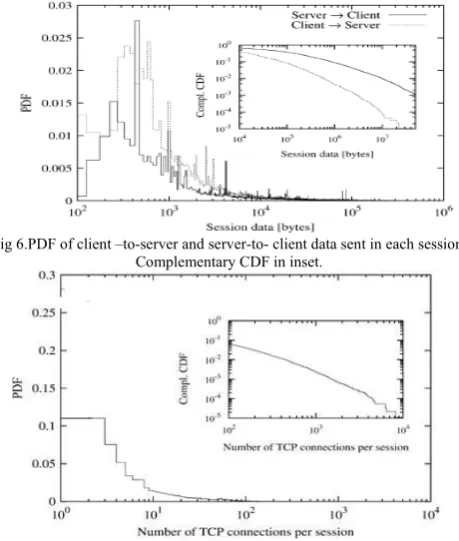
Fig 6 reports the PDF of the amount of data exchanged from client to server Dc (dashed lines) and server to client Ds (solid lines). For a given session/cluster C,
and
As expected, more data are transferred from servers to clients, and the distribution tail is heavier; the number of sessions transferring more than 10 Mbytes in the server-client direction is not negligible.
The initial part of both PDFs presents a number of peaks. Investigating further, we discovered that peaks are due to the identification of sessions which are not generated by users, but instead by automatic reload procedure imposed by the Web page being displayed. For example, news or trading on-line services impose periodic updates of pages, which force the client to automatically reload the pages. If the automatic reload is triggered periodically, the clustering algorithm may identify aseparate session for each connection, thus causing a bias in the session data distribution.
Fig 6.PDF of client –to-server and server-to- client data sent in each session. Complementary CDF in inset.
This is clearly evident also from Fig. 7, which reports the number of TCP connections per user-session. Indeed, more than 55% of sessions include only two TCP connections. Furthermore, most of the identified
Sessions are composed by very few connections (about 33% by 4 connections or less). This demonstrates that: i) the client is usually able to
obtain all the required data using few TCP connections, ii) the number of required external objects is limited and iii) the time spent by the users over one Web page is large enough to define each Web transaction as a session. The CDF, reported in the inset, shows a linear trend, highlighting that the distribution has a heavy-tail.
Session Inter-Arrivals Statistical Properties
Finally, statistical properties of session inter-arrival times are investigated. A session arrival trace is obtained by superimposing in time all identified sessions during the same time period.
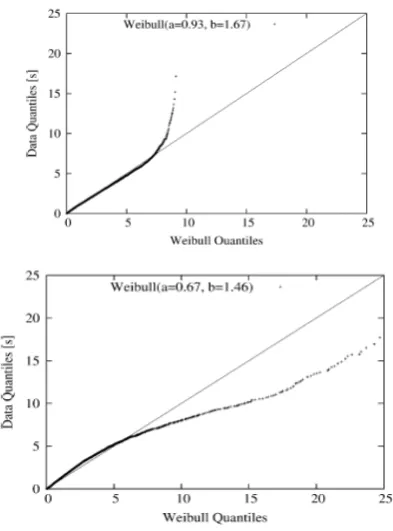
Fig. 8 reports the Q-Q plot of the session inter-arrival distribution with respect to the best fitted Weibull distribution over the same data set. The choice of the Weibull model stems from the fact that connection arrivals fit quite well a Weibull distribution with a heavy-tail [26]. The Weibull distribution is characterized by the so called “shape” and “scale” parameters. When the shape parameter, named in this paper, is set to 1, the Weibull distribution degenerates into an exponential distribution. When ‘a’ is smaller than 1, the tail of the distribution is heavy, while for values of larger than 1 the shape of the distribution assumes a dumbbell form.
Fig 8 fit of user-session inter-arrivals to a Weibull distribution: normal working day in the top plot, and during a worm attack on the bottom plot.
VII CONCLUSION
Clustering techniques were applied to a large set of real Internet traffic traces to identify Web user-sessions. A novel clustering methodology was proposed and compared with the classical threshold based scheme. The effectiveness and robustness of the proposed clustering methodology was first assessed by applying it to an artificial data set, and showing its ability in the identification of Web user sessions without requiring any a priori definition of threshold values. Then,
the proposed clustering methodology was applied to measured data sets to study the characteristics of Web user sessions. User-sessions were shown to be Poisson. However, correlation arises when an anomalous network behavior is induced, for example, by a worm infection. The analysis of the identified user-sessions shows a wide range of diverse behaviors that cannot be captured by any threshold based scheme. The clustering algorithm proposed in this paper can be helpful in studying traffic properties at the user level, and could be easily extended to deal with other types of user-sessions, not necessarily related to Web traffic.
REFERENCES
[1] V. Paxson and S. Floyd, “Wide-area traffic: The failure of Poisson modeling,” IEEE/ACM Trans. New., vol. 3, no. 3, pp. 226–244, Jun. 1995.
[2] M. E. Crovella and A. Bestavros, “Self similarity in World Wide Web traffic: Evidence and possible causes,” IEEE/ACM Trans. Net., vol. 5, no. 6, pp. 835–846, Dec. 1997.
[3] R. Caceres, P. Danzig, S. Jamin, and D. Mitzel, “Characteristics of wide-area TCP/IP conversations,” in Proc. ACM SIGCOMM’91, Aug. 1991, pp. 101–112.
[4] P. Danzig and S. Jamin, “Tcplib: A library of TCP Internetwork traffic characteristics,” USC, Tech. rep., 1991.
[5] P. Danzig, S. Jamin, R. Caceres, D. Mitzel, and D. Mestrin, “An mpirical workload model for driving wide-area TCP/IP network simulations,” Internetworking: Research and Experience, vol. 3, no. 1, pp. 1–26, 1992.
[6] V. Paxson, “Empirically derived analytic models of wide-area TCP connections,” IEEE/ACMTrans. Net, vol. 2, no. 4, pp. 316–336, Aug. 1994.
[7] C. Nuzman, I. Saniee, W. Sweldens, and A. Weiss, “A compound model for TCP connection arrivals, with applications to LAN and WAN,” Computer Networks, Special Issue on Long-Range Dependent Traffic, vol. 40, no. 3, pp. 319–337, Oct. 2002.
[8] F. D. Smith, F. H. Campos, K. Jeffay, and D. Ott, “What TCP/IP protocol headers can tell us about the web,” SIGMETRICS Perform. Eval. Rev., vol. 29, no. 1, pp. 245–256, 2001.
[9] W.Willinger, V. Paxson, and M. S. Taqqu, “Self-similarity and heavy tails: Structural modeling of network traffic,” in A Practical Guide to Heavy Tails: Statistical Techniques and Applications, R. Adler, R. Feldman, and M. S. Taqqu, Eds. Boston, MA: Birkhauser, 1998.
[10] T. Bonald, A. Proutière, G. Régnié, and J. W. Roberts, “Insensitivity results in statistical bandwidth sharing,” in Proc. Int. Teletraffic Congr. (ITC) 17, Salvador, Brazil, Dec. 2001, 12 pp.
[11] P. Barford and M. Crovella, “Generating representative web workloads for network and server performance evaluation,” in Proc. SIGMETRICS’98/PERFORMANCE’98, 1998, pp. 151–160.
[12] L. Cherkasova and P. Phaal, “Session-based admission control: A mechanism for peak load management of commercial Web sites,”IEEE Trans. Comput., vol. 51, no. 6, pp. 669–685, Jun. 2002.
[13] M. Pioro and D. Medhi, “Routing, flow, and capacity design in communication and computer networks,” The Morgan Kaufmann Series in Networking, 2004.
[15] S. Ben Fredj, T. Bonald, A. Proutière, G. Régnié, and J. W. Roberts, “Statistical bandwidth sharing: A study of congestion at flow level,” in Proc. ACMSIGCOMM 2001, San Diego, CA, Aug. 2001, pp. 111–122. [16] M. F. Arlitt and C. L. Williamson, “Web server workload
characterization: The search for invariants,” in Proc. ACM SIGMETRICS’96, Philadelphia, PA, 1996, pp. 126–137.
[17] Y. Fu, A. Vahdat, L. Cherkasova, and W. Tang, “EtE: Passive end-to-end Internet service performance monitoring,” in Proc. General Track: 2002 USENIX Annu. Tech. Conf., Monterey, CA, 2002, pp. 115–130. [18] D. J. Hand, H. Mannila, and P. Smyth, Principles of Data Mining.
Cambridge, MA: MIT Press, 2001.
[19] A. Bianco, G. Mardente, M. Mellia, M. Munafò, and L. Muscariello, “Web user session characterization via clustering techniques,” in Proc. IEEE GLOBECOM 2005, St. Louis, MO, Nov. 2005, vol. 2, pp. 1102– 1107.
[20] The GARR Network Topology. 2005 [Online]. Available: http://www. garr.it/reteGARR/mappe.php
[21] M. Mellia, A. Carpani, and R. Lo Cigno, “Measuring IP and TCP behavior on edge nodes,” in Proc. IEEE GLOBECOM 2002, Taipei, Taiwan, R.O.C., Nov. 2002, vol. 3, pp. 2533–2537.
[22] M. Mellia, R. Lo Cigno, and F. Neri, Tstat Web Page. 2001 [Online]. Available: http://tstat.tlc.polito.it
[23] What You Should Know About the Sasser Worm. May 2004 [Online]. Available: http://www.microsoft.com/security/incident/sasser.mspx [24] S. McCanne, C. Leres, and V. Jacobson, Tcpdump. 2001 [Online].
Available: http://www.tcpdump.org
[25] G. Iannaccone, C. Diot, I. Graham, and N. McKeown, “Monitoring very high speed links,” in Proc. ACM SIGCOMM Internet Measurement Workshop, San Francisco, CA, Nov. 2001, 5 pp.
[26] A. Feldmann, “Characteristics of TCP connection arrivals,” AT&T Labs Research, Florham Park, NJ, Tech. rep. , 1998.