Preface
To conclude my study Civil Engineering & Management at the department of Water Engineering & Management I performed a Master project on the evolution of river dunes, especially on the implementation of dune splitting in the two-dimensional vertical (2DV) dune development model (DuDe). My research project started with a trip to New Zealand, where I performed flume experiments together with my daily supervisor, Andries Paarlberg. It has been interesting to see dune development happen only inches before my eyes. The fact that we were so close to the matter and still did not understand why dunes occur and how they progress the way they do is intriguing. My experience in performing flume experiments, obtained during my Bachelor research project was useful but my knowledge about river dunes and sediment transport was limited to one or two courses during my Master. I am pleased to say that I developed much more insight in this matter now and in modelling in general.
To get away from the sand dunes, we took the weekends off to explore the amazing countryside of the Northern Island. During this trip I took the cover photo. The alert observant discovers that leaving the sand dunes behind during the weekends was easier said than done…
New Zealand has been a great experience. I would like to thank Andries for inviting me to join him on the journey to the other side of the world. And for his support during my research, especially for his patience to learn me the details of the DuDe model.
I would like to thank my graduation teacher, Marjolein Dohmen-Janssen for her positive feedback. Subsequently I would like to thank professor Suzanne Hulscher for remembering me to focus on the new aspects of this research and Paul Termes for his enthusiastic responses and ideas.
Besides my committee members I have been talking to one of the developers of the numerical code of the DuDe model, Ruud van Damme. He provided me with ideas to test the applicability of the changes I proposed and improved my understanding of the model by posing the right questions, I would like to thank him for the time and effort he took to help me.
Summary
River dunes are submerged bed forms on the bottom of alluvial channels. They form as a result of the complex interaction of water flow and sediment. River dunes influence the water level, by creating additional bed roughness as a result of form drag and can form a threat to shipping activities. Therefore they deserve the attention of river basin managers.
The relevance of physical modelling in contrast to the use of equilibrium predictors or empirical models lies in the applicability in extreme events. Equilibrium predictors do not consider the time component of dune development. Hysteresis for dune height is observed to be strong during a flood wave, which makes the use of equilibrium predictors inaccurate. Empirical modelling depends on calibration with data. The availability of data for extreme events is limited or absent, so the need for physical modelling is strong.
The Dune Development (DuDe) model is developed to describe river dune evolution by combining two-dimensional vertical (2DV) flow equations with a sediment transport formula using a parameterization of flow separation to avoid complex turbulence modeling inside the flow separation zone. Dune growth, migration and merging of river dunes is described well by the DuDe model. Model simulations have shown that the model did not predict equilibrium dimensions. Dunes did not reach a finite length and height.
Therefore, flume experiments have been conducted in Auckland (New Zealand) to observe the process of dune development, especially regarding dune splitting. Dune splitting in the form of initiation of superposed sand wavelets is seen as the mechanism to obtain equilibrium dune dimensions. Superposed sand wavelets develop a flow separation zone and can decrease the migration rate of underlying dunes and even cease migration when they scour the crest of the underlying dune. Therefore the implementation of superposed sand wavelets is seen as the solution to improve the prediction of equilibrium dune dimensions.
There are several ways to implement these superposed wavelets.
The implementation of a random disturbance of the river bed to mimic turbulent structures does not lead to splitting, as the model only supports growth of dunes with a wavelength larger than 0.5 m. Slope effects in the sediment transport formula change the fastest growing mode, but do not enable the random initiation of superposed bed features. Therefore, splitting, based on the superposed wavelets, is implemented in the DuDe model, by superposing a triangular disturbance on the stoss side of dunes, when they exceed a critical length (Lcrit). This critical length is based on stability analysis, which shows that dunes are able to grow when the wavelength is larger than 0.5 m. These newly formed disturbances are created with an initial wavelet height (Hwave) of 6 mm.
Model simulations with this improved model lead to equilibrium dune dimensions. The dunes grow and migrate and eventually reach equilibrium dimensions in the expected period of time. The time to equilibrium and migration rates are in accordance with flume experiments. The model is now able to predict dune development from flat bed to equilibrium as observed in both field and flume.
Sensitivity analysis shows that the equilibrium dimensions depend highly on the critical stoss side length (Lcrit), but this parameter is based on the stability analysis and is in accordance with the critical length expressed by earlier findings on superposed wavelets. The initial behaviour of the model differs from the experimental observations and therefore the nonlinearity parameter β in the sediment transport equation is reviewed. The variation of β does not lead to a change in the initial model behaviour. It only leads to a complete acceleration of dune development.
Samenvatting (Dutch)
Rivierduinen zijn bodemvormen die zich bevinden op de bodem van rivieren. Ze ontstaan als gevolg van de complexe interactie tussen water stroming en sediment. Rivierduinen beïnvloeden de waterspiegel doordat ze zorgen voor extra bodemruwheid als gevolg van vorm ruwheid (form drag). Ze zijn dus van groot belang voor hoogwaterbescherming en kunnen een bedreiging vormen voor de scheepvaart. Vandaar dat rivierduinen de volle aandacht verdienen van waterbeheerders.
De meerwaarde van fysisch modelleren ten opzichte van evenwichtschatters of empirische modellen om duindimensies te voorspellen ligt in het voorspellen van extreme situaties. Evenwichtschatters houden geen rekening met de tijdsdimensie van duinontwikkeling. Hysterese in de duinhoogteontwikkeling blijkt sterk tijdens hoogwatersituaties. Dit effect kan alleen worden meegenomen als het volgt uit de fysica. Empirische modellen zijn afhankelijk van de beschikbaarheid van data. Vooral voor extreme situaties als piekafvoeren van rivieren is deze ontoereikend. Vandaar de voorkeur voor fysisch modelleren.
Het duin ontwikkelingsmodel (DuDe) is ontwikkeld om rivierduinontwikkeling te beschrijven met behulp van tweedimensionaal verticale (2DV) stromingsvergelijkingen gekoppeld aan een sediment transport formule. Stromingsloslating is afzonderlijk geparameteriseerd om complexe turbulentie modellering in de stromingsloslatingszone te vermijden. Duingroei, migratie en het samengaan van duinen werd reeds goed beschreven door het DuDe model in vergelijking met stroomgoot-experimenten. Echter splitsing van duinen en het bereiken van evenwicht in de duinhoogte en duinlengte ontbrak.
Stroomgoot experimenten zijn uitgevoerd aan de Universiteit van Auckland (Nieuw Zeeland) om duinontwikkeling te observeren, in het bijzonder het splitsen van duinen. Tijdens de experimenten is het ontstaan van zandgolfjes (sand wavelets) op de loefzijde van lange duinen waargenomen. Deze kleine gesuperponeerde bodemvormen zorgen voor een afname van de migratiesnelheid van onderliggende duinen. Ze kunnen zelfs veroorzaken dat een onderliggend duin stopt met migreren wanneer ze de top van het onderliggende duin eroderen.
Er zijn verschillende manieren om deze gesuperponeerde duintjes te modelleren. De implementatie van een willekeurige verstoring van het rivierbed om zodoende turbulente structuren na te bootsen leidt niet tot duinsplitsing, omdat duinen alleen groei vertonen in het model wanneer deze een golflengte hebben groter dan 0.5 m. Daarom is duinsplitsing geïmplementeerd, gebaseerd op de zandduintjes, waargenomen tijdens de experimenten. Deze zandduintjes zijn geïmplementeerd als driehoekige verstoringen op de loefzijde van duinen langer dan de kritische lengte van de loefzijde (Lcrit). Deze kritische lengte is gebaseerd op stabiliteitsanalyse. Deze analyse laat zien dat duinen groei vertonen wanneer de golflengte 0.5 m overschrijdt. Deze nieuw gecreëerde verstoringen
worden gevormd met een initiële hoogte (Hwave) van 6 mm.
Model simulaties met deze verbeterde versie van het model laten zien dat evenwicht optreedt in de duindimensies. De duinen groeien en migreren en uiteindelijk bereiken ze een evenwicht binnen de verwachte tijd. De tijd tot evenwicht en de migratiesnelheid van de duinen in evenwicht komen overeen met de waarnemingen tijdens experimenten. Het model is nu in staat om duinontwikkeling te voorspellen van een vlakke bodem tot evenwicht, overeenkomstig de experimenten en veldstudies.
Gevoeligheidsanalyse toont aan dat de evenwichtsdimensies die voorspelt worden met het model weliswaar in hoge mate afhankelijk zijn van de kritische lengte van de loefzijde (Lcrit), maar deze parameter is bepaald aan de hand van de stabiliteitsanalyse en heeft zodoende dus wel een fysische basis. Daarnaast komt deze parameter overeen met eerdere bevindingen, aangaande de lengte van gesuperponeerde zandduintjes. Het initieel gedrag van het model wijkt af van de duininitiatie waargenomen tijdens de experimenten. De variatie van de nonlineariteits-parameter β leidt echter niet tot een verandering van het initieel model gedrag, enkel tot een algehele versnelling van de duinontwikkeling.
Een belangrijke aanbeveling om het model geschikt te maken voor praktische toepassingen is de bepaling van Lcrit aanpassen. De kritische lengte van de loefzijde is afhankelijk van de heersende stromings- en sedimentcondities. Het is aan te bevelen gedurende de modelsimulaties op basis van
Table of Contents
1 INTRODUCTION... 13
1.1RIVER DUNE MODELLING... 13
1.2METHODOLOGY & REPORT OUTLINE... 14
2 RESEARCH BACKGROUND ... 17
2.1RELEVANCE OF PHYSICAL MODELLING... 17
2.2PROCESSES IN RIVER DUNE DEVELOPMENT... 18
2.3MODELLING OF RIVER DUNES... 20
2.4DUDE MODEL... 21
2.5MODEL SIMULATIONS... 23
3 FLUME EXPERIMENTS... 27
3.1METHOD AND EXPERIMENTAL SET-UP... 27
3.2RESULTS... 28
3.3POSSIBLE DUNE SPLITTING MECHANISMS... 34
4 IMPLEMENTING DUNE SPLITTING ... 35
4.1MODEL BEHAVIOUR... 35
4.2RANDOM DISTURBANCE... 37
4.3STABILIZING EFFECT OF SLOPE TERMS... 39
4.4SUPERPOSED WAVELETS... 40
4.5CONTINUOUS APPLICATION OF DUNE SPLITTING. ... 43
4.6RESULTS OF THE IMPLEMENTATION OF DUNE SPLITTING... 44
4.7EVALUATION OF EQUILIBRIUM CHARACTERISTICS... 47
5 SENSITIVITY ANALYSIS... 49
5.1SENSITIVITY ANALYSIS OF THE SEDIMENT TRANSPORT FORMULA... 49
5.2SENSITIVITY ANALYSIS FOR THE WAVELET PARAMETERS HWAVE AND LCR IT... 49
6 DISCUSSION... 51
6.1EXPERIMENTS... 51
6.2BEDFORMER... 51
6.3CRITICAL STOSS SIDE LENGTH (LCRIT) ... 51
6.4THE EXISTENCE OF A DYNAMIC EQUILIBRIUM... 51
7 CONCLUSION & RECOMMENDATIONS ... 53
7.1CONCLUSIONS... 53
7.2RECOMMENDATIONS... 54
REFERENCES... 55
APPENDICES ... 59
APPENDIX 1CLASSIFICATION OF BED FORMS... 60
APPENDIX 2EQUILIBRIUM PREDICTORS... 63
APPENDIX 3CRITICAL SHEAR STRESS... 64
APPENDIX 4EXTENDED MODEL DESCRIPTION DUDE... 65
APPENDIX 5FLOOD WAVE EXPERIMENTS... 72
APPENDIX 6RESULTS EXPERIMENTS... 75
APPENDIX 7INFLUENCE OF FLOW PARAMETERS ON THE INITIAL SPACING OF RIVER DUNES... 81
APPENDIX 8DETAILS ON SPLITTING AND MERGING DURING FLUME EXPERIMENTS... 82
APPENDIX 9NUMERICAL STABILITY ANALYSIS... 86
APPENDIX 10MODEL SIMULATIONS WITH AN ANGLE OF REPOSE
φ
s =63º... 88APPENDIX 11NUMERICAL IMPLEMENTATION OF THE SUPERPOSED WAVELET... 89
APPENDIX 12SENSITIVITY ANALYSIS FOR Β IN THE SEDIMENT TRANSPORT FORMULA... 90
APPENDIX 13SENSITIVITY ANALYSIS FOR HWAVE AND LCRIT... 94
1
Introduction
1.1 River dune modelling
River dunes are present in nearly all fluvial channels and are vital in predicting flow resistance, sediment transport, and deposition within many rivers (Best, 2005).
Dunes occur under sub critical flow conditions and migrate in stream wise direction. They influence the water surface in contrast to ripples. Ripples are also current-generated bed forms but do not influence the water surface because they occupy a smaller portion of the water column. The occurrence of ripples or dunes depends on the grain size and flow strength. Dunes develop at higher flow strengths and relative large grain sizes compared to ripples. (Allen, 1968; Chang, 1988). See Appendix 1 for a detailed classification based on flow characteristics and dimensionless grain size.
The branches of the River Rhine in the Netherlands (see figure 1.1), characterized by a sand-gravel bed in the upstream part and a sand bed in the downstream part of the river system, show migrating dunes, especially during floods (Wilbers & TenBrinke, 2003). Figure 1.1b gives a cross-section of the previous picture, with flow from right to left. The asymmetrical form is clear; river dunes migrate downstream with a relative gentle stoss side and a steep lee side (for details on dune jargon, see section 2.2).
a)
b)
Figure 1.1: a) Dune measurements during high river discharge b) Part of a bed profile showing large dunes with smaller dunes superimposed during flood, on 6 November 1998, flow from right to left. (Wilbers & TenBrinke, 2003).
14 1 INTRODUCTION Most researchers try to create a physical model based on a coupling of simplified flow equations and a sediment transport formula (Exner, 1920; Kennedy, 1963; Giri & Shimizu, 2006). Other models, however, aim at a more empirical or deterministic approach to describe what is observed during field and flume experiments (Führböter, 1983, Wilbers, 2004; Jerolmack, 2005). A more detailed review on current modelling can be found in section 2.3.
The need for a physical dune development model that is accurate and does not require too much computational effort is strong.
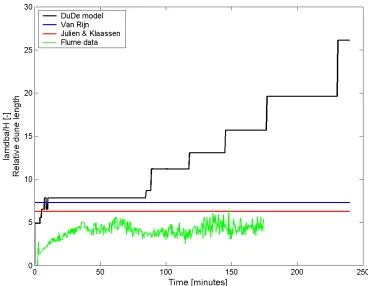
The dune development model (DuDe) is the research object during this Master project. It has been set-up to simulate the development of river dunes in a simplified way with minimum computational effort but based on the underlying physical processes taking place during dune development (section 2.4). It combines a steady two-dimensional vertical (2DV) flow solver to a bed load sediment transport formula. Section 2.5 shows that the DuDe model correctly simulates growth of low angle dunes from an initially disturbed bed. Dunes develop as expected into asymmetrical dunes with a gentle stoss side and a relative steep lee side. However, the existence of a dynamic equilibrium, in which dunes migrate downstream and merge and split as reported by Leclair (2002) and seen during flume experiments (chapter 3), is not observed during model simulations. Dunes keep merging as a result of varying migration rates and grow in height and length until they reach the boundaries of the model domain (section 2.5). Based on empirical methods (Julien & Klaassen, 1995; Van Rijn, 1984) to predict equilibrium dune dimensions, river dune height and length are assumed to reach equilibrium dimensions (Appendix 2). Model simulations with the DuDe model, without implementation of splitting, show that dune dimensions reach excessive proportions and are not in accordance with expected dune dimensions (section 2.5). Flume experiments have lead to the insight that splitting of river dunes occurs on the stoss side of relative long dunes (chapter 3).
Although a generic model or theory that successfully describes all underlying processes of dune evolution -especially the splitting of river dunes- is not available, the goal of this research is to incorporate a splitting mechanism, to obtain realistic dune lengths in the equilibrium stage and to mimic the behaviour observed in flume and field experiments. The lack of a process of splitting or new dune creation in the DuDe model assumed to be the reason for the absence of equilibrium dune dimensions.
Therefore the research objective for this Master project is:
Improving the prediction of equilibrium river dune dimensions, by incorporating dune splitting in the DuDe model for bed form evolution.
The following research questions are formulated to reach this objective:
I What are the strengths and weaknesses of the DuDe model?
II What processes are observed during flume experiments that explain the existence of equilibrium dune dimensions?
III How can splitting of river dunes be implemented in the DuDe model?
IV Does the implementation of splitting lead to the prediction of equilibrium dune dimensions?
1.2 Methodology & report outline
The lack of a splitting mechanism in the DuDe model is the reason for this research project. The methodology of this research project is visualized in figure 1.2. A comparison of model simulations and flume experiments leads to the derivation of possible splitting mechanisms to implement as model improvements. The model changes are reviewed and implemented and the sensitivity of the chosen parameters is tested. After discussion of the complete process, this leads to interesting conclusions on present improvements and recommendations for future improvements of the DuDe model.
Chapter 2 gives a literature review on dune development and describes the basics (model equations) and possibilities of the DuDe model before splitting has been implemented.
Chapter 3 describes the experimental set up, method and results of the experiments to validate the model and to obtain possible missing processes that explains the inability of the model to predict equilibrium dune dimensions.
Chapter 4 starts with the strengths and weaknesses of the model. Subsequently it presents the implementation of the splitting mechanism and described the model results.
Chapter 6 discusses the outcomes of this Master research project and the various stages of the project. The main conclusions of this project in the form of answers on the research questions mentioned above and recommendations for future research and application are presented in chapter 7.
16 1 INTRODUCTION
HIGHLIGHTSChapter 1: Introduction
• Correct prediction of equilibrium dune dimensions is essential for adequate river
management during high river discharge.
• The current DuDe model does not predict equilibrium dune dimensions.
• The goal of this research is to improve the prediction of equilibrium river dune
2
Research background
2.1 Relevance of physical modelling
Field measurements of the Dutch branches of the river Rhine (Wilbers & TenBrinke, 2003) and the Fraser river in British Columbia (Kostachuk & Villard, 1996; Villard, 2003) show a phase lag between the moment of maximum river discharge and the appearance of the highest dunes.
This so called hysteresis effect (figure 2.1) on dune dimensions makes it important to create a physical model to predict equilibrium dimensions. Dune dimensions can not only be described as a function of flow and sediment conditions. It has also a strong time component (figure 2.1). Recent news about climate change and changing weather patterns increases the attention of the public and governments for appropriate water management in general and flood protection in particular. Decision support systems and flood prediction models are used to assist water managers in making the correct decisions.
To improve flood prediction models, dynamic roughness has to be incorporated in these models. The formation of river dunes during high river discharge increases the bed roughness. Water levels depend largely on the bed roughness in the river main channel. The dynamic character of bed roughness as a result of river dunes lies in the phase lag that occurs between the river flood wave and the peak in the bed roughness. Hysteresis, a phase lag between the top river discharge and maximum bed form dimensions, makes it impossible to relate the bed roughness directly to the river discharge. The dune length and height continue to grow, even when the river discharge has started the falling stage. This makes the use of equilibrium predictors unrealistic and underlines the need for a physical based solution for the prediction of river dune evolution during high river discharges. At the moment roughness is used as a calibration parameter for hydraulic modelling. To incorporate dune evolution in hydraulic model, the need for models with a low complexity and a high accuracy is strong in the field of water managers (Paarlberg, 2007).
18 2 RESEARCH BACKGROUND
2.2 Processes in river dune development
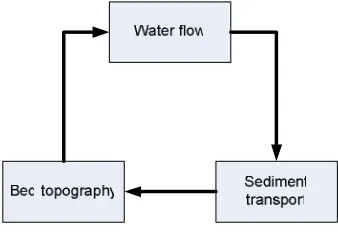
River dunes develop as a result of complex interactions between water flow, sediment
transport and bed morphology (figure 2.2). The bed forms are created and altered by the flow and, conversely, the flow is acted upon by the bed forms through the production of form drag and significant changes in local mean flow and turbulence fields (Nelson et
al., 1993).
Sediment transport takes place when the bed shear stress exceeds the critical shear stress for grains to move (Appendix 3). If a flat bed is acted upon by turbulent flow capable of producing significant movement of the sediment grain, the bed will be unstable to perturbations and will evolve into a train of bed forms (i.e. ripples and/or dunes) (Nelson et al., 1993). This first stage of river dune development, bed form initiation from flat bed has been subject of research for more than 80 years (e.g. Exner, 1920).
Raudkivi & Witte (1990) claim that since no ripples are formed in laminar flow, the initiation of small disturbances must be a function of turbulence. The first disturbances arise from the turbulent bursting process on the bed surface, but since turbulence is a random or at least very complex process, the apparent order, observed in nature (figure 1.1), must arise from a process of organizing. However, experiments in laminar flow, show that initial bed forms appear in a similar way under sub critical laminar flow. With wavelets forming in the absence of turbulent flow structures, it appears likely that initial bed forms are generated by an instability within the motion of the granular bed material or by a form of shear layer instability. (Coleman & Eling, 2000) Most research on bed form initiation has focused on two theories. Venditti et al. (2005) examined bed form initiation in unidirectional flow. Linear instabilities (perturbation theory) and bed defects were tested as trigger for dune initiation. The first theory (perturbation theory) is initially proposed by Exner (1920) and later developed by Anderson (1953). Perturbation theory involves the linearization of the equations of motion of both fluid and sediment over a bed perturbation or defect to predict suppression or growth of the perturbation (McLean, 1990). The second theory assumes that all bed forms are a result of propagation of initial bed defects, i.e. accumulations or patches of sediment or holes in the bed that are propagated downstream.
This second theory assumes that these patches grow because flow separation appears behind the crest of these initial dunes. Flow separation occurs at a short distance from the crest of a dune. River dunes become asymmetric due to unidirectional flow. The top migrates faster than the trough as a result of flow acceleration over the crest, resulting in a gentle stoss side and a steep lee side. If the lee side of a dune becomes too steep for the flow to follow the bed, flow separates. Consequently, a large separation zone develops in the trough. (figure 2.3).
Figure 2.3: Definitions of terms used in river dune research; FSZ = flow separation zone, FSP = flow separation point, FRP = flow reattachment point.
Water flowing over a rough bed creates a shear stress at the bed. If this shear stress exceeds a certain threshold, movement of sediment is initiated. The flux of this sediment depends on both the conditions of the flow and the local bed topography. Sediment transport depends on the bed shear stress and reacts therefore almost instantaneous to changes in water flow. Subsequently, as a result of sediment transport, the bed topography changes. Here does the circle start over again.
In the flow separation zone, a large eddy is formed where turbulence is generated. This implies energy dissipation and therefore slows down the main flow. It reattaches at a certain distance downstream, at the flow reattachment point (Paarlberg et al., 2005). Flow separation mechanisms are sometimes held responsible for the propagation and growth of these initial bed forms (Raudkivi, 1966).
The migration rate of dunes (c) can roughly be described as the sediment flux over the crest (qc) of
the dune divided by the height of the dune (∆) (law of Exner-Ertel):
c = qc / ∆ (2.1.1)
Assuming a constant sediment flux would imply that dunes migrate with celerities inversely proportional to their heights (Exner, 1920). Initial bed forms travel with velocities reciprocal to their heights with the result that the smaller forms catch up the bigger ones and unite, what in the sense of Haken (1978) corresponds to enslavement (Führböter, 1983). Raudkivi & Witte (1990) agree with this theory and state that bed features created by unidirectional flow of water in alluvial channels are seen to translate downstream at speeds related to their heights. The process of merging as a result of varying celerities is observed also more recently by Nino et al. (2002). Qualitatively, dune growth is perceived as the outcome of trough scouring, merging of dunes and lee side deposition, in consequence of flow deceleration behind a dune crest. Lee side deposition results also in crest accretion and depends largely on the existence of a flow separation zone, because the size and shape of the flow separation zone influences the local sediment transport (Leclair, 2002).
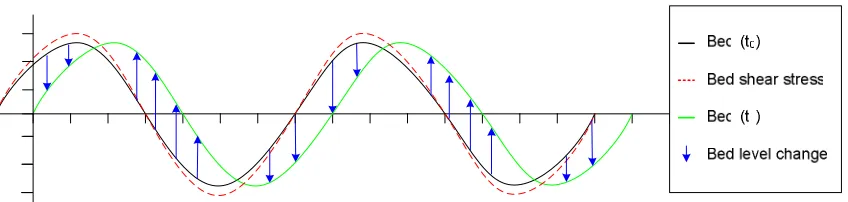
Bed forms grow as a result of an instability mechanism, induced by the phase lag between sediment transport and the bed topography (Kennedy, 1963; Colombini, 2004). This phase lag is a result of fluid inertia (Dronkers, 2005 ; Charru & Hinch, 2006).
The maximum bed shear stress appears earlier than the dune crest (figure 2.4). Because net sediment transport depends on the gradient in the bed shear stress (positive = erosion, negative = accretion) The crest of a dune grows and a trough scours, when the maximum bed shear stress appears earlier than the dune crest (figure 2.4).
Figure 2.4: Dunes grow when the bed shear stress is out of phase with the bottom configuration.
Colombini (2004) states that: “a simple glance at the linearized form of the Exner’s equation for bed evolution (formula 2.1.2; Exner,1920) reveals that if the local sediment transport rate is exactly in phase with the bed elevation, no amplification of bed perturbation is obtained.”
x
q
t
h
b∂
∂
−
−
=
∂
∂
)
1
(
1
0
ε
(2.1.2)(h=bottom elevation [m], t=time [s], ε0 = void ratio of sediment [-], qb = sediment flux per unit
width [m2s-1], x = distance in flow direction [m])
20 2 RESEARCH BACKGROUND
Figure 2.5: Dunes migrate without changing shape, when the bed shear stress is in phase with the bed elevation
However, in the search for an explanation for the finite dune length observed in nature, linear theory is unable to clarify the ability of dunes to reach an equilibrium amplitude. Eventually dune height and length reach equilibrium values in both flume (Coleman, 2005; Van Rijn, 1993) and field experiments (Julien & Klaassen (1995), Wilbers & TenBrinke, 2003). However, reports on flume experiments present mean dune dimensions and lack detailed qualitative descriptions of specific processes (e.g. dune splitting). Equilibrium dune height and length are mainly influenced by flow characteristics, especially the water depth (H). Some equilibrium predictors of river dunes also assume an influence of grain size (Julien & Klaasssen, 1995) and even flow strength (represented by the Froude number (Tsuchiya & Ishizaki, 1967) or Van Rijn’s transport parameter T (Van Rijn,1984)).
2.3 Modelling of river dunes
Numerous attempts have been made by researchers to model dune development without modelling all detailed processes. Most models try to create a physical model based on a coupling of simplified flow equations, with some basic assumption regarding turbulence or pressure distribution. Fifteen years ago Nelson et al. (1993) wrote: “Current understanding of the flow-bed coupling is insufficient to produce physically based predictive models for bed form generation and stability under arbitrary flow conditions. This presents a substantial barrier to progress in several areas of geophysics and hydraulics. At present, empirical techniques are used to address these problems and, although these techniques often provide good results over the range of flow and bed form parameters for which they were developed, they typically yield poor results when extrapolated to situations other than those for which they are specifically calibrated. Because one of the primary goals in developing relations for roughness, sediment transport, and bed form geometry is to apply those relations to extreme events or other situations where flow and sediment transport data are difficult or impossible to measure, these empirical methods are inadequate in many cases.”
Jerolmack and Mohrig (2005) underlined these findings just recently. However, progress has been made the last 15 years in understanding the fluid dynamics associated with alluvial dunes and has witnessed huge advances in field, laboratory, and numerical investigations (Best, 2005).
2.4 DuDe model
The Dune Development model (DuDe) is developed to analyze the morphodynamic evolution of river dunes during river floods (Paarlberg et al, 2006). DuDe consists of a two dimensional vertical (2DV) flow solver and a sediment transport model based on the equations of Meyer-Peter-Müller (1948). The flow solver is a steady version of a model by Hulscher (1996), which is originally developed for simulating offshore sand waves. The currently used numerical implementation is developed by Van den Berg & Van Damme (2005). Hydrostatic shallow water equations are used assuming a constant eddy viscosity.
Figure 2.6: Definitions of flow parameters
During a model simulation, the model calculates the flow characteristics based on the bed configuration of the previous time step. Subsequently, the bed shear stress and corresponding sediment transport are derived. The calculation of bed elevation, based on the gradient in sediment transport, is the final step to obtain a new bed profile. This quasi-steadiness of the model is allowed because bed evolution and flow dynamics take place at different time scales. The basic flow and sediment transport equations will be discussed in this chapter. Appendix 4 gives an extended description of the model with the relevant boundary conditions needed to solve these equations. Due to the constant eddy viscosity, flow separation cannot be treated explicitly and is parameterized, which is also described in detail in Appendix 4.
Shallow water equations
Assuming no variations perpendicular to the flow direction and considering incompressible flow, the momentum equation in x-direction reads:
b
The continuity equation reduces, given the assumptions mentioned earlier to:
0
partial slip condition results in a good representation of the vertical flow structure and therefore ingood estimation of the volumetric bed shear stress (
τ
b [m2s-2]). Boundary conditions, assuming noflow through the boundaries and no wind shear are described in Appendix 4.
Sediment transport equation
The basis for the sediment transport equation used in the DuDe model is first described by Meyer-Peter and Müller (1948). They stated a power law relationship between sediment flux and bed shear stress.
22 2 RESEARCH BACKGROUND immersed weight acting down slope. Secondly (ii): a sloping bed will change the value of the threshold shear stress for initiation of motion (Bagnold, 1956).
Intuitively a positive slope (upwards in the direction of flow) increases the threshold shear stress for particle motion. The second bed slope effect is described mathematically by Fredsoe and Deigaard (1992).
The volumetric sediment transport rate qb [m2s-1] depends on the local volumetric bed shear stress
τ
b [m2s-2] (see formula 2.2.5). The threshold shear stress increases or decreases depending onthe local bed slope (ii) mentioned earlier with a factor λ1. The volumetric transport rate is also directly influenced by the local bed slope as a result of the other slope effect (i) with a factor λ2 .
The parameter
α
is a proportionality constant = 0.5 s2m-1 and β = 1.5 is a nonlinearity parameter.The local bed slope hx is the first derivative of h to x.
φ
s is the angle of repose of sediment, whichdepends on the grain diameter and angularity (roundedness) of the sediment (Simons (1957) in: Chang, 1988) and is about 30º for sand in rivers.
50
This can be explained physically based on continuity of mass, the difference between mass inflow and outflow will be compensated by the change in bed level. A correction is applied for the porosity
of the sediment (εp = 0.4), because the sediment flux is calculated as volume solid material, and to
determine the change in bed elevation including voids, compensation for this 40% void volume is needed.
Parameterization of flow separation
River dunes become asymmetric due to unidirectional flow. The top migrates faster than the trough, resulting in a gentle stoss side and a steep lee side. If the lee side of a dune becomes too steep for the flow to follow the bed, flow separates (figure 2.7). The boundary between the normal flow zone and the flow separation zone is called the separation streamline (SSL). The area underneath the SSL is called the flow separation zone (FSZ). The separation streamline touches the bed again at the flow reattachment point (FRP).
L ee
s ide
Figure 2.7: Schematisation of river dunes with flow separation characteristics
zation of flow separation is based on a method developed for aeolian dune development by Kroy et al. (2002). For a extensive description of the DuDe model and the parameterization of flow separation, see Appendix 4.
2.5 Model simulations
Default settings
All model results that are presented in this Master thesis have flow and sediment characteristics comparable to the flume environment (chapter 3). These standard settings are:
Table 2.1: Default model settings
Initial model behaviour
The DuDe model needs variability in the initial bed profile to generate dunes, because differences
in bed elevation are generated as a result of gradients in the sediment flux (qx), which are a result
of varying local bed gradients (hx). The simulation starts with a random signal of two grain sizes
(2*d50) at t0 to mimic the fact that a flat bed is never perfectly flat. This random signal forms the
basis for dune development.
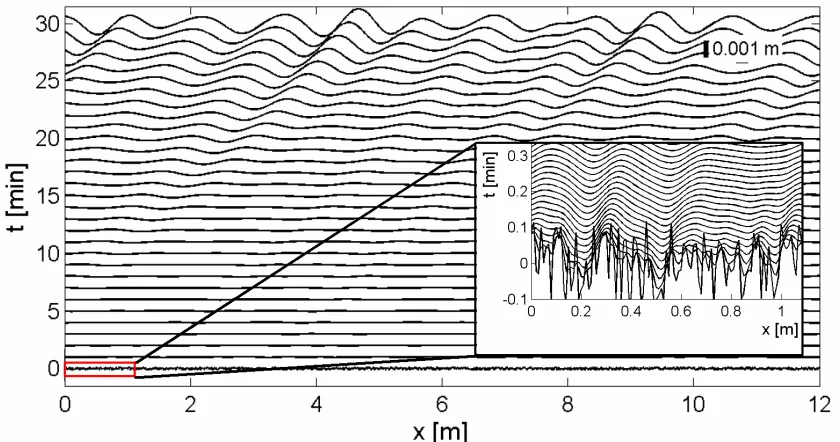
Every mathematical signal can be described as a sum of sinusoidal basis functions (Fourier). As seen in the magnified section of figure 2.8, the enforced random signal diffuses in the first seconds. The smallest wavelengths (largest frequencies) have the largest negative growth rate and therefore disappear fast as seen in earlier performed stability analysis (Paarlberg, 2006). Larger wavelengths (lower frequencies) diffuse slower. This process continues until a wavelength protrudes that grows, as seen after approximately 20 minutes.
Figure 2.8: Initial model behaviour: diffusion until dune growth is reached (Domain length = 12 m)
Flow and sediment characteristics Dimension
Waterdepth (H) 0.153 [m]
Grain size (d50) 0.8*10-3 [m]
Bed slope (ib) 12*10-4 [-]
Discharge per unit width (q) 0.076 [m2s-1]
Numerical properties
Horizontal grid size (dx) 0.01 [m]
24 2 RESEARCH BACKGROUND Dune growth and asymmetry development
The DuDe model predicts fastest sinusoidal dune growth for dunes with a wavelength of approximately 1.2 m. Remarkable is the fact that the dunes remain sinusoidal for a long time in contrast to the development of asymmetry observed during flume experiments (Coleman & Melville, 1997). According to Coleman & Melville (1997) asymmetry occurs during the first stages of dune evolution.
Figure 2.9 Linear behaviour, sensitivity of the growth and migration to the amplitude of a bed disturbance
The relative growth and migration rate of initial disturbances is determined for different amplitudes. Two situations are modelled: with the water level correction and without (H constant) to see if the initial behaviour would differ.
Figure 2.9 shows that the DuDe model is initially insensitive for variations in dune height, when the dune height does not occupy a significant portion of the water depth. This means that initially the wavelength determines the growth and migration of the dunes. If the migration rate is initially insensitive to the dune height, dunes remain symmetrical in this stage. Asymmetry is therefore a non-linear effect in the model.
The initial linear behaviour is also seen for the relative growth of river dunes. Initially the relative growth does not change when the wave height increases. The decrease in relative growth shows that the relative growth decreases with the amplitude of the bed disturbance as it reaches the equilibrium height belonging to the applied wavelength of the disturbance.
Dunes migrate at a celerity of approximately 4 m hour-1. Differences in migration rates eventually
Figure 2.10: Asymmetry development and flow separation, flow separates after 50 minutes
Dune merging
Dune merging is described by several publications on flume and field experiments. Two dunes with different migration rates merge into a bigger bed form. (Leclair, 2000) uses the concept of ‘catching up’. “Dunes that ‘catch-up’ other dunes occur when the through elevation of a downstream dune is lower than that of an upstream, faster dune’. Before a dune is caught up, it decelerates markedly, as shown by Ditchfield & Best (1992) and may sometimes even cease to migrate. The ‘caught-up’ dune then suddenly increases in both height and length as the trough remains at the same elevation on the bed, The catching-up of dunes occurs at all flow velocities and aggradation rates, but is not frequent.”
Field experiments also report on the merging of dunes, as described by Jerolmack and Mohrig (2005). “Large-scale bed features remained recognizable over the duration of their observations, while individual bed forms were observed to split into smaller features, merge to form larger features, spontaneously form on the stoss-side of larger features, and disappear in the lee slope of larger features.” Merging of river dunes is seen during model simulations with the DuDe model, but initiation of new dunes or splitting of dunes does not occur during model simulations with the DuDe model. This means that dune height and length increase but do not decrease. Eventually this leads to unexpected high and long dunes (figure 2.11 & 2.12). Expected dune length and height (L ≈ 1m, ∆ ≈ 0.05 m) are exceeded, because merging of dunes is a continuous process during these simulations.
26 2 RESEARCH BACKGROUND
Figure 2.12: Dune length grows as a result of continuous merging and the lack of a splitting mechanism.
HIGHLIGHTSChapter 2: Research background
• The DuDe model combines a 2DV flow solver with a sediment transport formula, flow
separation is parameterized to avoid complex turbulence modelling.
• DuDe simulates dune growth and migration of dunes that become asymmetric with an
angle of repose lee side and flow separation behind the crest.
• Asymmetry is observed as a non-linear effect in the model.
• The lack of a splitting mechanism makes that dunes keep merging and therefore growing
3
Flume experiments
Flume experiments on the evolution of river dunes from flat bed are conducted under steady and unsteady conditions. The steady flow experiments are mainly used to investigate the stages of dune development and to compare the DuDe model with a controlled environment. Recent reports on experiments (Coleman & Melville, 1996; Coleman, 2005; Venditti et al., 2005) do not show the large detail, needed to determine dominant processes in the development of an equilibrium situation. Coleman (2005) focuses on the time to equilibrium and the equilibrium height and derives relations for these parameters, based on comparison of numerous flume experiments. They, however do not explain why this equilibrium is reached and do not qualitatively describe the observed behaviour. Venditti et al. (2005) mainly aim at the first stage of dune development; initiation from flat bed. Qualitative descriptions on the development of the initial dunes are incorporated, but the reason for finite dune lengths is not found in this publication.
The goal for the steady flow experiments is to investigate the equilibrium situation for river dunes and to find a mechanism for dune length and height stabilization. This knowledge can be used to improve the DuDe model.
The unsteady (flood-wave) experiments are conducted to investigate the influence of a flood wave on the development of river dunes and are described in Appendix 5.
3.1 Method and experimental set-up
The experiments are conducted in a 0.44 m wide, 12 m long, glass-sided flume. The flume, located at the University of Auckland is fully recirculating (both water and sediment) and tilting. The flume was filled with a 60mm thick layer of near-uniform coarse sediment with a median grain size d50 = 0.85 mm. See figure 3.1 for the result of the sieve analysis.
After distributing the sand evenly over the flume bed, the flume was carefully filled with water to the initial water depth (H). The bed was flattened before each run to make sure that all experiments started with the same initial bottom configuration. To obtain the desired bed slope, the flume was tilted.
At t=0, the pumps (sediment and water) were turned on simultaneously with the start of the bed profile measuring. The bed profile was measured with an automatic carriage system containing a depth sounding probe, which measured the bed elevation. The position of the carriage along the flume is determined by a potentiometer mounted on a wheel which is attached on the carriage and moved along the side of the flume. The carriage moved over a 6 m long test-section starting 4m downstream of the sand and water inlet. It was able to measure a centreline bed profile, roughly every 23 seconds with a spacing of approximately 2.5mm. According to Coleman & Melville (1997) the accuracy of bed-elevation measurements is ± 0.4mm. For visual support, a fixed video camera recorded dune evolution from the start over a section of 1.5 m during several experiments. A handheld camera was used to observe small scale processes. During the experiments the water
28 3 FLUME EXPERIMENTS surface elevation was monitored to assure that the water surface slope was parallel to the bed slope. The downstream water level was adjusted by moving a tail gate at the downstream end of the flume when a discrepancy was observed. These adjustments have not been applied for earlier experiments (T2-T8, T11,T13-T15 & T17).
In these earlier experiments, a water level slope resulted in a bed slope change.
Water temperature, initial water level and bed slope were recorded before the start of an experiment. Depth-averaged mean flow velocity was estimated using Acoustic Doppler Velocimeter (ADV) measurements. A logarithmic profile was fitted through the ADV-data and the mean flow velocity was estimated as the velocity at 1/e of the height of the water column above the sand bed. Two shear velocities were calculated for each flow setting. u*(1)was calculated as (gHib)-1/2 (see
explanation of symbols in table 3.1), whereas u*(2) was determined based on the ADV
measurements.
Experiments under steady flow conditions are performed for three different settings. The bed slope is kept constant at a value of 0.0015, but the pump settings and initial water
level are different:
• T22: H0 = 150 mm, q = 0.10 m2s-1
• T23: H0 = 125 mm, q = 0.08 m2s-1
• T24: H0 = 100 mm, q = 0.06 m2s-1
The method to generate river dune characteristics from the highly detailed and extensive data-sets is developed by Dougal Clunie (University of Auckland) and has been improved by Andries Paarlberg. Outliers were filtered by a software tool called clean-up. Subsequently, a software tool bedformer, determines river dune dimensions (height, length and steepness) for every measured profile. The tool determines a lee side based on a certain number of points. These points need to form a line with a minimum lee face angle at a minimal horizontal distance from another lee side. Consequently, the tool looks upstream for a crest by determining a local maximum and downstream for the trough as a local minimum downstream. When crests and trough location and elevation are known, the dune dimensions can be determined. The sensitivity for the variability in four criteria to define a dune is determined. These criteria are:
• minimum dune height (default value: 0.005 m),
• minimum horizontal distance between identified lee-faces (default value: 0.045 m)
• minimum number of points taken into account to constitute a lee face (default value: 6)
• minimum angle of the lee-face slope (default value: 12º)
Friedrich et al. (in press.) show that the dune dimensions determined by bedformer are mainly sensitive to the minimum dune height. An increase in the minimum dune height means that small dunes are not recognized as dunes. This reduces the number of dunes and therefore increases the average dune length and height. Therefore the results (section 3.2) show only graphs with a dependency on minimum dune height. Friedrich et al. (2007) present an alternative method for determining dune dimensions because the discrete method is highly sensitive to this arbitrary minimum dune height that defines a dune (Friedrich et al., 2007).
Dune length, height and steepness during dune development are determined for three different flow strengths and time to equilibrium and other dune characteristics are compared with equilibrium predictors (Appendix 2). Dune geometries over time are also determined for unsteady flood wave conditions.
3.2 Results
Close visual observation and video capturing showed that the initial stages of bed form development from flat bed start with local pile ups of grains. These local pile ups organise within minutes into fairly straight crest lines, perpendicular to the flow direction with a preferred spacing (figure 3.2).
The mean initial spacing for the steady flow experiments (T22-T24) was approximately 0.20 m, which is slightly higher than expected, based on the method of Coleman & Melville (1996):
Figure 3.2: Dune initiation for experiment T22, showing a regular pattern of dunes with a spacing of approximately 0.20 m and a maximum lee side angle, equal to the angle of repose (≈ 30º) as seen in the right box.
Coleman & Melville (1996) predict an initial spacing of 0.15 m, based on the grain size and fluid properties. The initial spacing is a function of the critical grain Reynolds number and the mean grain diameter of the sediment (formula 3.2.2)
The critical grain Reynolds number is a function of the median grain size (d50) and the critical shear velocity (u*c). Using the method of Van Rijn (1993) the critical shear velocity can be determined based on the dimensionless grain size D* and the viscosity and relative density (∆):
3
To determine whether the initial spacing is independent of flow characteristics, the initial spacing of experiment T22-T24 is combined with earlier flume experiments (T2-T8, T11,T13-T15 & T17). The initial spacing has been derived from the bed plots (Appendix 6) by calculating the mean spacing for the first noticeable dunes.
The measured initial spacing shows no correlation with flow parameters (Appendix 7). As expected, discharge (q), waterdepth (H) , bed shear velocity (u*) and Froude number, do not correlate with the measured initial spacing.
The right box of figure 3.2 shows an important detail. The lee side of initial dunes immediately form an angle of repose. Grains avalanche down the angle of repose lee face of these already asymmetrical short dunes in the early stages of development. This makes the presence of a small separation zone inevitable, because flow can not follow these sharp angles of the bed. Recirculating flow inside the flow separation zone helps maintaining the angle of repose lee side and plays therefore already an essential role in the growth and development of initial dunes.
Dunes grow by trough scouring and lee side deposition, the lee side deposition results in crest accretion as well. Dune growth is observed over the total flume length (Appendix 6)
Subsequently, these small dunes grow and merge into longer and higher dunes as a result of varying migration rates (Appendix 6). Upstream dunes catch up, or merge with downstream dunes and travel downstream together at a migration rate lower than the upstream dune before merging, but not necessarily slower than the downstream dune. Dune height and length grow simultaneously until they eventually reach an equilibrium. The time to equilibrium can be estimated with an
empirical formula, based on the median grain size (d50), water depth (H) and the dimensionless
shear stress (θ) and shear velocity (u*) (Coleman et al. (2005):
30 3 FLUME EXPERIMENTS The expected time to equilibrium is given in table 3.3. To determine the observed time to equilibrium for the experiments, the moment where the dunes do not grow in length and height is visually estimated by drawing an imaginary asymptote for the graphs. The time to equilibrium is defined to be the time between the moment that 5% of the equilibrium height is reached until 95% of the equilibrium height is reached. The observed time to equilibrium for the flume experiments is of the same order as predicted by the Coleman et al. (2005) (formula 3.2.5). Based on analysis of figures similar to figure 3.3, the observed dune height and the measured equilibrium length are determined (table 3.4). The observed equilibrium height and length are slightly smaller than expected based on dune length estimators, but given the uncertainty of the method to determine dune length and height, it is in accordance with the expected values (table 3.3 & 3.4). However the trend in the time to equilibrium is different to what was expected. A higher flow strength and larger water depth leads to a shorter time to equilibrium, instead of longer, what was expected based on the method of Coleman et al. (2005)
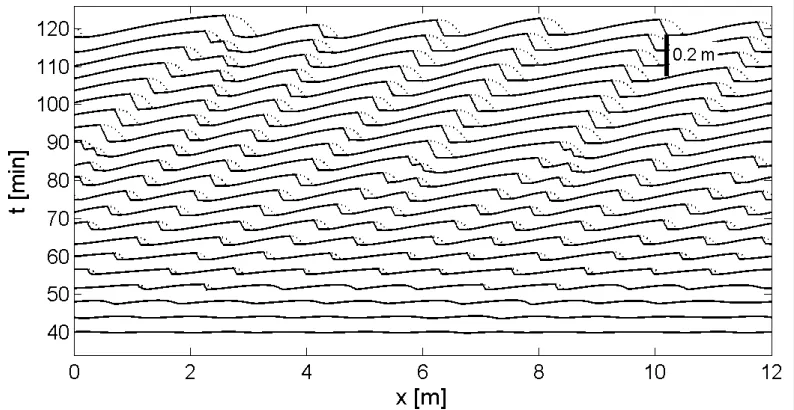
The conditions of experiment test number 22 resemble the conditions for which the DuDe model has been calibrated and should therefore deliver results comparable to the model outcomes.
Figure 3.3 shows a stacked plot of bed profiles which show the evolution of dunes from short initial dunes (which already show strong asymmetry) to dynamic equilibrium. Every line in this plot shows the measured bottom profile with a time spacing (in this case 4 minutes). The scale line can be used as a references to estimate dune heights. Dune migration rates can be visualized, because dunes can be tracked downstream, with the crest position on the x-axis and the expired time on the y-axis.
Flow Test Flow parameters
Cond Numbers PUMP b Q q H0 b/H0 i0 U u*1 u*2
setting [m] [l/s] [m2/s] [m] 0 0 [m/s] [m/s] [m/s] VII 22 20 0.44 43.74 0.0994 0.1500 2.93 0.0015 0.65 0.047 0.037 II 23 17 0.44 35.94 0.0817 0.1250 3.52 0.0015 0.62 0.043 0.036 IV 24 14 0.44 27.19 0.0618 0.1000 4.40 0.0015 0.58 0.038 0.035
Table 3.1:Flow parameters
(b = flume width, Q = discharge, q = specific discharge, H0 = initial water depth, i0 = initial water surface and bed slope U = average flow velocity, u* = shear velocity, with u*1=sqrt(g*H0*i0), and u*2=based on ADV measurements (see exp. set up) Note, for experiment T22,23,24, water depth is changed during experiment, such that w/s slope is equal to bed surface slope)
Flow Test Non-dimensional parameters
Cond Numbers Fr Re_gr Y Y/Ycr Us/Usc Us/Usc
from theta
VII 22 0.536 39.93 0.1604 4.64 1.709 2.153 II 23 0.561 36.45 0.1337 3.86 1.671 1.965 IV 24 0.583 32.61 0.1070 3.09 1.600 1.758
Table 3.2: Non dimensional parameters
(Fr = Froude number = U/sqrt(g*H0), Re_gr = grain Reynolds number = u*1*D50/visc, with D50 = average grain size and visc = 1*10^{-6} Y = theta = Shields number, Us = u*, Usc = u*c = critical shear velocity (based on Shields number))
Flow Test Coleman
Table 3.3: Expected dune characteristics
(Coleman = Coleman et al. (2005), ∆= dune height, L = dune length)
Flow Test Observed dune characteristics
Cond Numbers
Figure 3.3: Bed profile for experiment T22, see table 3.1 & 3.2 for flow characteristics.
A dynamic equilibrium occurs when two reversible processes occur at the same rate. Merging and splitting are reversible, because they change the mean dune length oppositely. The regular pattern, observed during the first minutes changes after more than an hour in a more dynamic display of dunes where merging and splitting occurs.
32 3 FLUME EXPERIMENTS
Figure 3.4: Superposed wavelets split the stoss side of a big dune (Appendix 8).
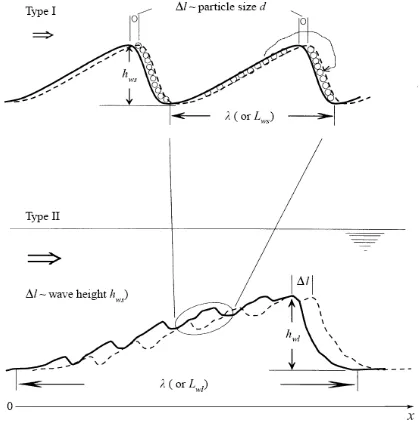
The sediment transport changes at that location from Type I transport, which is standard bed load transport into Type II transport, which is transport of sediment by superposed wavelets that migrate until they reach the crest of the underlying dune, thereby filling the lee side of the underlying dune (figure 3.5). This type II transport continues until one of the superposed wavelets grows in height and slows down and forms a flow separation zone with recirculating flow itself. Appendix 8 shows that a superposed wavelet can decrease the sand supply to the crest of the underlying dune thereby, scouring the crest of the underlying dune. This results ultimately in shorter dunes and in combination with merging leads to equilibrium length and height.
Dune length and height grow exponentially at the same pace, resulting in a constant steepness during dune growth (figure 3.6). See Appendix 6 for the bed profiles of experiment T23 and T24. The observed equilibrium dune dimensions are obtained by estimating the asymptote for the dune
Figure 3.5 Two types of sand wave movement (Nikora et al. 1997)
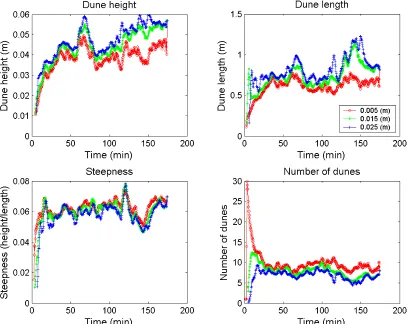
dimension plots (figure 3.5). The three lines show that dune dimensions depend on the definition of dune. When dunes smaller than 0.025 m are filtered out, obviously the number of dunes is smaller than for a threshold dune height of 0.005. This results consequently in higher mean dune lengths and heights because the smallest (lower and shorter) are filtered out. The mean dune dimensions agree nevertheless with the expected dune dimensions as seen in table 3.3 and 3.4.
Figure 3.6: Dune dimensions (height, length, steepness and number of dunes) during dune development (T22, flow depth 150 mm d50 = 0.85 mm)
for different minimum dune heights (red = 0.005, green = 0.015 and blue = 0.025 )
Dune length is not constant during the various stages of dune development, but increases over time. As a result of dune development, roughness of the bed increases. Because the discharge is kept at a constant value, water levels increase during dune growth. This effect can be seen in figure 3.7.
Water level rise
0 50 100 150 200 250
0 50 100 150 200
Time [min]
W
a
te
rd
e
p
th
[
m
m
]
34 3 FLUME EXPERIMENTS Starting with a water depth of 0.15 m, the water depth increases to an equilibrium value of 0.20 m. Dune heights stabilize at a value of 0.05 m (figure 3.6) with a dune length of 0.75 m, resulting in an aspect ratio, or steepness(∆/L) of 1/17. The corresponding water level rise is 5 cm which is an increase of 30%.
3.3 Possible dune splitting mechanisms
The observation of equilibrium dune dimensions experiments show a dynamic equilibrium because splitting and merging both take place. The cause for dune splitting is not obvious, but the observations have lead to possible dune splitting mechanisms:
Random pile ups by turbulence bursting
Turbulent bursting is observed to create pile-ups superimposed on stoss sides. These pile-ups can develop into small dunes and develop a lee side. It is unknown why some disturbances survive and other disappear almost instantaneous. They migrate at high celerities in downstream direction, filling the lee side of the underlying dune or creating their own flow separation zone. The random initiation of superimposed wavelets seems to be one of the main mechanism for dune splitting
Suspended sediment transport
Suspended sediment transport over a crest is observed during the experiments. In contrast to the DuDe model, this means that not all sediment is used to migrate the lee side. A part of the sediment is deposited on the stoss side of a downstream dune. This effect is stronger when dunes become higher. This could be a trigger for new dune initiation and therewith for dune splitting.
HIGHLIGHTSChapter 3: Flume experiments
• Flume experiments show the existence of a dynamic equilibrium where dunes split and
merge continuously.
• During the initiation of dunes, asymmetry and flow separation appear within the first
minute of dune development from flat bed.
• Superposed sand wavelets split long stoss sides (>1.20m) and decrease the migration
rate of underlying dunes.
• Random initiation as a result of turbulence bursting and the deposition of suspended
4
Implementing dune splitting
Section 2.4 shows the output of model simulations performed with the DuDe model to investigate the current behaviour of the model. The initial behaviour differs from the observed initial behaviour in the experiments. Dunes grow and migrate as a result of the coupled system of flow equations and sediment transport formula. The migration rate of dunes in the DuDe model corresponds to the
values found during the experiments (≈4mhour-1). Dunes become asymmetric as observed during
the experiments (chapter 3). Asymmetry development differs slightly because, in the model it seems to occur as a non-linear effect of the acceleration of water flow over the dunes. This is in contrast to the flume experiments where asymmetry is observed instantaneous.
The presence of merging dunes with varying celerities as observed in model simulations is confirmed by the flume experiments. Dunes overtake and migrate together at a lower celerity. The reason for dune lengths to grow infinite in the model simulations is the lack of a splitting mechanism in the DuDe model. Equilibrium dimensions perceived during the experiments which can be estimated by equilibrium predictors are not observed during model simulations. This chapter will evaluate the model behaviour and
4.1 Model behaviour
Influence of periodic boundaries
To investigate whether the non-linear effect of parameterization of flow separation causes continuous merging of dunes, and therefore prevents dunes from splitting or reaching equilibrium dimensions, model simulations have been conducted without the parameterization of flow separation. These model simulations show interesting results. Figure 4.1 shows that even without the occurrence of a flow separation zone large dunes do overtake or dissolve smaller dunes.
Figure 4.1: Periodic boundaries causing dunes to merge.
The dune that “enters” the domain around the 45th minute completely fades away in the shadow
of the upstream dune. When we track this dune back to t = 40 minutes, the dune height and length of the overtaking dune are both smaller than the dune that becomes overtaken. So, dune height and length are not the explanation for this behaviour.
A few minutes later the overtaking of dunes during the absence of parameterization of flow separation becomes even more obvious. Only three dunes remain after 80 minutes.
36 4 IMPLEMENTING DUNE SPLITTING ‘False’ equilibrium
Paarlberg et al. (2006) describe that after sufficiently long time the dune height stabilizes and dunes do not grow, but only migrate. They refer to this phenomenon as a dynamic equilibrium. However, this equilibrium does not contain dynamics as observed in equilibrium during flume experiments. An equilibrium perceived during flume experiments or field studies is dynamic because dunes merge, split, overtake and dissolve, while the mean dimensions remain fairly constant.
Figure 4.2: Development of a false equilibrium (H=0.15 d50 = 0.85*10-3 )
Model simulations lead to an equilibrium dune height after a sufficiently long time (figure 4.2). The dune height stabilizes and the water level elevation as a result of increased roughness also reaches an equilibrium. This result is in accordance with the outcomes of the dune experiments described in section 3.2, where a water level rise of 30% is perceived, shown in figure 2.4. The modelled equilibrium however, has a different cause. A visualization of the equilibrium state of this model simulation (Figure 4.3) shows that it is a rather static equilibrium. The equilibrium length is forced by the length of the domain with periodic boundaries. The equilibrium height is observed, because dune length and height are interrelated. The dune length reaches a maximum (L = 1 m). The dune height will not grow to infinity but also reaches an equilibrium (∆ = 0.046 m) when the dune length reaches the length of the periodic model domain.
0 0.2 0.4 0.6 0.8 1
130 135 140 145 150
x [m]
t
[m
in
]
0.02 m
Figure 4.3: A dune has reached maximum dimensions for this domain length
The expected aspect ratio (∆/L) based on the method of Van Rijn (1993), varies between 0.04 and 0.06 (1/25 - 1/17), for Julien & Klaassen (1995) this ratio varies between 0.085 and 0.095 (1/12 - 1/10). The model is therefore, with an equilibrium aspect ratio (∆/L = 1/22) in reasonable agreement with these predictors.
The modelled height, however, does not reach an equilibrium as a result of a physical balance, but is limited by the periodic boundaries.
This makes the equilibrium dimensions highly dependent of the chosen domain length. The aspect ratio as predicted by the DuDe model is not constant. The equilibrium height of dunes is, given the absence of a splitting mechanism, only limited by the domain length.
Domain length dependency
Figure 4.4: ‘False equilibrium’; Equilibrium dimensions are a function of the chosen domain length
The predicted equilibrium height of a dune can be described as a function of the domain length.
∆ = (0.0066Λ–0.0051)1/2 (∆ = equilibrium height [m], Λ = domain length [m]).
More important however is the clear depency of the domain length. Because this limits the applicability of the model for larger domains. This leads to the first attempt to the improve the model by inducing splitting by a random disturbance.
4.2 Random disturbance
interaction of the flow and sediment equations. This, however, cannot take place from a theoretical perfect flat bed. Initially this model needs bed gradients (hx ≠ 0). The initiation of new/superposed dunes also needs an irregularity in the bed profile. The type of disturbance and the results of these model changes are described in this section.As a result of the simplified flow equations, random pile ups of grains or turbulence bursts do not occur in the model simulations. Raudkivi (2006) states that, the knowledge of these flow structures is still insufficient to enable rigorous analytical modelling of the processes at the sand-water interface. Therefore the attempt is made to initiate new dunes by introducing a random disturbance
signal every 10th time step, to imitate the influence of turbulent flow structures on the bed. The
random signal is applied under the condition that no flow separation was present to avoid numerical difficulties in determining the parameterized bed over a disturbed bed. The maximum
value of this disturbance was set to two grain diameters (2*d50). The spacing (∆x) has the same
value as the spacing in the calculation (∆x = 0.01m) As seen in figure 4.1 the disturbance is added
every 10th time step. When the frequency of the disturbance is increased (e.g. every time step)
dune development depends too strong on the disturbance. The bed then becomes an accumulation of disturbances instead of an outcome of the model equations.
38 4 IMPLEMENTING DUNE SPLITTING
Figure 4.5 Diffusion of the superposed signal
Figure 4.5 shows the strong diffusion of the applied disturbance and growth of the applied disturbance or scouring of the underlying dune is not perceived. This rises the question whether a domain-filling random disturbance can initiate new dunes. For a random signal to grow and develop into a new dune on top of the parent dune, a wavelength smaller than the wavelength of the parent dune has to show growth. To investigate whether a wavelength exists that grows given the physics incorporated in the model a simple numerical stability analysis is performed.
Several attempts to implement a continuous disturbance did not lead to growth of superposed bed forms, let alone the splitting of long dunes. The success of new dune initiation as a mechanism to inhibit the dune length growth in the DuDe model depends on the possibility of these new dunes to develop. In order to obtain a successful splitting mechanism, growth of new dunes has to be supported by the initial behaviour of the model. Therefore a stability analysis is conducted to examine the growth of superposed bed forms with various wavelengths on top of an existing bed profile (Appendix 9).
Figure 4.6: Numerical stability analysis for sinusoidal bed disturbances with differing wavelengths
4.3 Stabilizing effect of slope terms
The stability analysis for the current model settings has lead to the conclusion that the fastest growing wavelength is in accordance with the equilibrium predictors but differs from the initial dunes observed during the flume experiments. New dunes do not grow, because only large dunes perceive growth. The model contains several parameters that can influence the fastest growing wavelength and therefore can change the possible success of a random disturbance on the equilibrium dune dimensions. Two of these parameters are the slope terms λ1and λ2. The growth of river dunes is said to be driven by the phase lag between the bed configuration and the bed shear stress. The slope effects as described in section 2.2 have an important role in the stability of a certain wavelength. To investigate whether the slope terms, influence the fastest growing wavelength, the stability analysis conducted in the previous section is repeated for different slope parameters.
for
φ
sincreasingly increases the flux downslope and decreases the sediment flux upslope.These qualitative hypotheses are also seen in the numerical stability analyses. The next page
shows the stability plots for several values
φ
s. See table 4.1 for the corresponding lambda value.The influence of these slope parameters is clear (figure 4.7). The fastest growing mode for an angle of repose of 63º, is approximately 0.3 m, in contrast to 1.2 m for a natural angle of repose. However, this is not a realistic value for the angle of repose, which ranges naturally between 25º and 35�