“ O P E R A T I O N A L P R O C E S S I N N O V A T I O N ”
‘I MPROV IN G T H E FI T BE T W EE N O P ER AT ION A L P RO CE S S
AN D CO MP ET IT IV E F LE X IB IL IT Y AT G M T HE F U RN ITU R E
“Operational Process Innovation”
‘Improving the fit between operational process and competitive flexibility at GM the Furniture Factory’
April 2008
Master’s thesis of: Ron Peeks
Student nr: s0132314
Master Business Administration
On behalf of:
GM ‘the Furniture Factory’ Bedrijvenpark Twente 316 Post office box 415 7600 AK Almelo +31 (0)546 57 30 25
Graduation committee:
ir. S.J.A. Löwik (University of Twente, School of Management and Governance) dr. ir. J.M.J. Schutten (University of Twente, School of Management and Governance) R. Kleis (Managing director GM ‘the Furniture Factory’)
University of Twente
School of Management and Governance Post office box 217
PREFACE
As a student of the School of Management and Governance, on the University of Twente, I was given the opportunity to perform my gradation assignment at GM ‘the Furniture Factory’. From the first with meeting with the management of GM, it was clear that its production methods did not fit the current market demands. During the following meetings, we refined the different symptoms into an overall problem, namely not enough competitive flexibility.
This document is meant for those that are interested in the concept of competitive flexibility, competitive objectives, and the changes that are needed to give a company a higher competitive flexibility. Within this research project, these changes are focussed on operations planning & control. For GM, additional recommendations will be made for future development
This research project would not have been possible without the help of several people:
n The counselling of Mr. Löwik and Mr. Schutten from the University of Twente. n Mr. Kleis for giving me this opportunity, and his counselling during the project. n The employees of GM for their ideas, thoughts, and cooperation.
n Ilonka Maathuis for reviewing this document and her support. n My dear mother Coby Aalders for her support.
n Jan Joost Stock for reviewing this document and the discussion evenings.
Yours truly, Ron Peeks
SUMMARY
GM ‘the Furniture Factory’ is a manufacturer producing both cabinets and tables for living rooms. The company has about 50 employees, and an annual turnover of around 3.5 to 4 million euros. In order to stay competitive inside the higher segment of the market, GM wants to focus more on flexibility. Therefore the overall goal of this research project is:
The goal of the research is to advice GM on how to improve its operation process design and operation planning & control in order to fit with the strategic focus on competitive flexibility.
Competitive flexibility is defined as the ability for a company to produce non-standard orders, to introduce new products, and to accelerate and decelerate production quickly. It is also directly related to three other competitive objectives, specifically cost, quality, and delivery. Because they are directly related, all four objectives are measured during this research project.
In order to improve competitive flexibility it is important to create an intermittent operation. This means that a company has to choose between a project, jobbing, or batch process, in combination with a design-to-order, buy-to-order, or make-to-order strategy. The order penetration point (OPP) is than placed upstream as much as possible.
Within GM’s current situation there are several problems; Competitive flexibility is too low, inventory value is too high, and delivery reliability too low. The OPP is placed at an inventory for semi-finished-products, after which the parts are assembled, varnished or painted, and shipped to the customer. The production is controlled using a MRP like system.
For the desired situation, levels are set for each competitive objective. In order to achieve these levels, the OPP is replaced further upstream, creating a buy-to-order strategy. The option for design-to-order is therefore also possible if a customer wants to customise its products. To plan and control the process, Conwip is used with a slight alteration. Only using a maximum WIP, instead of keeping it constant makes it possible to solely produce customer orders. It will however require a more flexible workforce. Next to Conwip, implementation of different lean principles is needed to reduce the chance for errors, and further improve performance. However, these are not implemented within the experimental situation.
For the experiment, two concessions are made concerning the process design. The experimental flow is not a complete buy-to-order strategy, and a small inventory was created near the assembly activity. These concessions are needed, to implement the experimental situation into the current situation. Next to Conwip, Kanban is being used to plan and control two different process flows. The results of the experiment on all of the competitive objectives are promising. The indicators direct costs, error free production, and volume flexibility are already within the level of the desired situation. The other indicators show improvement towards the current situation, but have not reached the desired state.
CONTEN TS
2.2 Competitive Objectives and Market Demand 13
2.2.1 Market Evolution
2.2.2 Competitive Objectives and the Market Evolution 2.2.3 Defining Competitive Flexibility
3.1 Relationship between Flexibility and Operations Management 19 3.1.1 Operations Management
3.1.2 Operations Management and Competitive Objectives
3.2 Operations Design and Competitive Flexibility 20
3.2.1 Operations Process Type Continuum 3.2.2 Product Strategies
3.2.3 Push and Pull Strategies 3.2.4 Theory of Contraints (TOC)
3.3 Flexibility in Operations Planning & Control 23 3.3.1 Methods for planning & Control
4.2.3 Analysis of the current Process Design
4.3 Current Method for Planning and Control 34
4.3.1 Standard Method for Planning and Control 4.3.2 Introduction of Kanban
5.1.2 Quality
5.3 Desired Method for Planning and Control 42
5.3.1 Desired Manufacturing Control System
6.1.1 Combining the Desired and Current Situation 6.1.2 Meetings with Employees
6.3 Method for Planning & Control 51
6.3.1 Experimental Manufacturing Control System
8.2.5 Planning and Confirmation of Customer Orders
8.3 Discussion 65
9 REFERENCES 66
9.1 Books 66
1 IN TRODUCTION
Within this first chapter we give an introduction into the research project that is performed for GM ‘the Furniture Factory’. Section 1.1, gives a view on the research background clarifying the problems at GM, which are the starting points of the research project. Within Section 1.2, we present the research goal and problem statement, after which we describe the different research questions. Finally, the research model will give an overview of the research questions in how they relate to each other. Also here we describe which strategy we will use to answer the research questions.
1.1 ORGANISATIONAL INFORMATION
1.1.1 BRANCHE DESCRIPTION
The Netherlands has over 8.300 retailers selling different kinds of furniture, divided over several branches. GM only serves the ‘hard furniture’ market by manufacturing both cabinets and tables for living rooms. With their cabinets and tables, GM aims for the higher quality and price segment of this market. This means that GM’s direct competitors are within the higher quality price segment, and are therefore competing within a same range of cost/quality ratio. This is largely the result of the manufacturers using the same kind of raw material, because the high prices for hardwood cover a large part of the production costs. This means that the use of different quality in raw materials is responsible for the large gap between the lower and higher price segment within the market.
During the year of 2001, sales within the furniture market dropped, resulting in a decline over the years 2002 until 2005 (see Appendix A). Due to the higher competition and a lower turnover, many furniture manufactures where forced to close down. Within the years 2006 and 2007, there is an increase in sales, although, on average, the turnover within the branch is still lower than prior to 2001.
The competition on cost and quality has dominated the market for many years, however, with the arrival of more competitors from low-wage countries, this focus shifted away from cost to other competitive priorities.
1.1.2 GM ‘THE FURNITURE FACTORY’
GM ‘the Furniture Factory’ was founded in 1966 under the name of Ganzeboom. GM is a private company owned and managed by R. Kleis, with a single factory located in the city of Almelo, the Netherlands. The company had an annual turnover of around 3.5 million euros over the year 2006. Within the year 2002, annual turnover was about 4.2 million euros. This is a decrease of 16.7% over 5 years, which is higher than the branch average (-12%).
The company has about 50 employees divided over 9 manufacturing departments, 2 commercial departments, and 3 staff functions. The manufacturing departments are managed by the production manager, who is responsible for planning and controlling the production. Recently, a new commercial manager was hired to manage both the internal and external commercial departments. Appendix B gives an overview of the company structure. GM can employ more than 50 people with the current machine capacity, but due to the loss of turnover within the year 2001, a reorganisation was needed.
1.1.3 PROBLEM BACKGROUND
In order to stay competitive inside the higher segment of the market, GM wants to focus more on flexibility. To achieve this, GM has already extended their assortment a few times over the last couple of years. Combined with an ‘assemble-to-order’ strategy, this resulted in a high inventory value (1.6 million euros in 2006), with most of the products in stock having a turnover of more then 4 months. Next to this, GM wants to offer customers the possibility to customise the standard designs of the assortment.
This research will focus on the following points:
n Competitive flexibility in general is not high enough.
n High variety in assortment has resulted into a high inventory value.
n Customers should be able to customise the standard products from the assortment.
To achieve a higher flexibility at GM, changes will have to be made in its operations management and in particular its operations process, and planning & control. These changes should be focused to create a better fit with GM’s competitive objectives and operations management.
1.2 RESEARCH OBJECTIVE
1.2.1 GOAL AND PROBLEM STATEMENT
From the organisational information above, we summarised the overall research goal in the following statement:
The goal of the research is to advice GM on how to improve its operation process design and operation planning & control in order to fit the strategic focus on competitive flexibility.
This results in the following central research question:
What are the changes needed regarding GM’s operation process design, and operation planning & control, in order to improve the fit between the GM’s operations management and strategic focus on competitive flexibility?
1.2.2 RESEARCH QUESTIONS
In order to achieve the goal and address the problem stated above, we divide the central question into several research questions. Each of these questions contributes to the fulfilment of the research goal without broadening it:
1) How can flexibility as a competitive objective be measured at GM?
1.1) What is competitive flexibility?
1.2) What is the relationship between competitive objectives and market
demand?
1.3) What are the measures for competitive objectives?
2) What does the theory explain on operations process design regarding flexibility?
2.1) What is the relationship between flexibility and operations process design?
2.2) Which type of operations design fits a flexible operation?
2.3) Which methods for planning & control fit a flexible organisation?
3) In what way is GM currently managing its operations regarding a single collection?
3.1) Which collection is a good representation of GM's current assortment?
3.2) What is the design of the current process?
3.3) Which method is being used for planning & control?
3.4) What are the measures of the current situation regarding the competitive
objectives?
4) What would be a desired method to manage GM's operations in order to become more flexible?
4.1) What are the desired levels for the competitive objectives?
4.2) What is the desired operational process design for GM?
4.3) Which method should GM use for planning & controlling its operation?
5) What are the effects on the competitive objectives of the single collection after changing the operation design, and operation planning & control?
5.1) What is the new operation process design for the collection?
5.2) Which method for planning & control is used for the collection?
5.3) What are the measures of the experimental situation regarding the
competitive objectives?
6) Which changes does GM have to implement in order to reach the desired situation?
6.1) Which of GM's collections should be included within the implementation?
6.2) In what way do the collections relate to the experimental one?
6.3) What are the steps needed to change all the desired collections?
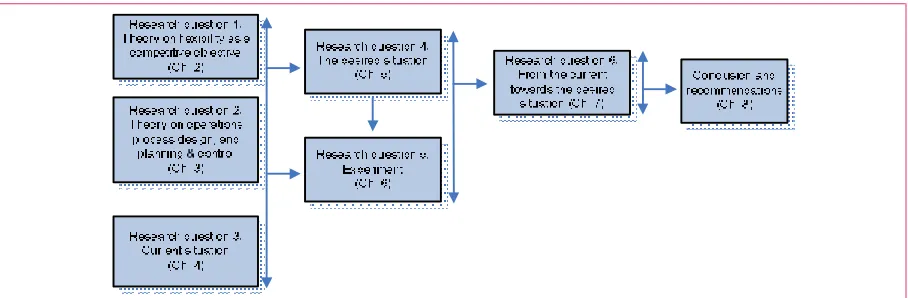
1.2.3 RESEARCH MODEL
Figure 1-1: Research Model (A vertical arrow resembles confrontation between the objects, from which the horizontal lines represent a conclusion)
1) GM strategically wants to focus more on flexibility as a competitive objective. Flexibility is a broad concept and can be explained in many different ways. Therefore, the answer to this research question will give a description of flexibility within the concept of competitive objectives. Each of the competitive objectives will be made operational for measurements throughout this research. To answer this research question we will use literature research on the theory of competitive objectives. 2) In order to increase the competitive flexibility, a fit has to be created with GM’s
operations process. For explanation of the fit with flexibility, this question will give a description of both operation process design, and operation planning & control. In order to focus this question, it will be answered using literature research on the theory of operations management regarding flexibility.
3) An analysis of the current situation regarding GM’s operation process design, and operation planning & control is necessary in order to describe the needed changes in this research. This part of the research will be focussed on a single collection of GM’s assortment, in order to create a more profound and practical result for GM. The analysis will be based upon observation of the current operation.
4) From both the theory on flexibility, operations management, and the current situation, a desired state can be described for GM regarding its operation process design, and operation planning & control. We answer this question with the literature research conducted for the first two questions.
5) The focus on a single collection gives the opportunity to experiment on its operational process design, and operational planning & control. The experiment is conducted in order to analyse the effects of the changes on the competitive objective. 6) From the experiment we will describe an implementation plan including the steps that can be taken by GM in order to reach the desired situation. This question will include an analysis of GM’s collections regarding their fit with the experimental collection, and live cycle so that ‘old’ collections can be left out of the implementation plan. Also the results of the experiment will be analysed in relation to the desired situation. These two steps will be the basis to describe the steps that GM has to take towards the desired situation.
1.3 READING GUIDE
The goal of this research project is to advice GM on how to improve its operation process design and operation planning & control in order to fit the strategic focus on competitive flexibility. This document is therefore divided into 9 chapters, each describing a single step of our research project. After reading this introduction, the reason, goal, problem statement, research questions, and working method should be clear. The chapters 2 to 7 will each concern one of the research questions.
Within the Chapters 2 and 3, a theoretical framework will be formed. Chapter 2 describes four competitive objectives and their relation to both the market and each other. Also, each competitive objective is made operational for measurement during this research project. Chapter 3 describes the theory on Operations Management relevant to this research project, including operations designs, and methods for planning and control.
Chapter 4 describes the current situation within GM, focussing on a single collection. The process design for the chosen collection is described, including a description of the factory layout and production flows. Also, the current method for planning and control is described, and the four competitive objectives are measured.
The desired situation is described in Chapter 5, based upon the desired levels for each competitive objective. Based upon the desired levels, a desired process design and method for planning and control is described, including several Lean Manufacturing principles.
Within Chapter 6, the experiment is described and analysed. The experiment is defined, and the steps that are taken for implementation are given. The alterations made to the desired process flow are explained, and the experimental method for planning and control is described. At the end of the chapter, the four competitive objectives are measured and analysed.
Chapter 7 describes an implementation plan including an analysis of GM’s assortment and the steps taken during the experiment. The assortment of GM is described and each collection is compared to the experimental collection. After which, a possible implementation plan is presented to reach the desired situation.
2 COMPETITI VE OBJECTIVES THEORY
This chapter provides an insight into the theory on competitive objectives, focussing on what is relevant to this research. First, a definition of flexibility as a competitive objective will be given. This definition will be used throughout the project. Due to the fact that competitive flexibility is one of several competitive objectives, we will describe all of the objectives in relation to the market demand. Finally, Section 2.3, presents measures for each of the objectives, which will be used throughout this research project.
2.1 COMPETITIVE FLEXIBILITY
2.1.1 COMPETITIVE PRIORITIES TRADE-OFFS
Companies have to choose on which of the competitive objectives (or priorities) they want to focus. This does not mean that they should forget others competitive objectives, but prioritising means that when creating an operations strategy, trade-offs will have to be made (Skinner, 1978). When a company is using a higher quality and therefore more costly resources, it will lower their chance of having the lowest price on the market. The same holds for companies that are focussing on flexibility, as they tend to have more general-purpose equipment that can be used to make many different kinds of products. Making a customised product will take more time, as it is impossible to sell directly from stock, and machine setup time will be longer per product. Both price and delivery time are still important to minimize, although in this example a higher quality and flexibility is preferred.
2.2 COMPETITIVE OBJECTIVES AND MARKET DEMAND
2.2.1 MARKET EVOLUTION
The world is constantly changing, as are consumers and therefore product markets. Bolwijn & Kumpe (1998) describe a theory in which the market demands develop in a logical order. For each of the different market demands, they describe an ideal type of firm. Figure 2-1, presents the relation between market demands, performance criteria, and ideal firm types.
Year Market demand Performance criteria Company (ideal firm type)
1960's Price Efficiency The efficient firm
1970's Price, quality Efficiency + quality The quality firm
1980's Price, quality,
Figure 2-1: Market demands, performance, and ideal firm types (Bolwijn & Kumpe, 1998, p.95)
n Price - Up to the 1960’s, the only important market demand was the product price.
To meet this demand, companies were competing only on efficiency trying to produce as cheap as possible. The ideal type is therefore an efficient firm.
n Quality - Around 1970, product quality as a market demand is getting more and more
to less money being spent on defects, repairs, malfunctions in the production process, and service costs. Mastering both efficiency and quality are the traits for a quality firm.
n Flexibility - In the 1980’s, leading companies that have mastered both quality and
price are seeking new ways in order to gain competitive advantage. Strategic choices are made to speed up introduction of new products. The product life-cycle diminishes, the amount of product types rises, and delivery time is being reduced. The demand from the market for a wider assortment and shortening of the delivery time are manifesting themselves into a demand for a more flexibility firm.
n Innovation - Entering the 1990’s, again there are several companies that have
implemented the changes needed to suit the new market demands. By then these companies are already trying to use technological innovations as their competitive advantage. The ability to quickly embed new technology into products and processes is getting more important. An innovative firm is therefore demanded.
2.2.2 COMPETITIVE OBJECTIVES AND THE MARKET EVOLUTION
Companies are trying to meet the demands of the customer through their competitive objectives. The competitive objectives from Wheelwright cannot directly be related to the theory of Bolwijn and Kumpe. For each concept that is within both theories, different definitions are being used. Figure 2-2 presents several common market demands demonstrating the differences between the two theories. These market demands are; (a) low price, (b) high quality, (c) fast delivery, (d) reliable delivery, (e) the ability to change the quantity of products and services, (f) wide range of products and services, and (g) innovative products and services. Both theories include all of these market demands and use the same demands for their concepts for cost and quality. Bolwijn and Kumpe see flexibility as the market demands (c), (d), (e), and (f), and use a separate definition for innovation (g). Wheelwright sees the market demands (c) and (d) as delivery, and the demands (e), (f), and (g) as flexibility.
Bolwijn & Kumpe Weelwright
Figure 2-2: Market demands related to the theory of both Wheelwright, and Bolwijn and Kumpe
Bolwijn & Kumpe recognise that adding a new objective can even improve performance on previous objectives.
2.2.3 DEFINING COMPETITIVE FLEXIBILITY
The concept of flexibility has been a popular topic for researchers in the past few years and several theories have been developed. For this research project, the focus is on flexibility as a competitive objective, or flexibility offered to the customer. For GM flexibility is important in order to offer customers a wider range of choices within their assortment and their individual products. Also being able to offer products to different customers is important, for instance not only producing housing furniture but also interior furniture for businesses.
Many different authors have used competitive objectives as a basis for their research throughout the past 40 years (Skinner, 1978; Wheelwright, 1978; Van Dierdonck and Miller, 1980). Although many authors use different definitions for the competitive objectives, the overall theory remains the same. Within this research, four different competitive objectives are being used, specifically price, quality, delivery (or dependability), and flexibility. Competitive flexibility consists of product and volume flexibility. Volume flexibility is the ability for a company to accelerate and decelerate production very quickly. Companies that compete on the basis of product flexibility emphasise their ability to handle more non-standard or customised orders and lead in new product introductions. From this description we defined the following definition for flexibility:
Competitive flexibility is the ability for a company to produce non-standard orders, to introduce new products, and to accelerate and decelerate production quickly.
2.3 MEASURING COMPETITIVES OBJECTIVES
Within this section, the four competitive objectives (cost, quality, delivery, and flexibility) are made operational. For each of the objectives several indicators are described, which we will use for measurement throughout this research project.
2.3.1 COST
The ability of a company to manufacture and distribute a product at low costs gives it a competitive advantage. This can be achieved by reducing production costs, reducing inventory, and increasing equipment utilization. Since so many variables have an effect on costs, often measures as return on sales, inventory turnover, and return on assets are being used (Wheelwright, 1978). Because this research project is focussed on a single collection, the direct and indirect costs of the production will be used as a measure.
Direct Cost
Direct costs are expenses that change in proportion to the output and which are directly accountable towards a particular product. At GM the direct costs are calculated by a sum of the resource, machine, and labour costs. The amount of resources needed for a particular product, are calculated in the designing phase. The actual resource costs may alter over time due to inflation, change of suppliers, or usage of new machines. The machine and labour costs are calculated by multiplying the total production time with the corresponding cost per hour.
Indirect Costs
the overall direct costs are calculated and divided over the different collection according to sales. For this research project, the only indirect costs that are eligible for change are the inventory holding costs. These holding (inventory) costs can be determined by adding up three cost components (Reid & Sanders, 2005): capital costs, storage costs, and risk costs.
In order to measure the holding costs for a single collection, we will calculate the percentage for holding costs over the total inventory value. For the capital costs, GM currently calculates 5% over the total inventory value, which is the interest rate the company has to pay over borrowed money. The storage costs include the warehouse and employee costs. For the total storage costs, GM calculates € 90.000 a year which is about 7.5% of the total inventory value. The risk costs are measured at GM by the costs that are lost due to products not being sold, or being sold below the cost price. The total cost of risks over 2006 was € 140.000, which is equal to 11.7% of the total inventory value. For further measurement of the inventory cost, 24.2% (5% interest + 7.5% storage + 11.7% risk costs) over the calculated inventory value will be used, to measure the inventory cost per year.
2.3.2 QUALITY
Product quality itself is a broad concept, and it is therefore important to differentiate between actual quality and perceived quality, as well as high performance and error free production (Wheelwright 1978). Perceived quality refers to the way a customer sees a particular product, and is therefore very difficult to measure.
Performance Quality
The performance of a product is decided at the designing phase of product development, where the choices for the actual design and materials are made. Since the design phase of product development is outside the scope of this project, this criterion will not be used within this research.
Error Free Production
As soon as a product is developed, error free production is important to keep every product that is being produced consistent with the original design. The consistency with the design can be checked on several points within the operations flow. When errors occur it often costs extra money to correct them. To get an overview of the total cost of internal errors, we calculate it in relation to the direct costs.
2.3.3 DELIVERY
The criteria for delivery can be related both to the speed of the product delivery (delivery time), and the ability to consistently meet delivery standards or promises (delivery reliability) (Van Dierdonck and Miller, 1980). If delivery time is an important competitive priority, the company will have to critically analyze its operations system and improve, combine, or even eliminate processes in order to save time. This can for instance be done by using technology to speed up processes, and relying on a flexible workforce to meet peak demand periods. For on-time delivery, it is important that realistic delivery times are being communicated towards customers.
Delivery Time
Delivery Reliability
The reliability of delivery is calculated by dividing the amount of on time orders by the total order sum within a particular time period. Each order is planned by GM based either upon the standard delivery time or the requested delivery time by the customer. This planned delivery time is then communicated with the customer and is the basis for the delivery reliability.
2.3.4 FLEXIBILITY
This criterion refers to the ability to respond quickly to changes in demand or new product opportunities. It covers three important aspects, namely product flexibility, volume flexibility, and change-over flexibility (Wheelwright, 1978). Competing on the basis of product flexibility means that a company is able to quickly introduce new products into the market (Change-over flexibility), and handle a wide variety of products or customized orders (Mix flexibility). Volume flexibility stands for the ability to accelerate or decelerate the production of goods, in order to accommodate market changes.
Volume Flexibility
For an organization it is important to quickly adept to market changes, it can therefore be necessary to accelerate or decelerate the production. Because we are unable to measure the exact acceleration and deceleration rate for GM, we will measure the volume range GM can produce. This will show us the range in which GM can either accelerate or decelerate.
Mix Flexibility
Mix flexibility measures the variety of the collections or width of the assortment. It can be measured by the total of choices a customer can make within the assortment or a particular collection.
Change-Over Flexibility
Change-over flexibility stands for the ability to quickly introduce new products into the market. It can therefore be measured by calculating the time that is needed to develop and produce new products. As explained before, the design phase of product development is not within the scope of this project and will therefore not be measured as such. Because the throughput time is part of the time to market and within the scope of this project, we will measure it as indicator for the change-over flexibility.
2.4 CONCLUSIONS
From the literature study, we can make several conclusions regarding the first research question, which are both interesting and relevant for this research:
n What is competitive flexibility?
Based upon several different insights on competitive objectives, we have given a single definition for competitive flexibility, namely: Competitive flexibility is the ability for a company to produce non-standard orders, to introduce new products, and to accelerate and decelerate production quickly. The definition is related towards the focus of this research and the situation of GM. According to the theory of trade-offs it is important to measure all competitive objectives when changing the focus towards flexibility.
n What is the relationship between competitive objectives and market demand?
Weelwright explains that trade-offs have to be made by a company between the several competitive objectives.
n What are the measures for competitive objectives?
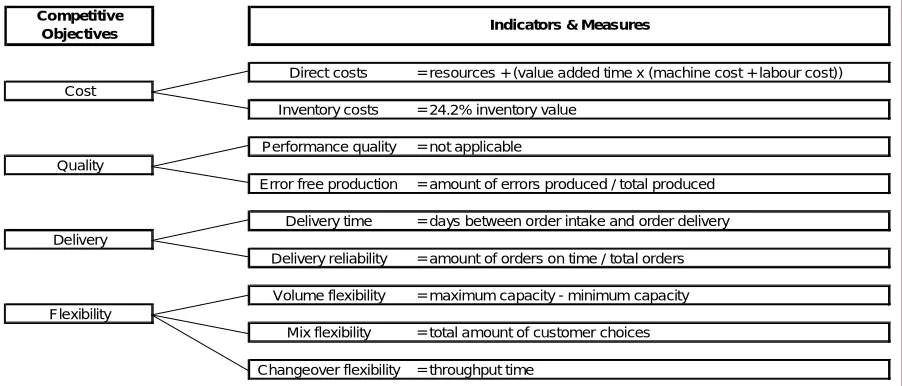
For each competitive objective at least one measure is given so that all objectives can be analysed during this research project. The four competitive objectives we explained within this chapter are presented in Figure 2-3 together with their indicators and measures.
Competitive Objectives
Direct costs = resources + (value added time x (machine cost + labour cost)) Cost
Inventory costs = 24.2% inventory value
Performance quality = not applicable Quality
Error free production = amount of errors produced / total produced
Delivery time = days between order intake and order delivery Delivery
Delivery reliability = amount of orders on time / total orders
Volume flexibility = maximum capacity - minimum capacity Flexibility
Mix flexibility = total amount of customer choices
Changeover flexibility = throughput time
Indicators & Measures
3 OPERATIONS MANAGEMENT THEORY
This chapter describes the theory on operations process design and planning & control in relation to competitive flexibility. Section 3.1, explains the term operations management (OM) in order to clarify the relationship between the concepts; process design, and planning & control. Also, this section describes the relationship between OM and competitive objectives. Section 3.2, explains several types of operations design and product strategies. These designs and strategies are analysed for their fit with competitive flexibility. And finally, Section 3.3, describes different methods for planning and control that are relevant to this research project, and analyse their fit with competitive flexibility.
3.1 RELATIONSHIP BETWEEN FLEXIBILITY AND OPERATIONS MANAGEMENT
3.1.1 OPERATIONS MANAGEMENT
Operations management (OM) is defined as the design, operation, and improvement of the systems that create and deliver the organisations primary products and services (Chase et al., 2001). It is therefore a functional field of business with clear line management responsibilities. OM is concerned with the management of the entire system for the production of goods, involving all manufacturing resources like people, technology, information, and equipment as input, and sold company goods or services as output.
3.1.2 OPERATIONS MANAGEMENT AND COMPETITIVE OBJECTIVES
Operations Management is influenced by many different factors, as it is linked to customers and other parts of the enterprise. Figure 3-1 presents these vertical and horizontal links. The needs of the customer can be related to either existing products or new products. As explained in the previous chapter, the different customer demands can be related to four competitive objectives. The strategic operations choices that are made are partly based upon these competitive objectives. Also the operations strategy is connected to other business functions like for instance finance, R&D, and human resource management. The customer needs are also influenced by newly developed products, order fulfilment, and after sales service.
3.2 OPERATIONS DESIGN AND COMPETITIVE FLEXIBILITY
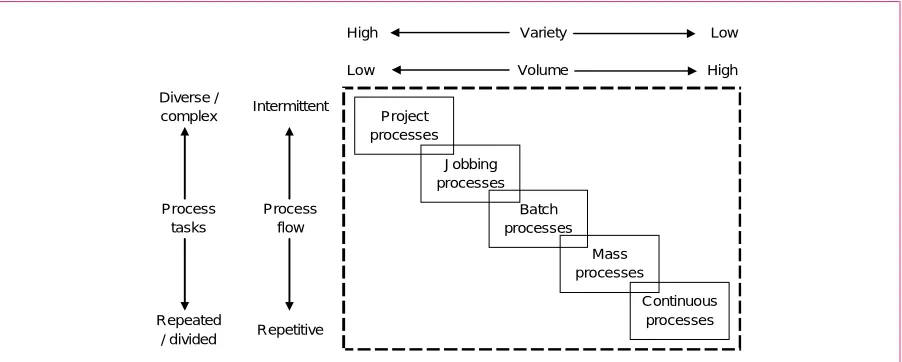
3.2.1 OPERATIONS PROCESS TYPE CONTINUUM
Process types are used to describe a particular general approach to managing processes. In manufacturing, these are project, jobbing, batch, mass, and continuous processes. Although several authors describe different types of processes, they can all be sorted using the four different dimensions of process tasks, process flow, variety, and volume (Slack et al., 2007). Figure 3-2 represents the five process types against the four dimensions. The dimension process task can range from diverse/complex to repeated/divided. Variety stands for the level of standardisation within products, in which a high variety is equal to a low level of standardisation. Volume describes the amount of products being created at once, ranging from a single product towards large numbers or even a continuous production. The type of process flow is a continuum between intermittent and repetitive operations:
Repetitive Operations
The repetitive operations are used to produce a high volume of products with a low variety. The resources within repetitive operations are organized into a line flow so that the production is highly efficient. The operations often rely heavily on technology and automation instead of labour skill, to increase output and thus improve efficiency. Repetitive operations are therefore more capital intensive than labour intensive.
Intermittent Operations
These operations are used to produce a high variety of products using a low volume. Production is often based directly on customer orders, creating the possibility for customised products. Because different products have a different way of manufacturing, there is hardly a standard route that all products follow through the facility. This means that workers need to be flexible and able to perform different tasks. As explained before, due to the high variety the available equipment has a more general purpose. Also automation is less common, because it is typically product specific and not cost efficient to invest in. Intermittent operations are therefore often labour intensive rather than capital intensive. Due to the low volume and high variety, intermittent operations can compete better on
3.2.2 PRODUCT STRATEGIES
The product and service strategy is directly related to the type of operation a company has in place (Reid and Sanders, 2005). For instance, due to their labour intensive nature, intermittent operations are less competitive on cost than repetitive operations. As the repetitive operation is able to mass produce a large volume of a single product, it is able to spread its design and equipment setup costs over a larger quantity. For the same reason, repetitive operations are less able to compete on flexibility. The competitive priorities as described above should therefore be ranked so that it fits the operations process. On the other hand, if a company wants to enter a market where most competitors are already flexible or even innovative firms, then a repetitive operation will not be basis for a good competitive position. A careful evaluation for the right production strategy is therefore required.
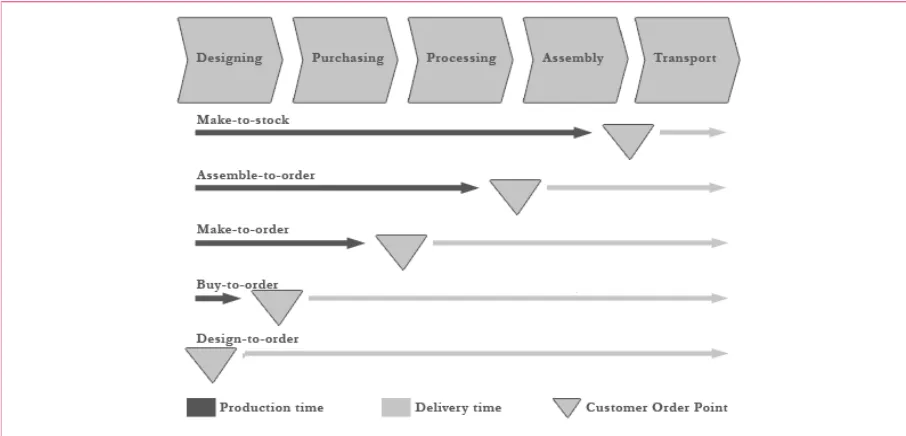
Product strategies differ both by the delivery lead time and by the degree of product customisation they offer. Delivery lead time stands for the amount of time needed from receiving an order to when the product is actually delivered. Several product strategies exist from designing the product based upon the customer’s requirements to selling finished products from stock. The change where an internal order becomes a customer order is called the Order Penetration Point (OPP) (Olhager, 2003). Figure 3-3 presents the different strategies.
A make-to-stock strategy produces finished products in anticipation of demand, making sure it is ready for immediate sale or delivery. It is largely used by companies producing large volumes of a standardized product, and is therefore typically seen in repetitive operations. Delivery lead time is the shortest, but the customer does not have any influence in the product design.
Assemble-to-order (or build-to-order) uses an in-between stock with standard product components that can be combined to customer specifications. This strategy results in a longer delivery lead time, but it leaves room for some customization.
To include customer influences even further, a make-to-order strategy can be used. Production starts as soon as a customer order has been received, resulting in an even longer delivery time, although more customisation is possible. The strategy is characterised by lower volumes and higher variety, and is therefore an example of an intermittent operation.
The buy-to-order strategy differs not much from the make-to-order, as it only includes the purchasing of the raw materials needed for the ordered products. It does, however, add a dimension towards the delivery reliability, as the production time is not only depending on the company itself but also its suppliers.
Figure 3-3: Product strategies (Olhager, 2003, p.320)
3.2.3 PUSH AND PULL STRATEGIES
The terms push and pull refer to the way the products are directed through a supply chain. The supply chain, logistics network, or supply network of a company is a coordinated system of information, resources, activities, people, and organizations involved in moving a product or service from supplier to customer. It therefore expands beyond the company itself. The difference between push and pull is the mechanism that triggers the movement of work within a system (Hopp and Spearman, 2000). Within push systems the demand (or forecast) for a particular product is recalculated towards an overall production planning. There is a signal that indicates that the materials have to be sent through the operations system. Each sub-process therefore receives a signal from the planning that certain materials have to be moved towards the next sub-process on a particular time. In a pull system each sub-process controls its own demand and sends requests towards its preceding (upstream) sub-process. Planning & control within a push system is therefore more centralised, and in pull systems more decentralised. Figure 3-4 presents an example of a push and pull system.
Example of a pull system Example of a push system
Production signal Full containers
Stock point
Stock point
...
...
Stock point
Stock point
...
Pull systems are often used in repetitive operations with an exception of true continuous processes (Schmidt and Ploos van Amstel, 2000). Although, as long as it is batch production, it is possible to use elements of pull systems inside intermittent operations. It is also possible to use both systems within the same factory, either by using a hybrid system of both, or the use of a push-pull interface (Hopp and Spearman, 2000). The push-pull interface acts like the OPP, dividing a production process into push and pull segments. In front of the push-pull interface, products are produced based upon stock level. In order to keep inventory as low as possible a pull system should be used for this flow. Behind the push-pull interface, the movement of products is triggered by money’ is often the most important part of a company’s goal. The bottleneck is the sub-process that has the lowest capacity of the company and is therefore limiting the total output. Goldratt explains that an hour lost on a bottleneck resource is equal to an hour lost for the whole production process. It is therefore important to constantly monitor the bottleneck. Also because the bottleneck defines the total output, it is important to balance the flow in order to reduce rising inventories at the bottleneck.
The concept on itself is a simplified model, although many planning & control methods recognise the existence of bottlenecks. Recognition of the bottleneck is also important while designing the operations process. As it sets the maximum capacity, it influences volume flexibility. When the change-over time is increased due to a higher mix-flexibility, capacity may be diminished. This could lower the throughput time and the total output of a factory. Controlling the bottleneck may therefore be an important precondition for the focus on competitive delivery and flexibility.
3.3 FLEXIBILITY IN OPERATIONS PLANNING & CONTROL
Within the literature, many different methods for planning & control are being developed and described by several authors. Some are merely variations on others or have evolved out of older methods. This section describes methods for operations planning & control, related to this research project. Section 3.3.1, describes methods such as Kanban, MRP, and Conwip, which control the WIP or throughput of a production flow. Section 3.3.2, describes the philosophy Lean Manufacturing and some of its methods. Although the goal of this research project is not to create a Lean environment, we feel that the individual methods can improve the competitive objectives. The methods described at Section 3.3.1 do not focus on all four of the competitive objectives. Lean methods can be used to control for instance the quality, or to improve the throughput time.
3.3.1 METHODS FOR PLANNING & CONTROL
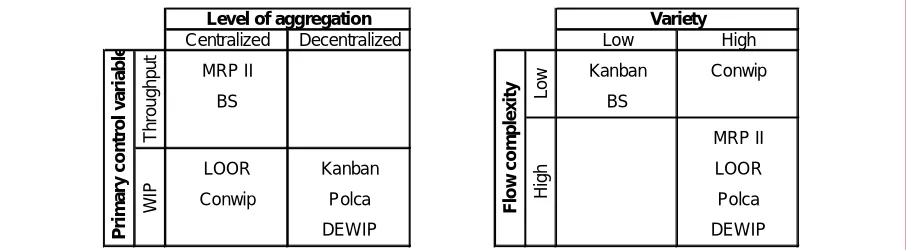
Many different methods for planning and control have been developed, because of the great importance of these systems for companies to reach their competitive objectives. The methods can be classified regarding their characteristics. Figure 3-5 classifies the methods based upon their primary control variable, level of aggregation, flow complexity, and variety.
Throughput is the primary control variable if the method controls throughput and observes WIP, whereas WIP is the method’s primary control variable if it controls the WIP level and observes throughput (Hopp and Spearman, 2000).
The variety (or variability) of products a method can handle is classified in either high or low. The complexity of the flow also ranges from low to high, where a low complexity can be compared to mass and continuous processes, and high complexity to project and jobbing processes. However, the classification of methods for both complexity and variety depend differs between authors.
Centralized Decentralized Low High
Figure 3-5: Classification of planning and control methods (Lödding et al., 2003, p.44)
BaseStock (BS)
Within the BS method, the base amount of inventory is maintained continuously. The inventory is replenished one unit at a time as random demands occur (Hopp and Spearman, 2000). Depending on the throughput time for delivery of products, the base stock level is set.
Resource Planning (MRP & MRP-II)
The Material Resource Planning (MRP) approach is one of the oldest methods, and uses a time-based materials planning for manufacturing process. Within MRP, the need for resources within the operations process is often calculated from a sales forecast. Based upon fixed throughput times, MRP calculates when particular resources need to be available (Bertrand et al., 1998). The management of production and materials purchasing is therefore centralised, pushing the production orders through the operations process.
Due to the disadvantages of MRP, new concepts were developed in the 1970’s based upon the techniques of MRP-I. Manufacturing Resource Planning (MRP-II) grew from these concepts and was further standardised over the years. Unlike MRP, it creates an overview of the available machine capacity, capital, and labour (Bertrand et al., 1998). Several parts of the company’s management system are combined into one planning and controlling system, with emphasis on passing through the planning and giving feedback on the feasibility of those plans. A large disadvantage of MRP-II is the needed calculative power for the planning and forecasting. Often, large and expensive ERP (Enterprise Resource Planning) software solutions are bought to resolve these issues.
Kanban
strict control rules to the buffer inventory (Huang and Kusiak, 1996). A Withdrawal Kanban specifies the kind and quantity of products which a manufacturing process should withdraw from a preceding process. This means that the required products are taken from a buffer inventory. A Production-ordering Kanban specifies the kind and quantity of products which the preceding process must produce.
The amount of Kanban-cards per part depends on the demand per day or week, and on the steadiness of the demand. Every Kanban-card represents a defined amount of parts to be produced each time. By passing on Kanban-cards upstream through the operations process, the product is actually pulled through the system. It therefore requires a steady demand on a particular item to give a satisfactory result. Effectively it can only handle a very limited number of variants efficiently, since the total WIP increases with the number of variants (Lödding et al., 2003).
Constant Work in Progress (Conwip)
Conwip is developed as a system with the benefits of a pull system to be used in a wide variety of manufacturing environments (Spearman et al., 1990). Conwip is a generalised form of Kanban, and like Kanban it relies on signals. The difference with Kanban is that when a card needs to be filled, it is sent directly to the beginning of the flow where it waits in a queue, instead of moving one process upstream. It is therefore a hybrid system of both push and pull, as the trigger is the demand pulling parts into the system, pushing it downstream through the system. To control the WIP, Conwip complies with the view of TOC to balance the flow. The operation of a Conwip line is regulated by the bottleneck resource (Spearman et al., 1990). In the best case scenario with a sufficient demand and a correct number of cards, a Conwip system will maintain just enough WIP to keep the bottleneck busy.
Conwip as a pull system, shares the advantages of a pull system with respect to WIP control, while it is more robust, flexible, and easier to implement than other pull systems (Framinan et al., 2003). Since the WIP is kept at a constant level making use of backlog lists, it is a centralized method. Also Conwip can handle a higher variation than Kanban, as the Conwip cards are not part specific, and relies less on inventory buffers. These are important characteristics for manufacturing companies that try to control inventory levels and at the same time, face uncertain and dynamic environments where Kanban does not perform well.
Load oriented order release (LOOR)
The LOOR system is developed by Bechte in the year 1980 (Bechte, 1988). It is a combination of a centralized WIP control, and a load balancing algorithm based on load limits of the work. The algorithm makes it possible to get a higher performance, than only controlling the WIP. The system holds back selected orders, until the current activity level indicates that resources required for it are actually available. Bechte (1988) presents empirical evidence for reduction of both WIP inventory and throughput time, compared to the situation before the LOOR implementation. There are, however, also simulations performed on job-shop environments that did not show consistent improvement (Newman and Maffei, 1999). In most of these cases, the WIP and process lead times were decreased, but the overall reliability was reduced.
Paired-cell overlapping loops of cards with authorization (Polca)
therefore decides which products are being produced. Besides the loop on pairs of cells, another important difference between Polca and Kanban is that Kanban uses cards to replenish inventory, and Polca cards to fill up available capacity. Polca can therefore better handle a more complex production flow and higher variability.
Decentralised WIP (Dewip)
Dewip is a manufacturing control system aimed at achieving short and reliable throughput times. The system designs decentralised control loops between the manufacturing work centers. The urgent and available customer orders enter a pool, from which the manufacturing work centres draw if the state of manufacturing allows. Lödding et al. (2003) present empirical evidence that Dewip achieves roughly the same performance lead times as Conwip, and worse performance than LOOR due to the missing load balancing algorithm. However, unlike Conwip, Dewip can function well within a more complex flow and has a decentralised level of aggregation unlike both LOOR and Conwip.
3.3.2 LEAN MANUFACTURING
Lean manufacturing is a generic process management philosophy that evolved from the Toyota Production System (TPS) (Womack et al., 2007). The philosophy encompasses several other methods that include the ‘lean’ idea, for instance: Just-In-Time, Kanban, Single Minute Exchange of Die, and Six Sigma. Womack and Jones define a set of five basic principles that characterize a lean enterprise (Womack and Jones, 2003):
n A very important part of lean thinking is ‘value’, and product value can only be
defined by the customer.
n Identify the steps within the value stream, eliminating every step and action that does
not create value.
n Make the remaining value-creating steps occur in a tight and integrated sequence, so
that products will flow smoothly towards the customer.
n Let the customer pull the product from you as needed rather than pushing products,
often unwanted, onto the customer.
n Pursue perfection through continuous improvement.
A lean technique that is often used to analyse the flow of materials and information to bring a product to a customer is Value Stream Mapping (Rother and Shook, 2003). It is commonly used in lean environments to identify opportunities for improvement in lead time. Within a value stream map the non-value adding steps are divided from the value-adding steps within a single representation, in which ‘waste’ is visualised.
Just-In-Time (JIT)
Throughout the literature, several different definitions of JIT are being used, although in many cases it is seen as a general philosophy of reducing waste and improving product quality (Brown and Mitchell, 1991). Companies following the JIT philosophy or a JIT based method, often work with small multifunctional groups. For the creation of these groups, the functional layout of the factory is redesigned into several cells. These cells exist from several dissimilar but sequentially complementary machines, each processing the needs of a particular family of parts. Also JIT manufacturing is following a pull rather than a push strategy.
implementation of JIT, depends on the reliability of the suppliers. The reliability will have to manifest itself into the internal reliability of the quality and reliability of the equipment, thus the total reliability of the operations process.
Single Minute Exchange of Die (SMED)
The concept for Single Minute Exchange of Die (SMED) arose around the 1960s at the company Toyota. The main concept of SMED is the calculation of the economic lot size of the ratio of actual production and the change-over time (McIntosh et al., 2000). Change-over time stands for the time needed to switch a machine in order to work on a different product. When change-over time is high, valuable production time may be lost. The goal of SMED is to provide a rapid and efficient way of converting a manufacturing process from running the current product to running the next product. It is therefore also often called Quick Change-over (QCO). Several authors describe different implementation stages of SMED, although two very important steps are:
1) Separate the internal and external activities. Internal activities refer to those activities that can only be performed when the process is stopped, and external activities can already be done when the process is still running.
1) Convert internal activities into external where possible.
A rapid change-over capability is an essential enabling tool for competitive flexibility time (McIntosh et al., 2000). When the mix-flexibility is increased a higher variety of products will have to be produced. Reduction of change-over time is therefore important to lower throughput time and inventory, improving cost, delivery, and flexibility.
5S Method
The 5S method gets its name from five different Japanese words that start with the letter S. Its key targets are workplace morale and efficiency. The benefits from the methodology come from deciding which resources should be kept, where it should be kept, and how it should be kept. This decision making process should include employees and build a clear understanding of how work should be done. It thereby also creates employee ownership inside the process. The 5S’s are:
n Seiri (Sort); sort all the resources within the work area and eliminate everything that is
not essential.
n Seiton (Straighten); keep an orderly workplace by arranging the resources in an order
that promotes work flow.
n Seiso (Shine); keep a workplace clean and neat. n Seiketsu (Systemize); standardize work practices.
n Shitsuke (Sustain); sustain discipline, referring to the previous S’s. Ensure that there is
not a fall back into the previous ways of working.
There are several similar methods with their own alternative acronyms, for example the 5C’s (Clearout, Configure, Clean, Conformity, and Custom), CANDO (Cleaning, Arranging, Neatness, Discipline, and Ongoing improvement). Also there are several additions made to the 5S method, adding concepts as Safety and Security.
Six Sigma
DPMO = (1.000.000 x number of defects) / (number of units x number of opportunities per unit)
Defects are defined as a non-conformance of a quality characteristic to its specification. The opportunity for defects (and therefore how to count and categorize defects) can be difficult, but generally organizations consider the following when defining the number of opportunities per unit:
n Knowledge of the process under study. n Industry standards.
n When studying multiple types of defects, knowledge of the relative importance of
each defect type in determining customer satisfaction.
n The time, effort, and cost to count and categorize defects in process output.
Six Sigma consists of a set of practices originally developed by the company Motorola, in order to systematically improve processes by eliminating defects. The practices were inspired by quality improvement methods such as Total Quality Management (TQM) and Zero Defects. Like its predecessors, Six Sigma asserts the following:
n The key to business success is a continuous effort to reduce variation in the process
output.
n In order to succeed at achieving a sustained quality improvement, commitment from
the entire organisation is required, particularly from the top-level management.
n Operations processes can be measured, analysed, controlled, and improved.
3.4 CONCLUSIONS
Summing up this chapter we make the following conclusions regarding the second research question:
n What is the relationship between flexibility and operations process?
Operations Process Design and Planning & Control are in two ways connected with the competitive objectives. First, customer needs in new and current products are being translated into competitive objectives which are embedded within the operations strategy. Second, the fulfilled orders, after sales service, and new product development influence the customers’ needs.
n Which type of operations design fits a flexible operation?
Intermittent operations have a better fit with competitive flexibility, due to higher variety and lower product volume. For production, a make-to-order, buy-to-order, or design-to-order strategy is the best option when a higher mix-flexibility or even change-over flexibility is desired. The OPP should be placed upstream as much as possible. When a full make-to-order strategy is not possible a push strategy can be used for the downstream flow, combined with a pull strategy for the upstream flow. Finally, when designing the operations process it is important to keep in mind the influence of a possible bottleneck.
n Which methods for planning & control fit a flexible organisation?
If a higher variety is desired, methods like BS and Kanban are less efficient. Methods that have a better fit with a flexible organisation are Conwip, MRP-II, Loor, Polca, and Dewip. However, this does not mean that BS and Kanban cannot be used at all within a flexible organisation, as more than one method can be used at the same time, each controlling different flows.
4 THE CURRENT SITUATION
Within Section 4.1, a collection is chosen which will be used to describe the current situation. This collection is also used within the experiment in Chapter 6. Section 4.2, describes the current process design of the chosen collection. Within the process design we present and clarify the several flows with their OPP. Section 4.3, describes the method for planning and control of the chosen collection. Finally, Section 4.4, will include a measurement of the competitive objectives within the current situation.
4.1 COLLECTIONS WITHIN GM’S ASSORTMENT
4.1.1 GM’S CURRENT ASSORTMENT
GM’s assortment consists of three different brands namely: Times, Motto, and Delato. All products are sold through a retailer network, in which GM is responsible for the development, production, and marketing of the brands. The Times brand holds classical collections and is the oldest brand that GM’s produces. Recently the brand has been updated to combine both a classical look with a modern touch. Delato was the second brand that GM introduced, and it was born from the idea to create more modern collections. At this moment it is the bestselling brand from GM. In order to expand GM’s retailer network beyond the Dutch borders, GM launched a new Brand named Motto
in the year 2006.
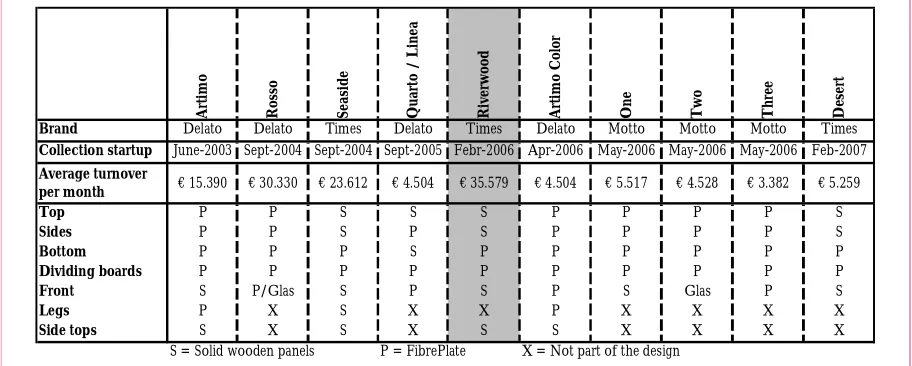
GM tries to design one new collection per brand each year; with an average of four different collections per brand, this means that most collections have a life cycle of four years. Figure 4-1 describes the current chest collections from GM. Per collection, the start-up date is given, the average turnover per month (from Januari-2007 to September-2007), and an overview of the different parts within the design.
For the experiment, it is important that the chosen collection is not too old, as the collections life cycle is not very long. Also the average turnover has to be substantial so that the order intake will provide a steady demand for production. A turnover of € 10.000 per month equals an average of 10 chests sold per month. Next to the collections age and turnover, the different parts on the chests within the collection are important. There has to be a good mix between fibre plating and solid wooden panels to make it a good representation of the whole assortment. With these considerations in mind, we choose the collection Riverwood for the experiment.
A
Brand Delato Delato Times Delato Times Delato Motto Motto Motto Times
Collection startup June-2003 Sept-2004 Sept-2004 Sept-2005 Febr-2006 Apr-2006 May-2006 May-2006 May-2006 Feb-2007 Average turnover
S = Solid wooden panels X = Not part of the design
4.2 CURRENT PROCESS DESIGN
4.2.1 FACTORY LAYOUT
The layout of GM’s factory can be seen as a combination of 3 separate parts (see Appendix C). The first part consists of the first 7 sub-processes (shortening, slicing, sorting, gluing, sand grinding, CNC & traditional, and assembly). At GM this part is called the ‘Machinale’, and it is where most of the actual woodworking takes place. The second part (number 8 in the layout) is a large inventory for semi-finished components. From the inventory the components are set out towards the final part which is called ‘Expeditie’, and it includes sub-processes 9 to 13 (finishing, varnishing, sand grinding, drying, and shipping). Each of these subparts used to have its own manager, since the large reorganisation in 2006 both the first and third part are controlled by a single manager.
Within the separate parts of the factory several departments can be defined, with each department having their own machines. For the readability in flows we will use only the names of the departments. These departments with their sub processes are:
‘Machinale’ (first 7 sub-processes) ‘Expeditie’ (sub-process 9 to 13)
n Raw wood naturally differ between the several chests within a single collection, although they are produced in the same way. Some of these parts follow the same flow through the factory. If these are combined, there are five different flows visible for the Riverwood collection, which are stored at an inventory for semi-finished products. All of these five flows currently form a separate production request, belonging to a production project that represents a final product. The products that result from flows one to five are stored within the semi-finished products inventory, waiting for a customer order. The sixth flow represents the activities that are needed based on customer orders. A full schematic view of the process flow is given in Appendix D.
1) Top, sides, and side-tops (solid wood) 2) Bottom, and dividing boards (fibre plates) 3) Front (solid wood)
4) Drawers (solid wood) 5) Plinth (solid wood)
The first flow (top, sides, and side-tops) is started from raw wood inventory and directed through the raw wood department, panel production, CND & traditional, and finally assembly. The second flow (bottom, and dividing boards) contains an outsourced activity for sawing the fibre plate to minimise waste. After the sawing process, the fibre plates are directed through the CNC & traditional department and combined with the first flow at the assembly into the body of the chest. The assembled chest body is then stored at the inventory for semi-finished products. Figure 4-2 presents these two flows.
Figure 4-2: Flows one and two (top, sides, side-tops, bottom, and dividing boards) of the current situation
GM altered the production of chest fronts in 2006, when the OPP for tables was replaced from the semi-finished products inventory towards a solid wood panel inventory. The advantage of this change was that there was far less inventory needed as only the panel size was fixed. This means that for every customer order, the panels still have to go through the CNC & traditional department where it is altered into a defined tabletop. Due to satisfactory results with the solid wood panel inventory, the chest fronts are also produced out of this inventory. Figure 4-3 presents the flow for panel production.
Figure 4-3: Flow three (front) of the current situation
The fourth flow (drawers) is almost equal to the first, although it is separated because the drawers can be used in different sizes and types of chests within the same collection. They are therefore produced in larger quantities than the different chest bodies. Figure 4-4 presents the flow for the production of drawers.
The fifth flow (plinth) is less easy to define, as the initial inventory is variable. The plinths are made from waste that is created by the production process. The most common input for plinths are wooden boards that are not suited for a panel. This form of waste is created at the sorting activity, but will suffice for small parts like plinth. When the waste inventory is depleted, regular raw wood will be used for the production. After production the plinths are stored in the inventory for semi-finished products. The flow for plinth production is represented in Figure 4-5.
Figure 4-5: Flow five (plinth) of the current situation
Each customer order is planned for a ‘finishing & assembly’ week. Within this week all the parts that are needed are delivered by the semi-finished products inventory to the finishing & assembly department. As we described, since the year 2006 chest fronts are not stored in the semi-finished products inventory anymore. These are therefore made by the CNC & traditional department and delivered in the first week at finishing & assembly. The products are then made ready for varnishing & painting. Within this first, week a clustering is made on colour to reduce production time and waste for varnishing & painting. After the products are varnished or painted, the assembly & shipping department will fully assemble the chests adding the details as metalwork and hinges. This whole process takes three weeks, from which the actual shipping to the customer uses one week. A representation of the customer order production flow is given in Figure 4-6.
Figure 4-6: Customer order flow of the current situation
4.2.3 ANALYSIS OF THE CURRENT PROCESS DESIGN