WATER CIRCULATION PATTERN FROM SEA SURFACE CURRENT AND CHLOROPHYLL-A DERIVED USING SATELLITE DATA IN THE SOUTH CHINA SEA
Mohd Ibrahim Seeni Mohd, Samsudin Ahmad, Fung Fook Wah and Kueh Hsiao Chin Faculty of Geoinformation Science and Engineering
Universiti Teknologi Malaysia 813I0 Skudai, Johor,
Malaysia.
Tel: +607-5530800 Fax: +607-5566163 E-mail: mism(uJks".utm.l11"
KEYWORDS: JASON-I, MODIS, sea surface current, chlorophyll-a, satellite altimetry.
Abstract:
Remote sensing satellite data is useful in chlorophyll-a concentration and sea surface current mapping applications. This paper reports on a study carried out to ana,.rzc the water circulation pattern from the generated sea surface current velocity md chlorophyll-a concentration during the monsoon seasons from remote sensing ,,:ta. Merged Sea Level Anomaly (MSLA) with Orbit Error Reduction merged satellite altimetry data set is used to generate the velocity vector map by using the geostr. ;;hic velocities method over the South China Sea (SCS). The frequent MSLA data whi <1 is provided by the AvIsa server twice per week is useful for sea surface current
su.
ties. The sea surface current velocity vectors are mapped in 1/3° Mercator projection. M ,:ti-temporal Moderate Resolution Imaging Spectroradiometer (MODIS) daily data ~"e used in the chlorophyll-a concentration mapping. The correlation between sea SUL,.ce current and chlorophyll-a during the monsoon seasons is approximately 0.7-0.8, the South China Sea. The sea surface current circulation during the north-east monsc is anti-clockwise at the middle of SCS, however it is clockwise off the coast of Terenh"Li and Gulf of Thailand. For the inter-monsoon, the circulation pattern for the mide' )f SCS is clockwise and it is anti-clockwise off the coast of Terengganu and Gu'~<
Thailand. For the south-west monsoon, the circulation pattern is clockwise off the ,L:t of Terengganu and Gulf of Thailand. However, it is approximately in a upward dire, 'it)':from south to north with clockwise water circulation pattern in the middle of SCS '11e knowledge on sea surface current and chlorophyll-a concentration is importa: 11' fisheries and ocean science studies.
1.0 Introduction
Chlorophyll-a is a green pigment that is present in all plant life and is new'''1 for photosynthesis. The amount of chlorophyll-a present in water depends on the ar. im of algae and can also be used as an indicator of phytoplankton abundance and biom' "
coastalwaters. The concentrationofchloro phyll-a also canbe usedas com mon measure
ofwaterquality.It isnatural ")1'chlorophyll-alevelsto change (WeI'time. Normally.the
chlorophyll con cent ration is high er in coastal areas than in the middle of the sea .
How ever. some areas in the middle ofthe sea also have high chlorophyll co ncentrat ions
and this maybe causedbystrong curren tsthathring thewater withchlorophyll from the
coasta lareas, The mo ns oo nwinds also affectthe chlo rophyll distribution and upwelli ng
brings cool. nutrien t- rich water Ih.1111 the ocean depths w the surface allowin g
phy topla nkto nto grow (Abbottet~1.. 1995).
Rem ote sensing satell itesprovide large areacoverage and a range of temporal
scales which allowthe param eters to he stud iedcont inuously. The vloderate Res olutio n
Imaging Specr ro rad iomct cr (tvIODIS), first launched on the Terra satellite in Decembe r
1999 was used in the study. The relatively good resolutio nand daily overpasse s due to
wide swathmake \10 DIS suitablefor chlorophyll-a monitoringovertheSouth China Sea.
Asforsea currentstudy.eachmarginalsea is uniquein itscharacteristicswhichis
influenced by the mo nsoon. climate and it's location. Conve ntional techniqu es usc
anc hored buoys (Eule rian approach ), floating buoys (Lagran gian approach), and
expendable bathythermogra phs(XJ:lT) or Arial XBT (!\XBT ) which cover lim ited are as
(Cha d Hammons. 20U:;). How ever. remote sens ing satellite data pro vide frequent world
wide data coverage and is less expensive.The use of mic row ave sensor will enable the
dataobse rv at io n to bedone without clou d cover problem .
The Jason-l satellite launched in 15 September 20C)J is a valuable follow- on to
the high-p recision, alo ng-track ocean topography measurements provided by
TOPEX/POSEIDO ,\; satcllitc. It ensures a smooth transition lrorn j'/P sea-level
observationsto theJaso nseries.Thecapability of 10daysrevisit is usefu llor mostofthe
ocean wate r observation. The payload of the satellite incl ude the C\iES Poseidon-Z
Altim eter (C- and Ku- band) to measure height ~bO\T sea surf ace and l\l\S!\ Jaso n Microwave Radiometer (JMR) to measure water vapor along altimeter path to COITeet pulse delay. The sea level ano maly data were used to derive the sea surface CUITent
velocitie sand itscirc ulation.
The "Javy ModularOcean Data Assimilation System (\10DAS)useshistorical in
situ data to derive statistica l relations bet wee n surface observat ions(d ynamic height and
temperature ) and subs urface observations (temperature and salinity ). The statistical
co rrelation bet ween sur face and subsurfac e observatio ns enable the derivatio n of the
spatial and seas onal variations which depend on local environment and dominant
ocea nographic proce sse s.Acompa rison between thecalculated MSLi\satellitealtimetry
and MODASdatascionthesamedateshavebeendon e tovalidatetheresul ts.
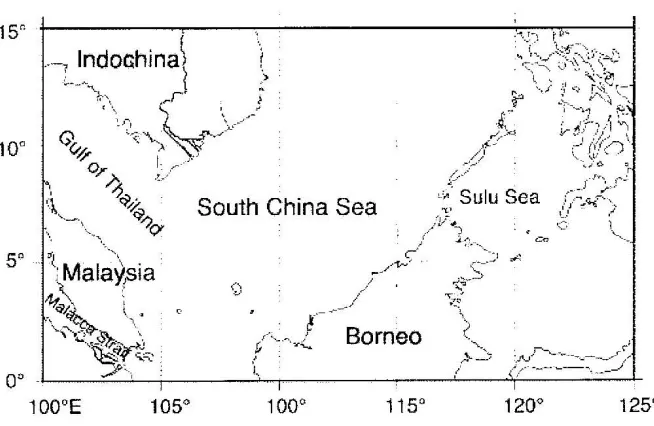
2.0 St ud yar ea
The study was carried (Hit in the So uth China Sea (Figure I) which und ergoes
South China Sea
15"
10"
5'
0" 100'E
I
1050
,~
r _~ .'
r; ...
t
I
1000
Borneo
115' 1200
125'
ChI= a(L; 551/L,443)b Figure 1: Geographic Extent of Study Area.
3.0 Satellite data processing
The satellite data processing involved two parts, i.e. ( i ) MODIS data processing for chlorophyll-a, and ( ii ) MSLA satellite altimetry data processing for sea surface current.
3.1 Chlorophyll-a processing
The multi- temporal level IB MODIS data covering different dales were downloaded from GES DAAC archive for the year 2003 and 2004. The downloaded data were for different monsoon periods, which include north-east monsoon period (December - February), inter-monsoon period (March-May and September-November) and south-west monsoon period (June -August).
All the images were geometrically corrected. The data were processed to extract normalized water-leaving radiance. The chlorophyll-a concentration was estimated by using the algorithm below:
where,
ChI= chlorophyll concentration (mg m-3) a and b= regression coefficients
LWxn = water-leaving radiance in wavelength xxx run
A regression analysis between measured chlorophyll concentration and water-leaving radiance from MODIS data was carried out with four in-situ data observed during satellite pass using the algorithm and the R2value is 0.84. The date of the MODIS data used here is the same with the in-situ data. Other algorithms were also tested in the study which gave lower R2 values than the Gordon's algorithm. The Gordon's algorithm was used to calculate the chlorophyll concentration at three check points by using the coefficients that were obtained. Comparison of measured chlorophyll and calculated chlorophyll from MODIS data for the check points is shown in Table 1. The chlorophyll concentration values obtained from the Gordon's algorithm were better than the values obtained from other algorithms.
Table: 1 Comparison between measured and calculated chlorophyll-a using Gordon's algorithm.
Measured Calculated Difference Check Points Chlorophyll Chlorophyll (mg/rrr')
(mg/m') (mg/nr')
5 0.413 0.421 0.008
6 0.428 0.453 0.025
7 0.529 0.610 0.081
Therefore instead of using four sampling points in the Gordon's algorithm, six sampling points were used in the regression analysis between measured chlorophyll concentration and water-leaving radiance with R2of 0.94. The derived coefficients were used to calculate chlorophyll concentration for both 2003 and 2004 images (Figures 3, 4 and 5).
3.2 Sea surface current velocity processing
The geostrophic velocities are derived from the sea level anomaly slope, with U (zonal velocity) and V (meridian velocity) combined to give velocity vectors by using the following geostrophic relation:
U= - g/f {[OTJ/oy -OTJ%y exp(-l/Lu
where,
f = 2Qsin ¢
Q = angular velocity of earth's rotation = 7.29 x 10⁻⁵rad/sec
¢ = latitude
1") = sea surface height anomaly D ~delta
L, and L,= the area where Corio lis force become dominant. (Source: Kaoru et. al., 1999)
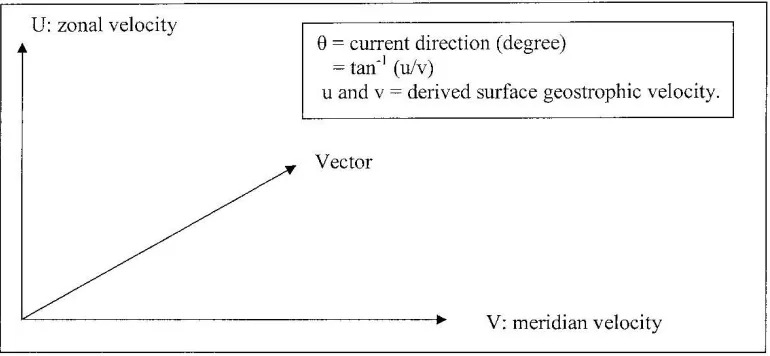
The sea surface current velocity vector is obtained by using the trigonometry as shown in figure 2.
U: zonal velocity
8= current direction (degree) = tan' (u/v)
u and v= derived surface geostrophic velocity.
Vector
V: meridian velocity
Figure 2: Trigonometry method.
The sea surface current speed is calculated using the kinetic algorithm:
where,
V= speed (cm/s),
4.0 Results
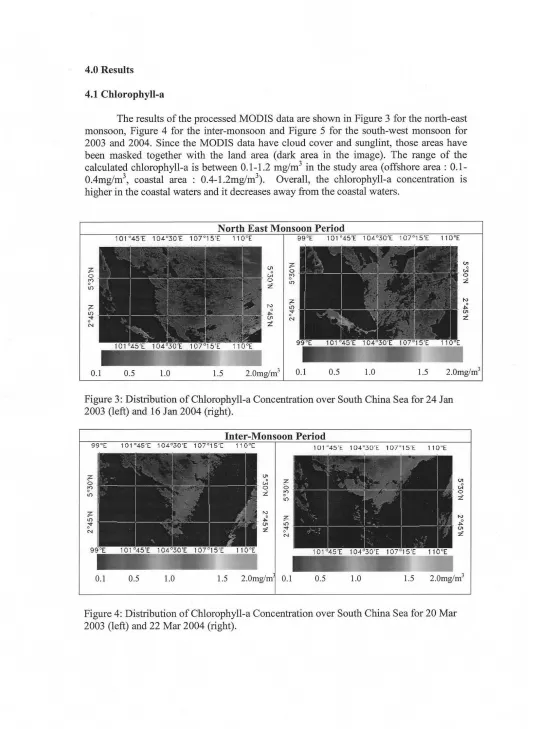
4.1 Chlorophyll-a
The results of the processed MODIS data are shownin Figure 3 for the north-east
monsoon, Figure 4 for the inter-monsoon and Figure 5 for the south-west monsoon for
2003 and 2004.Since the MODIS data have cloud cover and sunglint, those areashave
been masked together with the land area (dark area in the image). The range of the
calculated chlorophyll-a is between 0.1- 1.2 mg/nr' in the studyarea (offshorearea :
0.1-OAmg/m3
, coastal area: OA-1.2mg/m\ Overall, the chlorophyll-a concentration is
higher in the coastal watersand it decreases away from the coastal waters.
NorthEast Monsoon Period
z
~
N0.1 0.5 1.0 1.5
'"
70: :;>0
0 on
Z
N 7on
,;: :;'
'"
NZ
2.0mg/m3 0.1 0.5 1.0 1.5 2.0mg/m3
Figure 3: Distribution of Chlorophyll-aConcentration over South China Sea for 24 Jan
2003 (left) and 16 Jan 2004 (right).
Inter-Monsoon Period
1.5 2.0mg/m3
1.0 0.5
1.5 2.0mg/m 0.1
1.0 0.5
0.1
'"
c: 7 en
0 0 0:
Z
'"
0"'
Z7 z N
'"
'"
,;::;' :;'
'"
'"
'"
zFigure 4: Distributionof Chlorophyll-aConcentration over SouthChina Sea for 20 Mar
South West Monsoon Period
'"
z
~
'"
z0 0
z ::'
on
"
,:
'"
'"
z on;t N
99°E 101°4 5'[ 104°30 '[ 10 r15'E 110 "E ~ 99°E 101° 45'E 104°30'[ 10 7"15 '[ (XI on
0.1 0.5 1.0 1.5 z.Omg/rn' 0.1 0.5 1.0 1.5 2.0mg/m3
Figure 5: Distribution of Chlorophyll-aConcentration over South China Sea for 8 June
2003 (left) and 17 June 2004 (right).
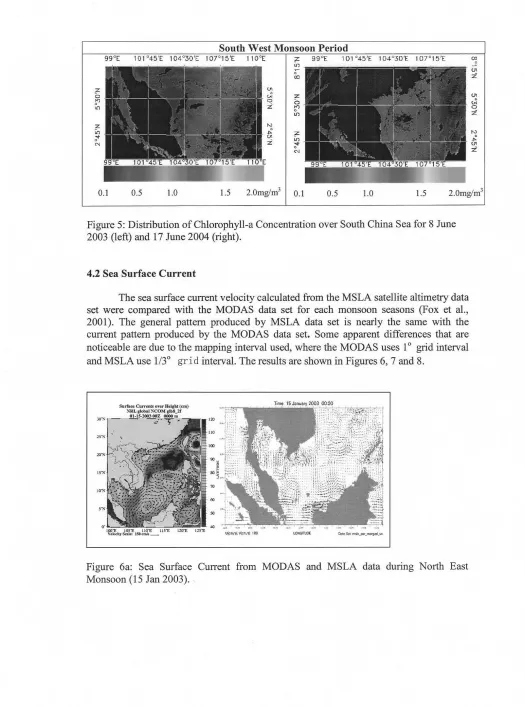
4.2 Sea Surface Current
The sea surface current velocity calculated from the MSLA satellite altimetry data set were compared with the MODAS data set for each monsoon seasons (Fox et aI., 2001). The general pattern produced by MSLA data set is nearly the same with the current pattern produced by the MODAS data set. Some apparent differences that are
noticeable are due to the mapping interval used,where the MODAS uses 10
grid interval
and MSLA use1/30
gri d interval. The results are shown in Figures 6,7 and 8.
Sit"". ""CUrr...O'rU"lIei~1I1Ie",) "'R L global:"COMglbB..2r
Ol·15-200300Z0000",
:JO"S - - - ----:'.'.T ..
Figure 6a: Sea Surface Current from MODAS and MSLA data during North East
Surf""" CarTen" on,. H"'lIbl (om)
NRLIllobal"'-CO~llIlbS.Jr
01·17·2004 OOZססoo..
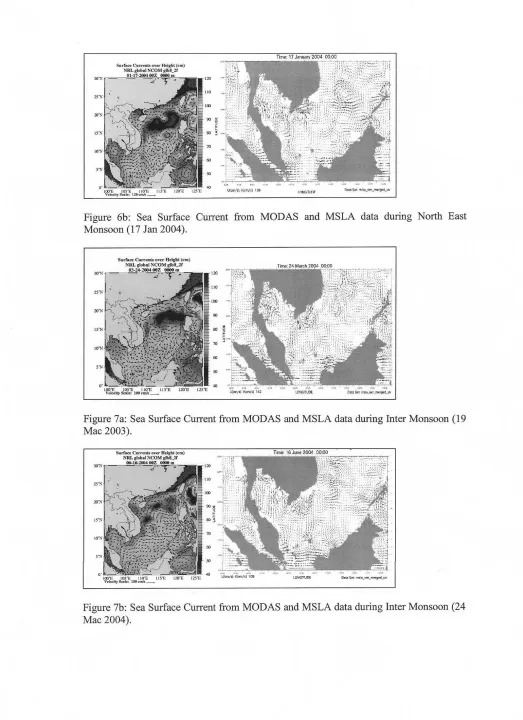
Figure 6b: Sea Surface Current from MODAS and MSLA data during North East Monsoon (17 Jan 2004).
~
~"a."~·';''f'Il/<l-;:'2
Figure 7a:Sea Surface Current from MODAS and MSLA data during Inter Monsoon (19 Mac 2003).
Surf"",, CUI'T,,"b 0... Helghl(trll)
NRLRlobal:'\COM IIII>S..)I' 06-16-2004eezoooeID
«:/
O' _
SurfaceCurnnls overIIdgbl (em)
:-'''RLgloball'iCO~1glb8_2f
(l6.18-2OO300Z0000 m
IS:i
lO:i
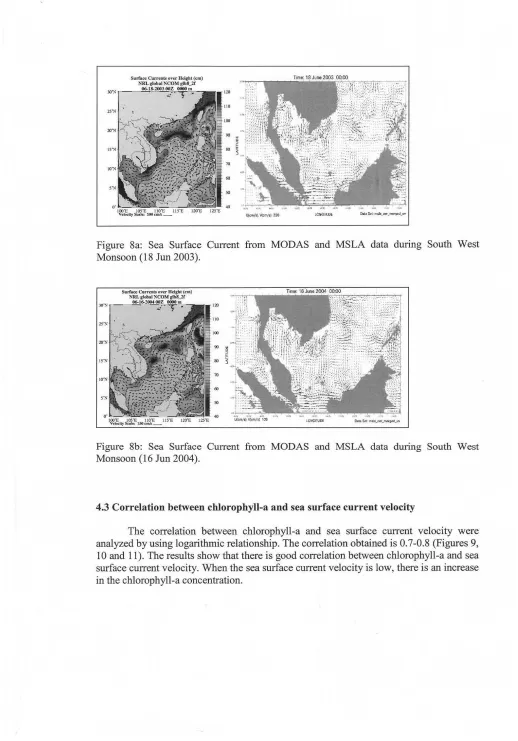
Figure 8a: Sea Surface Current from MODAS and MSLA data during South West
Monsoon (18 Jun2003).
SurfaceCarr""U overlI~g.t(ctn) ]I,"RL global:O;COMglb8_2 r
(16.16-2004ooz0000 IU
- - - --:,··T
-Figure 8b: Sea Surface Current from MODAS and MSLA data during South West
Monsoon (16 Jun2004).
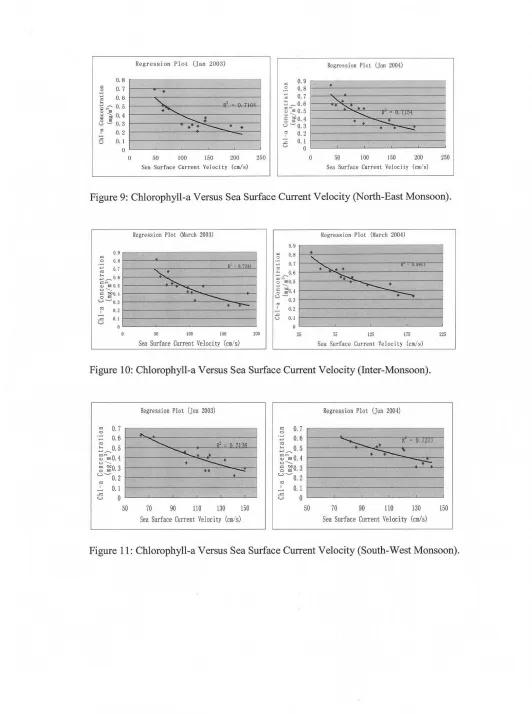
4.3 Correlation between chlorophyll-a and sea surface current velocity
The correlation between chlorophyll-a and sea surface current velocity were analyzed by using logarithmic relationship. The correlation obtained is 0.7-0.8(Figures9,
RegressionPlot (Jan:WO:l) Regressi onPlot (Ian 2004)
0.8 0.9
.
~
0.7 • c 0.8
.
0.6
<,
,
- ;:;~0.O.67~
~r0.5
.
,
~~0..5
..
·.
<, "C". o~ ~0.4 < , :
3
J~: ~•
u ~0.3
.
--
•
•
c,
.
.
.
.
--..:0.2 c, 0.2
e
0.1 -~ O.10 u 0
0 :10 100 150 200 2;)0 0 so 100 1.50 200 250
SeaSurfaceCur rent Velocity (cm/s) SeaSurfaceCurrent Velocitykm/s)
Figure 9: Chlorophyll-aVersus Sea Surface CurrentVelocity(North-East Monsoon).
Regress ionPlot (~arch2003) Regress ionPlot (\larch 2004)
0. 9
o9 c
0.'
.
~ c
'-0 o•
R'-O.724~ 0.1 ;-;:...
.
,••u, " "E
0.7 <,•
~~O.6•
~
~,:;--0.6 -...,.. coEO.5
---
•
~ EO.5
~ "~
u~ ; ~0.1
~ ~O. ~
.
-.,
0
---
----'
u-u - 0 .3 f 0.3
·
, 0.2.
-.-
.
-
0. 2! ~
= o., u o.,
u
•
0 0
0 50 '00 150 200 25 15 125 175 225
Sea Surface Cur rent Velocity (em/s) Sea Surface Cur r ent Ve loc ity(cm/s)
Figure 10: Chlorophyll-aVersus Sea Surface Current Velocity (Inter-Monsoon) .
RegressionPlot (Inn 2003) Regression Plot (I un 200,1)
~ 0.7 ~ 0.7
0
i:.. 0
0.6 <, 0.6
-...
R~:727r"i·
02_" " '" ee•
-=_0.5 ~ 0.5
...
--
~~'"'eO.4
•
•
:;;'"'1::0. 4•
u~
•
<«:
u~-r'-~ -r'-~O.3
..
-c ~ ~O.3~-0.2 ' - ' -0.2
•
,O.I , O. I
-
-= 0 = 0
u u
50 70 90 110 130 150 50 70 90 110 130 150
Sea Surface Current Velocity (ce/s) Sea Surface Current Velocity (ca/s)
5.0 Conclusions
The chlorophyll-a concentration study shows that chlorophyll-a is higher at the coastal waters (0.4-1.2mg/m3) and decreases away from the coastal waters (0.1-0.4mg/m3) . The correlation between sea surface current and chlorophyll-a during the monsoon seasons is approximately 0.7-0.8 in the South China Sea. When the sea surface current velocity is low, there is an increase in the chlorophyll-a concentration. The sea surface current circulation during the north-east monsoon is anti-clockwise at the middle of SCS, however it is clockwise off the coast of Terengganu and Gulf of Thailand. For the inter-monsoon, the circulation pattern for the middle of SCS is clockwise and it is anti-clockwise off the coast of Terengganu and Gulf of Thailand. For the south-west monsoon, the circulation pattern is clockwise off the coast of Terengganu and Gulf of Thailand. However, it is approximately in a upward direction from south to north with clockwise water circulation pattern in the middle of SCS.
Acknowledgements
We would like to thank Prof. T. Yanagi of Kyushu University, Japan and the Japan Society for Promotion of Science (JSPS) for making this study possible.
References
Abbott, M.R., and B. Barksdale (1995). "Variability in Upwelling Systems as Observed by Satellite Remote Sensing." Upwelling in the Ocean: Modern Processes and Ancient Records, Berlin, pp.221-238.
Chad Hammons ASEN (2003). "Using Satellite Altimetry to Detect Ocean Current". Aviso-Altimetry - Newsletter 9.
Kaoru 1chikawa and Shiro Imawaki (1999). "Area Dependency of Estimation Errors in Geostrophic Velocity", Research Institute for Applied Mechanics, Kyushu University, Japan.
Fox, D.N., W.J. Teague and C.N. Barron (2001). "The Modular Ocean Data Assimilation System (MODAS)", Journal of Atmospheric and Oceanic Technology, Vol 19, pp 240-252.
hitp::\\-\\-\V 7J )O.nrisse.navv.miLrnodas:mi2dl-l----'~_L~I()Lpdf